Medford Airbnb Market Analysis 2026: Short Term Rental Data & Vacation Rental Statistics in Massachusetts, United States
Is Airbnb profitable in Medford in 2026? Explore comprehensive Airbnb analytics for Medford, Massachusetts, United States to uncover income potential. This 2026 STR market report for Medford, based on AirROI data from February 2025 to January 2026, reveals key trends in the niche market of 139 active listings.
Whether you're considering an Airbnb investment in Medford, optimizing your existing vacation rental, or exploring rental arbitrage opportunities, understanding the Medford Airbnb data is crucial. Leveraging the low regulation environment is key to maximizing your short term rental income potential. Let's dive into the specifics.
Key Medford Airbnb Performance Metrics Overview
Monthly Airbnb Revenue Variations & Income Potential in Medford (2026)
Understanding the monthly revenue variations for Airbnb listings in Medford is key to maximizing your short term rental income potential. Seasonality significantly impacts earnings. Our analysis, based on data from the past 12 months, shows that the peak revenue month for STRs in Medford is typically October, while January often presents the lowest earnings, highlighting opportunities for strategic pricing adjustments during shoulder and low seasons. Explore the typical Airbnb income in Medford across different performance tiers:
- Best-in-class properties (Top 10%) achieve $7,123+ monthly, often utilizing dynamic pricing and superior guest experiences.
- Strong performing properties (Top 25%) earn $4,790 or more, indicating effective management and desirable locations/amenities.
- Typical properties (Median) generate around $2,542 per month, representing the average market performance.
- Entry-level properties (Bottom 25%) see earnings around $1,300, often with potential for optimization.
Average Monthly Airbnb Earnings Trend in Medford
Medford Airbnb Occupancy Rate Trends (2026)
Maximize your bookings by understanding the Medford STR occupancy trends. Seasonal demand shifts significantly influence how often properties are booked. Typically, Octobersees the highest demand (peak season occupancy), while January experiences the lowest (low season). Effective strategies, like adjusting minimum stays or offering promotions, can boost occupancy during slower periods. Here's how different property tiers perform in Medford:
- Best-in-class properties (Top 10%) achieve 85%+ occupancy, indicating high desirability and potentially optimized availability.
- Strong performing properties (Top 25%) maintain 70% or higher occupancy, suggesting good market fit and guest satisfaction.
- Typical properties (Median) have an occupancy rate around 49%.
- Entry-level properties (Bottom 25%) average 30% occupancy, potentially facing higher vacancy.
Average Monthly Occupancy Rate Trend in Medford
Average Daily Rate (ADR) Airbnb Trends in Medford (2026)
Effective short term rental pricing strategy in Medford involves understanding monthly ADR fluctuations. The Average Daily Rate (ADR) for Airbnb in Medford typically peaks in October and dips lowest during February. Leveraging Airbnb dynamic pricing tools or strategies based on this seasonality can significantly boost revenue. Here's a look at the typical nightly rates achieved:
- Best-in-class properties (Top 10%) command rates of $394+ per night, often due to premium features or locations.
- Strong performing properties (Top 25%) achieve nightly rates of $269 or more.
- Typical properties (Median) charge around $163 per night.
- Entry-level properties (Bottom 25%) earn around $90 per night.
Average Daily Rate (ADR) Trend by Month in Medford
Get Live Medford Market Intelligence 👇

Explore Real-time Analytics
Airbnb Seasonality Analysis & Trends in Medford (2026)
Peak Season (October, August, May)
- Revenue averages $4,545 per month
- Occupancy rates average 61.3%
- Daily rates average $226
Shoulder Season
- Revenue averages $3,442 per month
- Occupancy maintains around 50.1%
- Daily rates hold near $219
Low Season (January, February, March)
- Revenue drops to average $2,137 per month
- Occupancy decreases to average 39.7%
- Daily rates adjust to average $198
Seasonality Insights for Medford
- The Airbnb seasonality in Medford shows highly seasonal trends requiring careful strategy. While the sections above show seasonal averages, it's also insightful to look at the extremes:
- During the high season, the absolute peak month showcases Medford's highest earning potential, with monthly revenues capable of climbing to $4,778, occupancy reaching a high of 65.8%, and ADRs peaking at $236.
- Conversely, the slowest single month of the year, typically falling within the low season, marks the market's lowest point. In this month, revenue might dip to $1,799, occupancy could drop to 30.7%, and ADRs may adjust down to $190.
- Understanding both the seasonal averages and these monthly peaks and troughs in revenue, occupancy, and ADR is crucial for maximizing your Airbnb profit potential in Medford.
Seasonal Strategies for Maximizing Profit
- Peak Season: Maximize revenue through premium pricing and potentially longer minimum stays. Ensure high availability.
- Low Season: Offer competitive pricing, special promotions (e.g., extended stay discounts), and flexible cancellation policies. Target off-season travelers like remote workers or budget-conscious guests.
- Shoulder Seasons: Implement dynamic pricing that balances peak and low rates. Target weekend travelers or specific events. Offer slightly more flexible terms than peak season.
- Regularly analyze your own performance against these Medford seasonality benchmarks and adjust your pricing and availability strategy accordingly.
Best Areas for Airbnb Investment in Medford (2026)
Exploring the top neighborhoods for short-term rentals in Medford? This section highlights key areas, outlining why they are attractive for hosts and guests, along with notable local attractions. Consider these locations based on your target guest profile and investment strategy.
| Neighborhood / Area | Why Host Here? (Target Guests & Appeal) | Key Attractions & Landmarks |
|---|---|---|
| West Medford | A quiet residential neighborhood with easy access to public transportation and parks, making it ideal for families and nature lovers. | Mystic Lakes, Lawrence Memorial Hospital, Medford Public Library, Hormel Stadium |
| Medford Square | The heart of Medford, bustling with shops, restaurants, and cafes. A great spot for guests looking for convenience and local culture. | Medford Square, Usery’s Seafood, Pride Gas Station, Cafe Pesto |
| Wellington | Known for its shopping centers and easy access to the Wellington MBTA station, this area attracts both shoppers and commuters. | Wellington Mall, Mystic River Reservation, Burlington Mall |
| Sullivan Square | An up-and-coming area with rapid development and close proximity to the subway, appealing to young professionals and commuters. | Sullivan Station, Assembly Row, Mystic Open Space |
| Tufts University Area | Home to Tufts University, this area attracts students, professors, and families, creating a vibrant and diverse community. | Tufts University, Carmichael's, Murray Hill Park, The Tufts Art Gallery |
| Medford Hillside | A charming neighborhood with historic homes and scenic views, popular with families and those seeking a suburban feel close to the city. | Pine Banks Park, Medford Historical Society, Brooks Estate |
| Dustin Street | A residential area that features a mix of families and young professionals, great for those looking for a community vibe. | Pine Banks Park, Ideal Market, Ell Pond |
| North Medford | Offers a suburban feel with easy access to Route 93, perfect for guests looking for quiet living while being close to the city. | Harris Park, Medford City Hall, Franklin Park Zoo |
Understanding Airbnb License Requirements & STR Laws in Medford (2026)
While Medford, Massachusetts, United States currently shows low STR regulations, specific Airbnb license requirements might still exist or change. Always verify the latest short term rental regulations and Airbnb license requirements directly with local government authorities for Medford to ensure full compliance before hosting.
(Source: AirROI data, 2026, finding no licensed listings among those analyzed)
Top Performing Airbnb Properties in Medford (2026)
Benchmark your potential! Explore examples of top-performing Airbnb properties in Medfordbased on Trailing Twelve Month (TTM) revenue. Analyze their characteristics, revenue, occupancy rate, and ADR to understand what drives success in this market.
Modern Smart Home / EVCharge / Boston / Harvard / MBTA
Entire Place • 4 bedrooms

5 Bedroom Historic Home minutes to Boston!
Entire Place • 5 bedrooms

Peaceful House (near Green line to Boston)
Entire Place • 3 bedrooms
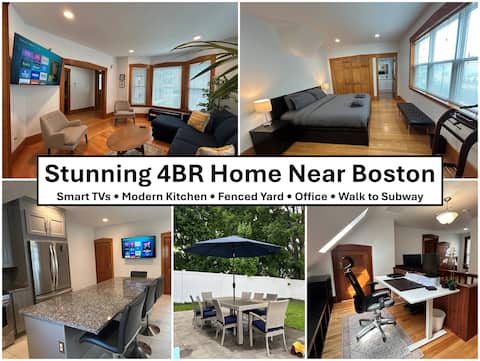
Stunning Home Near Boston Cambridge Tufts Salem
Entire Place • 4 bedrooms

Beautiful 3BR+Office+Parking 13 mins to Boston
Entire Place • 3 bedrooms

5BR Medford |Pet-Friendly w/ Free Parking near Zoo
Entire Place • 5 bedrooms
Note: Performance varies based on location, size, amenities, seasonality, and management quality. Data reflects the past 12 months.
Top Performing Airbnb Hosts in Medford (2026)
Learn from the best! This table showcases top-performing Airbnb hosts in Medford based on the number of properties managed and estimated total revenue over the past year. Analyze their scale and performance metrics.
| Host Name | Properties | Grossing Revenue | Stay Reviews | Avg Rating |
|---|---|---|---|---|
| Felisha | 4 | $172,910 | 195 | 4.93/5.0 |
| Trang | 1 | $161,961 | 148 | 4.97/5.0 |
| Cass | 2 | $157,419 | 505 | 4.72/5.0 |
| Alberto | 2 | $156,404 | 286 | 4.77/5.0 |
| Maria | 4 | $154,374 | 457 | 4.81/5.0 |
| Andy | 6 | $133,697 | 242 | 4.67/5.0 |
| Joseph | 3 | $121,066 | 225 | 4.99/5.0 |
| Karla | 2 | $117,023 | 61 | 4.95/5.0 |
| Benjamin | 1 | $116,080 | 44 | 4.98/5.0 |
| Evolve | 3 | $115,858 | 83 | 4.17/5.0 |
Analyzing the strategies of top hosts, such as their property selection, pricing, and guest communication, can offer valuable lessons for optimizing your own Airbnb operations in Medford.
Dive Deeper: Advanced Medford STR Market Data (2026)
Ready to unlock more insights? AirROI provides access to advanced metrics and comprehensive Airbnb data for Medford. Explore detailed analytics beyond this report to refine your investment strategy, optimize pricing, and maximize your vacation rental profits.
Explore Advanced MetricsMedford Short-Term Rental Market Composition (2026): Property & Room Types
Room Type Distribution
Property Type Distribution
Market Composition Insights for Medford
- The Medford Airbnb market composition is heavily skewed towards Entire Home/Apt listings, which make up 62.6% of the 139 active rentals. This indicates strong guest preference for privacy and space.
- However, a notable 37.4% share for Private Rooms suggests opportunities for budget-conscious travelers or hosts renting out spare rooms.
- Looking at the property type distribution in Medford, House properties are the most common (50.4%), reflecting the local real estate landscape.
- Houses represent a significant 50.4% portion, catering likely to families or larger groups.
- Smaller segments like hotel/boutique, others (combined 4.3%) offer potential for unique stay experiences.
Medford Airbnb Room Capacity Analysis (2026): Bedroom Distribution
Distribution of Listings by Number of Bedrooms
Room Capacity Insights for Medford
- The dominant room capacity in Medford is 2 bedrooms listings, making up 21.6% of the market. This suggests a strong demand for properties suitable for couples or solo travelers.
- Together, 2 bedrooms and 3 bedrooms properties represent 38.9% of the active Airbnb listings in Medford, indicating a high concentration in these sizes.
- A significant 27.3% of listings offer 3+ bedrooms, catering to larger groups and families seeking more space in Medford.
Medford Vacation Rental Guest Capacity Trends (2026)
Distribution of Listings by Guest Capacity
Guest Capacity Insights for Medford
- The most common guest capacity trend in Medford vacation rentals is listings accommodating 6 guests (17.3%). This suggests the primary traveler segment is likely larger groups.
- Properties designed for 6 guests and 4 guests dominate the Medford STR market, accounting for 31.0% of listings.
- 30.3% of properties accommodate 6+ guests, serving the market segment for larger families or group travel in Medford.
- On average, properties in Medford are equipped to host 3.2 guests.
Medford Airbnb Booking Patterns (2026): Available vs. Booked Days
Available Days Distribution
Booked Days Distribution
Booking Pattern Insights for Medford
- The most common availability pattern in Medford falls within the 181-270 days range, representing 38.1% of listings. This suggests many properties have significant open periods on their calendars.
- Approximately 65.4% of listings show high availability (181+ days open annually), indicating potential for increased bookings or specific owner usage patterns.
- For booked days, the 91-180 days range is most frequent in Medford (39.6%), reflecting common guest stay durations or potential owner blocking patterns.
- A notable 35.3% of properties secure long booking periods (181+ days booked per year), highlighting successful long-term rental strategies or significant owner usage.
Medford Airbnb Minimum Stay Requirements Analysis
Distribution of Listings by Minimum Night Requirement
1 Night
25 listings
18% of total
2 Nights
33 listings
23.7% of total
3 Nights
13 listings
9.4% of total
4-6 Nights
7 listings
5% of total
7-29 Nights
17 listings
12.2% of total
30+ Nights
44 listings
31.7% of total
Key Insights
- The most prevalent minimum stay requirement in Medford is 30+ Nights, adopted by 31.7% of listings. This highlights the market's preference for longer commitments.
- A significant segment (31.7%) caters to monthly stays (30+ nights) in Medford, pointing to opportunities in the extended-stay market.
Recommendations
- Align with the market by considering a 30+ Nights minimum stay, as 31.7% of Medford hosts use this setting.
- If feasible, allowing 1-night stays, especially midweek or during low season, could capture last-minute bookings, as only 18% currently do.
- Explore offering discounts for stays of 30+ nights to attract the 31.7% of the market seeking extended stays.
- Adjust minimum nights based on seasonality – potentially shorter during low season and longer during peak demand periods in Medford.
Medford Airbnb Cancellation Policy Trends Analysis (2026)
Limited
2 listings
1.4% of total
Super Strict 30 Days
3 listings
2.2% of total
Flexible
25 listings
18% of total
Moderate
38 listings
27.3% of total
Firm
50 listings
36% of total
Strict
21 listings
15.1% of total
Cancellation Policy Insights for Medford
- The prevailing Airbnb cancellation policy trend in Medford is Firm, used by 36% of listings.
- A majority (51.1%) of hosts in Medford utilize Firm or Strict policies, indicating a market where hosts prioritize booking security.
Recommendations for Hosts
- Consider adopting a Firm policy to align with the 36% market standard in Medford.
- Regularly review your cancellation policy against competitors and market demand shifts in Medford.
Medford STR Booking Lead Time Analysis (2026)
Average Booking Lead Time by Month
Booking Lead Time Insights for Medford
- The overall average booking lead time for vacation rentals in Medford is 40 days.
- Guests book furthest in advance for stays during May (average 75 days), likely coinciding with peak travel demand or local events.
- The shortest booking windows occur for stays in February (average 19 days), indicating more last-minute travel plans during this time.
- Seasonally, Spring (54 days avg.) sees the longest lead times, while Winter (24 days avg.) has the shortest, reflecting typical travel planning cycles.
Recommendations for Hosts
- Use the overall average lead time (40 days) as a baseline for your pricing and availability strategy in Medford.
- For May stays, consider implementing length-of-stay discounts or slightly higher rates for bookings made less than 75 days out to capitalize on advance planning.
- Target marketing efforts for the Spring season well in advance (at least 54 days) to capture early planners.
- Monitor your own booking lead times against these Medford averages to identify opportunities for dynamic pricing adjustments.
Popular & Essential Airbnb Amenities in Medford (2026)
Amenity Prevalence
Amenity Insights for Medford
- Essential amenities in Medford that guests expect include: Wifi, Smoke alarm, Carbon monoxide alarm, Heating, Air conditioning, Hot water. Lacking these (any) could significantly impact bookings.
- Popular amenities like Iron, TV, Essentials are common but not universal. Offering these can provide a competitive edge.
Recommendations for Hosts
- Ensure your listing includes all essential amenities for Medford: Wifi, Smoke alarm, Carbon monoxide alarm, Heating, Air conditioning, Hot water.
- Prioritize adding missing essentials: Carbon monoxide alarm, Heating, Air conditioning, Hot water.
- Consider adding popular differentiators like Iron or TV to increase appeal.
- Highlight unique or less common amenities you offer (e.g., hot tub, dedicated workspace, EV charger) in your listing description and photos.
- Regularly check competitor amenities in Medford to stay competitive.
Medford Airbnb Guest Demographics & Profile Analysis (2026)
Guest Profile Summary for Medford
- The typical guest profile for Airbnb in Medford consists of primarily domestic travelers (85%), often arriving from nearby New York, typically belonging to the Post-2000s (Gen Z/Alpha) group (50%), primarily speaking English or Spanish.
- Domestic travelers account for 85.1% of guests.
- Key international markets include United States (85.1%) and Canada (2.5%).
- Top languages spoken are English (58.9%) followed by Spanish (12.6%).
- A significant demographic segment is the Post-2000s (Gen Z/Alpha) group, representing 50% of guests.
Recommendations for Hosts
- Target domestic marketing efforts towards travelers from New York and Boston.
- Tailor amenities and listing descriptions to appeal to the dominant Post-2000s (Gen Z/Alpha) demographic (e.g., highlight fast WiFi, smart home features, local guides).
- Highlight unique local experiences or amenities relevant to the primary guest profile.
- Consider seasonal promotions aligned with peak travel times for key origin markets.
Nearby Short-Term Rental Market Comparison
How does the Medford Airbnb market stack up against its neighbors? Compare key performance metrics like average monthly revenue, ADR, and occupancy rates in surrounding areas to understand the broader regional STR landscape.
| Market | Active Properties | Monthly Revenue | Daily Rate | Avg. Occupancy |
|---|---|---|---|---|
| Nantucket | 539 | $7,748 | $1045.40 | 41% |
| Pomfret | 15 | $6,549 | $502.74 | 45% |
| Town of East Hampton | 1,327 | $5,945 | $986.02 | 36% |
| Hanover | 33 | $5,826 | $1189.51 | 41% |
| Middletown | 395 | $5,781 | $589.01 | 45% |
| North Andover | 12 | $5,625 | $440.84 | 45% |
| Nahant | 13 | $5,564 | $602.44 | 42% |
| New Shoreham | 120 | $5,359 | $637.79 | 45% |
| South Berwick | 12 | $5,351 | $228.88 | 58% |
| Wellesley | 22 | $5,310 | $520.90 | 50% |