Lenox Airbnb Market Analysis 2026: Short Term Rental Data & Vacation Rental Statistics in Massachusetts, United States
Is Airbnb profitable in Lenox in 2026? Explore comprehensive Airbnb analytics for Lenox, Massachusetts, United States to uncover income potential. This 2026 STR market report for Lenox, based on AirROI data from February 2025 to January 2026, reveals key trends in the niche market of 121 active listings.
Whether you're considering an Airbnb investment in Lenox, optimizing your existing vacation rental, or exploring rental arbitrage opportunities, understanding the Lenox Airbnb data is crucial. Leveraging the low regulation environment is key to maximizing your short term rental income potential. Let's dive into the specifics.
Key Lenox Airbnb Performance Metrics Overview
Monthly Airbnb Revenue Variations & Income Potential in Lenox (2026)
Understanding the monthly revenue variations for Airbnb listings in Lenox is key to maximizing your short term rental income potential. Seasonality significantly impacts earnings. Our analysis, based on data from the past 12 months, shows that the peak revenue month for STRs in Lenox is typically July, while January often presents the lowest earnings, highlighting opportunities for strategic pricing adjustments during shoulder and low seasons. Explore the typical Airbnb income in Lenox across different performance tiers:
- Best-in-class properties (Top 10%) achieve $8,270+ monthly, often utilizing dynamic pricing and superior guest experiences.
- Strong performing properties (Top 25%) earn $5,153 or more, indicating effective management and desirable locations/amenities.
- Typical properties (Median) generate around $2,985 per month, representing the average market performance.
- Entry-level properties (Bottom 25%) see earnings around $1,404, often with potential for optimization.
Average Monthly Airbnb Earnings Trend in Lenox
Lenox Airbnb Occupancy Rate Trends (2026)
Maximize your bookings by understanding the Lenox STR occupancy trends. Seasonal demand shifts significantly influence how often properties are booked. Typically, Augustsees the highest demand (peak season occupancy), while January experiences the lowest (low season). Effective strategies, like adjusting minimum stays or offering promotions, can boost occupancy during slower periods. Here's how different property tiers perform in Lenox:
- Best-in-class properties (Top 10%) achieve 71%+ occupancy, indicating high desirability and potentially optimized availability.
- Strong performing properties (Top 25%) maintain 50% or higher occupancy, suggesting good market fit and guest satisfaction.
- Typical properties (Median) have an occupancy rate around 29%.
- Entry-level properties (Bottom 25%) average 16% occupancy, potentially facing higher vacancy.
Average Monthly Occupancy Rate Trend in Lenox
Average Daily Rate (ADR) Airbnb Trends in Lenox (2026)
Effective short term rental pricing strategy in Lenox involves understanding monthly ADR fluctuations. The Average Daily Rate (ADR) for Airbnb in Lenox typically peaks in July and dips lowest during January. Leveraging Airbnb dynamic pricing tools or strategies based on this seasonality can significantly boost revenue. Here's a look at the typical nightly rates achieved:
- Best-in-class properties (Top 10%) command rates of $619+ per night, often due to premium features or locations.
- Strong performing properties (Top 25%) achieve nightly rates of $417 or more.
- Typical properties (Median) charge around $301 per night.
- Entry-level properties (Bottom 25%) earn around $217 per night.
Average Daily Rate (ADR) Trend by Month in Lenox
Get Live Lenox Market Intelligence 👇

Explore Real-time Analytics
Airbnb Seasonality Analysis & Trends in Lenox (2026)
Peak Season (July, August, October)
- Revenue averages $6,214 per month
- Occupancy rates average 47.3%
- Daily rates average $417
Shoulder Season
- Revenue averages $4,231 per month
- Occupancy maintains around 32.8%
- Daily rates hold near $394
Low Season (January, March, April)
- Revenue drops to average $3,052 per month
- Occupancy decreases to average 25.4%
- Daily rates adjust to average $380
Seasonality Insights for Lenox
- The Airbnb seasonality in Lenox shows highly seasonal trends requiring careful strategy. While the sections above show seasonal averages, it's also insightful to look at the extremes:
- During the high season, the absolute peak month showcases Lenox's highest earning potential, with monthly revenues capable of climbing to $7,251, occupancy reaching a high of 53.1%, and ADRs peaking at $429.
- Conversely, the slowest single month of the year, typically falling within the low season, marks the market's lowest point. In this month, revenue might dip to $2,440, occupancy could drop to 19.7%, and ADRs may adjust down to $371.
- Understanding both the seasonal averages and these monthly peaks and troughs in revenue, occupancy, and ADR is crucial for maximizing your Airbnb profit potential in Lenox.
Seasonal Strategies for Maximizing Profit
- Peak Season: Maximize revenue through premium pricing and potentially longer minimum stays. Ensure high availability.
- Low Season: Offer competitive pricing, special promotions (e.g., extended stay discounts), and flexible cancellation policies. Target off-season travelers like remote workers or budget-conscious guests.
- Shoulder Seasons: Implement dynamic pricing that balances peak and low rates. Target weekend travelers or specific events. Offer slightly more flexible terms than peak season.
- Regularly analyze your own performance against these Lenox seasonality benchmarks and adjust your pricing and availability strategy accordingly.
Best Areas for Airbnb Investment in Lenox (2026)
Exploring the top neighborhoods for short-term rentals in Lenox? This section highlights key areas, outlining why they are attractive for hosts and guests, along with notable local attractions. Consider these locations based on your target guest profile and investment strategy.
| Neighborhood / Area | Why Host Here? (Target Guests & Appeal) | Key Attractions & Landmarks |
|---|---|---|
| Tanglewood | Famous summer music venue that attracts visitors for concerts and festivals. Ideal for families and music lovers looking to enjoy outdoor performances in a scenic setting. | Tanglewood Music Center, Lenox Village, The Mount, Jacqueline Kennedy Onassis Reservoir, The Lenox Library |
| Berkshire Theatre Festival | Historic theatre that draws a cultural crowd with its performances. Perfect for those looking to enjoy the arts and theatre during their stay in the Berkshires. | Berkshire Theatre Group, The Lenox Museum, The Edith Wharton Home, Shopping in Lenox Village, Local Art Galleries |
| Lenox Center | Quaint area with charming shops, eateries, and cultural amenities. Great for travelers who want a taste of local life and easy access to various attractions. | Lenox Town Hall, Lenox Center for the Arts, Strawberry Hill, Canoe Meadows Wildlife Sanctuary, Cranwell Spa & Golf Resort |
| Berkshire Mountains | Stunning natural landscape that attracts outdoor enthusiasts year-round. Perfect for hikers, skiers, and those seeking nature retreats. | Berkshire Scenic Railway, Hiking Trails, Ski Butternut, Canoeing on the Housatonic River, Biking Trails |
| Shakespeare & Company | A prominent theatre company known for its performances of Shakespeare and contemporary plays. Attracts arts-loving tourists and theatre-goers. | Shakespeare & Company Theatre, The Mount, Berkshire Botanical Garden, Lenox Village Shops, Cultural Workshops |
| Kripalu Center for Yoga & Health | Renowned wellness center that attracts visitors for retreats and rejuvenation. Popular with health-conscious travelers seeking meditation and yoga. | Kripalu Center, Yoga Classes, Wellness Retreats, Hiking Trails, Spa Services |
| Cranwell Spa & Golf Resort | Luxury resort offering golf, spa, and fine dining experiences. Ideal for travelers looking for a luxury stay and recreational activities. | Cranwell Golf Course, Spa Services, Fine Dining, Outdoor Activities, Historic Estate |
| The Mount | The historic home of author Edith Wharton, offering tours and beautiful gardens. Great for literary enthusiasts and history buffs. | The Mount House Tours, Gardens of The Mount, Cultural Events, Picnic Areas, Shopping in Lenox |
Understanding Airbnb License Requirements & STR Laws in Lenox (2026)
While Lenox, Massachusetts, United States currently shows low STR regulations, specific Airbnb license requirements might still exist or change. Always verify the latest short term rental regulations and Airbnb license requirements directly with local government authorities for Lenox to ensure full compliance before hosting.
(Source: AirROI data, 2026, finding no licensed listings among those analyzed)
Top Performing Airbnb Properties in Lenox (2026)
Benchmark your potential! Explore examples of top-performing Airbnb properties in Lenoxbased on Trailing Twelve Month (TTM) revenue. Analyze their characteristics, revenue, occupancy rate, and ADR to understand what drives success in this market.
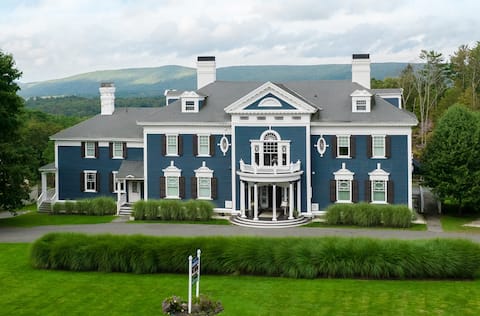
Built for a US Secretary of State 13K SF in Lenox
Entire Place • 13 bedrooms
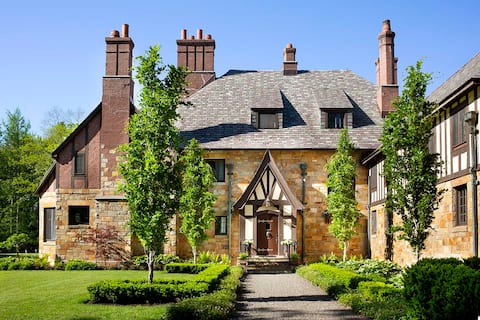
Winthrop Estate - 1925 Charm & Modern Luxury
Entire Place • 12 bedrooms
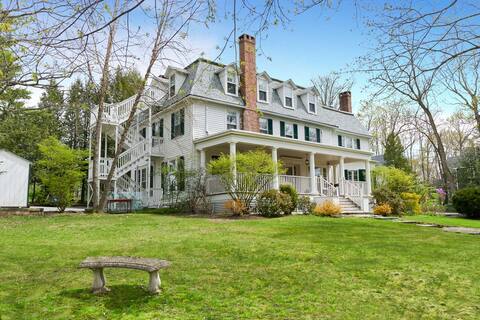
The Dewey Inn
Entire Place • 9 bedrooms
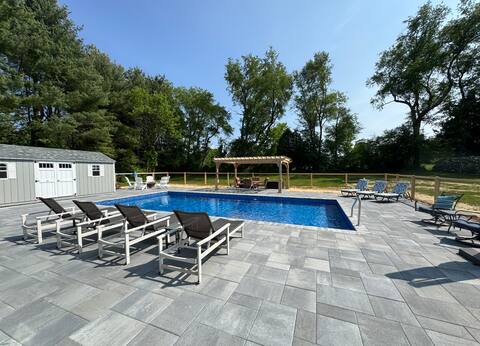
Lenox Grand Colonial with Pool by Evergreen Home
Entire Place • 4 bedrooms

The Aviary Hosted by Leo and Jacqueline
Entire Place • 4 bedrooms
The Penthouse, Downtown Lenox by Evergreen Home
Entire Place • 2 bedrooms
Note: Performance varies based on location, size, amenities, seasonality, and management quality. Data reflects the past 12 months.
Top Performing Airbnb Hosts in Lenox (2026)
Learn from the best! This table showcases top-performing Airbnb hosts in Lenox based on the number of properties managed and estimated total revenue over the past year. Analyze their scale and performance metrics.
| Host Name | Properties | Grossing Revenue | Stay Reviews | Avg Rating |
|---|---|---|---|---|
| Daniel | 1 | $497,401 | 41 | 4.98/5.0 |
| Jamie | 2 | $313,157 | 17 | 5.00/5.0 |
| Stanley Elkan | 12 | $252,287 | 47 | 4.97/5.0 |
| John | 6 | $233,346 | 365 | 4.94/5.0 |
| Evergreen Home | 4 | $232,597 | 178 | 4.95/5.0 |
| The Lenox | 8 | $194,085 | 95 | 4.60/5.0 |
| Lisa | 13 | $116,495 | 104 | 4.86/5.0 |
| Jared | 2 | $92,305 | 707 | 4.92/5.0 |
| Lucas | 2 | $89,813 | 30 | 4.42/5.0 |
| Michelle | 2 | $89,260 | 288 | 4.80/5.0 |
Analyzing the strategies of top hosts, such as their property selection, pricing, and guest communication, can offer valuable lessons for optimizing your own Airbnb operations in Lenox.
Dive Deeper: Advanced Lenox STR Market Data (2026)
Ready to unlock more insights? AirROI provides access to advanced metrics and comprehensive Airbnb data for Lenox. Explore detailed analytics beyond this report to refine your investment strategy, optimize pricing, and maximize your vacation rental profits.
Explore Advanced MetricsLenox Short-Term Rental Market Composition (2026): Property & Room Types
Room Type Distribution
Property Type Distribution
Market Composition Insights for Lenox
- The Lenox Airbnb market composition is heavily skewed towards Entire Home/Apt listings, which make up 62.8% of the 121 active rentals. This indicates strong guest preference for privacy and space.
- However, a notable 37.2% share for Private Rooms suggests opportunities for budget-conscious travelers or hosts renting out spare rooms.
- Looking at the property type distribution in Lenox, House properties are the most common (40.5%), reflecting the local real estate landscape.
- Houses represent a significant 40.5% portion, catering likely to families or larger groups.
- The presence of 36.4% Hotel/Boutique listings indicates integration with traditional hospitality.
- Smaller segments like others, outdoor/unique (combined 4.9%) offer potential for unique stay experiences.
Lenox Airbnb Room Capacity Analysis (2026): Bedroom Distribution
Distribution of Listings by Number of Bedrooms
Room Capacity Insights for Lenox
- The dominant room capacity in Lenox is 1 bedroom listings, making up 33.1% of the market. This suggests a strong demand for properties suitable for couples or solo travelers.
- Together, 1 bedroom and 2 bedrooms properties represent 53.8% of the active Airbnb listings in Lenox, indicating a high concentration in these sizes.
- A significant 33.0% of listings offer 3+ bedrooms, catering to larger groups and families seeking more space in Lenox.
Lenox Vacation Rental Guest Capacity Trends (2026)
Distribution of Listings by Guest Capacity
Guest Capacity Insights for Lenox
- The most common guest capacity trend in Lenox vacation rentals is listings accommodating 2 guests (25.6%). This suggests the primary traveler segment is likely couples or solo travelers.
- Properties designed for 2 guests and 4 guests dominate the Lenox STR market, accounting for 43.0% of listings.
- 33.8% of properties accommodate 6+ guests, serving the market segment for larger families or group travel in Lenox.
- On average, properties in Lenox are equipped to host 4.0 guests.
Lenox Airbnb Booking Patterns (2026): Available vs. Booked Days
Available Days Distribution
Booked Days Distribution
Booking Pattern Insights for Lenox
- The most common availability pattern in Lenox falls within the 271-366 days range, representing 63.6% of listings. This suggests many properties have significant open periods on their calendars.
- Approximately 91.7% of listings show high availability (181+ days open annually), indicating potential for increased bookings or specific owner usage patterns.
- For booked days, the 31-90 days range is most frequent in Lenox (42.1%), reflecting common guest stay durations or potential owner blocking patterns.
- A notable 10.0% of properties secure long booking periods (181+ days booked per year), highlighting successful long-term rental strategies or significant owner usage.
Lenox Airbnb Minimum Stay Requirements Analysis
Distribution of Listings by Minimum Night Requirement
1 Night
40 listings
33.1% of total
2 Nights
32 listings
26.4% of total
3 Nights
14 listings
11.6% of total
4-6 Nights
4 listings
3.3% of total
7-29 Nights
6 listings
5% of total
30+ Nights
25 listings
20.7% of total
Key Insights
- The most prevalent minimum stay requirement in Lenox is 1 Night, adopted by 33.1% of listings. This highlights the market's preference for shorter, flexible bookings.
- A significant segment (20.7%) caters to monthly stays (30+ nights) in Lenox, pointing to opportunities in the extended-stay market.
Recommendations
- Align with the market by considering a 1 Night minimum stay, as 33.1% of Lenox hosts use this setting.
- Explore offering discounts for stays of 30+ nights to attract the 20.7% of the market seeking extended stays.
- Adjust minimum nights based on seasonality – potentially shorter during low season and longer during peak demand periods in Lenox.
Lenox Airbnb Cancellation Policy Trends Analysis (2026)
Non-refundable
3 listings
2.5% of total
Limited
1 listings
0.8% of total
Refundable
4 listings
3.3% of total
Super Strict 60 Days
3 listings
2.5% of total
Flexible
15 listings
12.4% of total
Moderate
25 listings
20.7% of total
Firm
60 listings
49.6% of total
Strict
10 listings
8.3% of total
Cancellation Policy Insights for Lenox
- The prevailing Airbnb cancellation policy trend in Lenox is Firm, used by 49.6% of listings.
- A majority (57.9%) of hosts in Lenox utilize Firm or Strict policies, indicating a market where hosts prioritize booking security.
- Strict cancellation policies are quite rare (8.3%), potentially making listings with this policy less competitive unless justified by high demand or property type.
Recommendations for Hosts
- Consider adopting a Firm policy to align with the 49.6% market standard in Lenox.
- Using a Strict policy might deter some guests, as only 8.3% of listings use it. Evaluate if potential revenue protection outweighs possible lower booking rates.
- Regularly review your cancellation policy against competitors and market demand shifts in Lenox.
Lenox STR Booking Lead Time Analysis (2026)
Average Booking Lead Time by Month
Booking Lead Time Insights for Lenox
- The overall average booking lead time for vacation rentals in Lenox is 76 days.
- Guests book furthest in advance for stays during September (average 103 days), likely coinciding with peak travel demand or local events.
- The shortest booking windows occur for stays in January (average 34 days), indicating more last-minute travel plans during this time.
- Seasonally, Summer (89 days avg.) sees the longest lead times, while Winter (43 days avg.) has the shortest, reflecting typical travel planning cycles.
Recommendations for Hosts
- Use the overall average lead time (76 days) as a baseline for your pricing and availability strategy in Lenox.
- For September stays, consider implementing length-of-stay discounts or slightly higher rates for bookings made less than 103 days out to capitalize on advance planning.
- Target marketing efforts for the Summer season well in advance (at least 89 days) to capture early planners.
- Monitor your own booking lead times against these Lenox averages to identify opportunities for dynamic pricing adjustments.
Popular & Essential Airbnb Amenities in Lenox (2026)
Amenity Prevalence
Amenity Insights for Lenox
- Essential amenities in Lenox that guests expect include: Smoke alarm, Wifi, Carbon monoxide alarm, Free parking on premises, Heating. Lacking these (any) could significantly impact bookings.
- Popular amenities like Air conditioning, Hot water, TV are common but not universal. Offering these can provide a competitive edge.
Recommendations for Hosts
- Ensure your listing includes all essential amenities for Lenox: Smoke alarm, Wifi, Carbon monoxide alarm, Free parking on premises, Heating.
- Prioritize adding missing essentials: Smoke alarm, Wifi, Carbon monoxide alarm, Free parking on premises, Heating.
- Consider adding popular differentiators like Air conditioning or Hot water to increase appeal.
- Highlight unique or less common amenities you offer (e.g., hot tub, dedicated workspace, EV charger) in your listing description and photos.
- Regularly check competitor amenities in Lenox to stay competitive.
Lenox Airbnb Guest Demographics & Profile Analysis (2026)
Guest Profile Summary for Lenox
- The typical guest profile for Airbnb in Lenox consists of primarily domestic travelers (93%), often arriving from nearby New York, typically belonging to the Post-2000s (Gen Z/Alpha) group (50%), primarily speaking English or Spanish.
- Domestic travelers account for 93.4% of guests.
- Key international markets include United States (93.4%) and DC (1.9%).
- Top languages spoken are English (61.4%) followed by Spanish (11.3%).
- A significant demographic segment is the Post-2000s (Gen Z/Alpha) group, representing 50% of guests.
Recommendations for Hosts
- Target domestic marketing efforts towards travelers from New York and Boston.
- Tailor amenities and listing descriptions to appeal to the dominant Post-2000s (Gen Z/Alpha) demographic (e.g., highlight fast WiFi, smart home features, local guides).
- Highlight unique local experiences or amenities relevant to the primary guest profile.
- Consider seasonal promotions aligned with peak travel times for key origin markets.
Nearby Short-Term Rental Market Comparison
How does the Lenox Airbnb market stack up against its neighbors? Compare key performance metrics like average monthly revenue, ADR, and occupancy rates in surrounding areas to understand the broader regional STR landscape.
| Market | Active Properties | Monthly Revenue | Daily Rate | Avg. Occupancy |
|---|---|---|---|---|
| Middletown Springs | 13 | $6,843 | $507.55 | 32% |
| Pomfret | 15 | $6,549 | $502.74 | 45% |
| Town of Kingston | 10 | $6,470 | $473.76 | 49% |
| Frankford Township | 11 | $6,329 | $505.19 | 41% |
| Fort Ann | 35 | $6,238 | $790.41 | 37% |
| Town of East Hampton | 1,327 | $5,945 | $986.02 | 36% |
| Hanover | 33 | $5,826 | $1189.51 | 41% |
| Town of Monroe | 22 | $5,690 | $720.52 | 37% |
| Town of Ancram | 22 | $5,616 | $512.55 | 38% |
| Town of Schodack | 11 | $5,158 | $555.89 | 29% |