Lee Airbnb Market Analysis 2026: Short Term Rental Data & Vacation Rental Statistics in Massachusetts, United States
Is Airbnb profitable in Lee in 2026? Explore comprehensive Airbnb analytics for Lee, Massachusetts, United States to uncover income potential. This 2026 STR market report for Lee, based on AirROI data from February 2025 to January 2026, reveals key trends in the niche market of 94 active listings.
Whether you're considering an Airbnb investment in Lee, optimizing your existing vacation rental, or exploring rental arbitrage opportunities, understanding the Lee Airbnb data is crucial. Leveraging the low regulation environment is key to maximizing your short term rental income potential. Let's dive into the specifics.
Key Lee Airbnb Performance Metrics Overview
Monthly Airbnb Revenue Variations & Income Potential in Lee (2026)
Understanding the monthly revenue variations for Airbnb listings in Lee is key to maximizing your short term rental income potential. Seasonality significantly impacts earnings. Our analysis, based on data from the past 12 months, shows that the peak revenue month for STRs in Lee is typically July, while March often presents the lowest earnings, highlighting opportunities for strategic pricing adjustments during shoulder and low seasons. Explore the typical Airbnb income in Lee across different performance tiers:
- Best-in-class properties (Top 10%) achieve $7,249+ monthly, often utilizing dynamic pricing and superior guest experiences.
- Strong performing properties (Top 25%) earn $4,814 or more, indicating effective management and desirable locations/amenities.
- Typical properties (Median) generate around $2,561 per month, representing the average market performance.
- Entry-level properties (Bottom 25%) see earnings around $1,122, often with potential for optimization.
Average Monthly Airbnb Earnings Trend in Lee
Lee Airbnb Occupancy Rate Trends (2026)
Maximize your bookings by understanding the Lee STR occupancy trends. Seasonal demand shifts significantly influence how often properties are booked. Typically, Augustsees the highest demand (peak season occupancy), while March experiences the lowest (low season). Effective strategies, like adjusting minimum stays or offering promotions, can boost occupancy during slower periods. Here's how different property tiers perform in Lee:
- Best-in-class properties (Top 10%) achieve 71%+ occupancy, indicating high desirability and potentially optimized availability.
- Strong performing properties (Top 25%) maintain 52% or higher occupancy, suggesting good market fit and guest satisfaction.
- Typical properties (Median) have an occupancy rate around 31%.
- Entry-level properties (Bottom 25%) average 15% occupancy, potentially facing higher vacancy.
Average Monthly Occupancy Rate Trend in Lee
Average Daily Rate (ADR) Airbnb Trends in Lee (2026)
Effective short term rental pricing strategy in Lee involves understanding monthly ADR fluctuations. The Average Daily Rate (ADR) for Airbnb in Lee typically peaks in July and dips lowest during April. Leveraging Airbnb dynamic pricing tools or strategies based on this seasonality can significantly boost revenue. Here's a look at the typical nightly rates achieved:
- Best-in-class properties (Top 10%) command rates of $558+ per night, often due to premium features or locations.
- Strong performing properties (Top 25%) achieve nightly rates of $366 or more.
- Typical properties (Median) charge around $251 per night.
- Entry-level properties (Bottom 25%) earn around $170 per night.
Average Daily Rate (ADR) Trend by Month in Lee
Get Live Lee Market Intelligence 👇

Explore Real-time Analytics
Airbnb Seasonality Analysis & Trends in Lee (2026)
Peak Season (July, August, October)
- Revenue averages $5,260 per month
- Occupancy rates average 49.4%
- Daily rates average $315
Shoulder Season
- Revenue averages $2,893 per month
- Occupancy maintains around 32.4%
- Daily rates hold near $292
Low Season (March, May, September)
- Revenue drops to average $2,548 per month
- Occupancy decreases to average 27.7%
- Daily rates adjust to average $290
Seasonality Insights for Lee
- The Airbnb seasonality in Lee shows highly seasonal trends requiring careful strategy. While the sections above show seasonal averages, it's also insightful to look at the extremes:
- During the high season, the absolute peak month showcases Lee's highest earning potential, with monthly revenues capable of climbing to $6,172, occupancy reaching a high of 56.5%, and ADRs peaking at $325.
- Conversely, the slowest single month of the year, typically falling within the low season, marks the market's lowest point. In this month, revenue might dip to $2,535, occupancy could drop to 26.6%, and ADRs may adjust down to $282.
- Understanding both the seasonal averages and these monthly peaks and troughs in revenue, occupancy, and ADR is crucial for maximizing your Airbnb profit potential in Lee.
Seasonal Strategies for Maximizing Profit
- Peak Season: Maximize revenue through premium pricing and potentially longer minimum stays. Ensure high availability.
- Low Season: Offer competitive pricing, special promotions (e.g., extended stay discounts), and flexible cancellation policies. Target off-season travelers like remote workers or budget-conscious guests.
- Shoulder Seasons: Implement dynamic pricing that balances peak and low rates. Target weekend travelers or specific events. Offer slightly more flexible terms than peak season.
- Regularly analyze your own performance against these Lee seasonality benchmarks and adjust your pricing and availability strategy accordingly.
Best Areas for Airbnb Investment in Lee (2026)
Exploring the top neighborhoods for short-term rentals in Lee? This section highlights key areas, outlining why they are attractive for hosts and guests, along with notable local attractions. Consider these locations based on your target guest profile and investment strategy.
| Neighborhood / Area | Why Host Here? (Target Guests & Appeal) | Key Attractions & Landmarks |
|---|---|---|
| Bousquet Mountain | A popular ski destination in the Berkshires offering outdoor activities year-round. Ideal for travelers seeking winter sports or summer hiking. | Bousquet Ski Area, Housatonic River, Pittsfield State Forest, Broadway Park, Pinecone Grove |
| Lee Premium Outlets | A shopping haven featuring a variety of brand-name outlets. Attracts bargain hunters and families looking for a weekend getaway. | Lee Premium Outlets, The Greene Room, Naumkeag, Tanglewood, Berkshire Botanical Garden |
| Canoe Meadows Wildlife Sanctuary | A beautiful nature preserve perfect for hiking, bird watching, and enjoying the outdoors. Great for those looking for tranquility and nature. | Canoe Meadows Wildlife Sanctuary, Housatonic River, October Mountain State Forest, Berkshire Museum, Wahconah Falls State Park |
| Silver Lake | A serene lake area ideal for fishing, kayaking, and swimming in the summer. Attracts families and nature enthusiasts. | Silver Lake, Lake Buel, Lee State Forest, Jacobs Pillow, Berkshire Theatre Festival |
| Lenox Village | Charming New England village known for its cultural heritage and proximity to Tanglewood. Excellent for those interested in arts and culture. | Tanglewood, The Mount, Lenox Library, Shakespeare & Company, Canoe Meadows Wildlife Sanctuary |
| Berkshire Scenic Railway | An attraction that offers historical train rides through the picturesque Berkshires, appealing to families and railroad enthusiasts. | Berkshire Scenic Railway, The Stockbridge-Munsee Community, Classical Music at Tanglewood, Berkshire Museum, Norman Rockwell Museum |
| Pittsfield | The largest city in Berkshire County with vibrant downtown and cultural sites. Offers a mix of urban amenities and scenic nature close by. | Berkshire Museum, Wahconah Park, The Colonial Theatre, Berkshire Athenaeum, Pittsfield State Forest |
| Stockbridge | A historic town known for its art galleries and the influence of Norman Rockwell. Attracts art lovers and history buffs. | Norman Rockwell Museum, Gloversville Museum, Stockbridge Bowl, Dinosaur Trackways, Mission House |
Understanding Airbnb License Requirements & STR Laws in Lee (2026)
While Lee, Massachusetts, United States currently shows low STR regulations, specific Airbnb license requirements might still exist or change. Always verify the latest short term rental regulations and Airbnb license requirements directly with local government authorities for Lee to ensure full compliance before hosting.
(Source: AirROI data, 2026, based on 3% licensed listings)
Top Performing Airbnb Properties in Lee (2026)
Benchmark your potential! Explore examples of top-performing Airbnb properties in Leebased on Trailing Twelve Month (TTM) revenue. Analyze their characteristics, revenue, occupancy rate, and ADR to understand what drives success in this market.
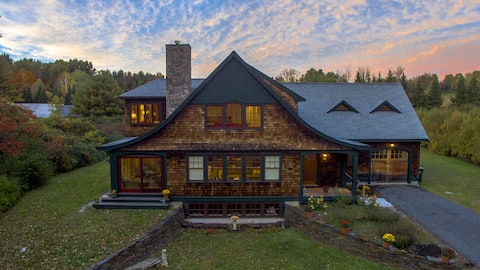
Lovely Berkshire Home
Entire Place • 4 bedrooms

Lakeview Retreat, Mins. to Lenox, Stockbridge, Lee
Entire Place • 3 bedrooms

Berkshire Mountain retreat with Urban eco-luxuries
Entire Place • 3 bedrooms

Stonebridge Cabin: Modern Amenities, Enjoy Nature!
Entire Place • 4 bedrooms

Stylish Mid-century Modern Berkshires Cape
Entire Place • 4 bedrooms
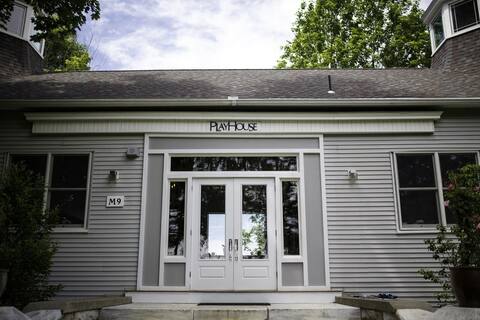
The Playhouse: 7k Sf Berkshires
Entire Place • 6 bedrooms
Note: Performance varies based on location, size, amenities, seasonality, and management quality. Data reflects the past 12 months.
Top Performing Airbnb Hosts in Lee (2026)
Learn from the best! This table showcases top-performing Airbnb hosts in Lee based on the number of properties managed and estimated total revenue over the past year. Analyze their scale and performance metrics.
| Host Name | Properties | Grossing Revenue | Stay Reviews | Avg Rating |
|---|---|---|---|---|
| Teva | 2 | $162,426 | 160 | 4.91/5.0 |
| Joshua | 3 | $139,432 | 850 | 4.96/5.0 |
| Abigail | 4 | $117,627 | 220 | 4.87/5.0 |
| Rod | 6 | $115,011 | 60 | 4.88/5.0 |
| Howard | 2 | $105,787 | 192 | 4.69/5.0 |
| Kari | 1 | $100,731 | 17 | 5.00/5.0 |
| McCaela | 1 | $96,515 | 306 | 4.99/5.0 |
| Lucas | 1 | $95,156 | 93 | 4.86/5.0 |
| Christopher | 1 | $83,352 | 122 | 4.97/5.0 |
| Luk Stays | 4 | $83,208 | 51 | 4.86/5.0 |
Analyzing the strategies of top hosts, such as their property selection, pricing, and guest communication, can offer valuable lessons for optimizing your own Airbnb operations in Lee.
Dive Deeper: Advanced Lee STR Market Data (2026)
Ready to unlock more insights? AirROI provides access to advanced metrics and comprehensive Airbnb data for Lee. Explore detailed analytics beyond this report to refine your investment strategy, optimize pricing, and maximize your vacation rental profits.
Explore Advanced MetricsLee Short-Term Rental Market Composition (2026): Property & Room Types
Room Type Distribution
Property Type Distribution
Market Composition Insights for Lee
- The Lee Airbnb market composition is heavily skewed towards Entire Home/Apt listings, which make up 84% of the 94 active rentals. This indicates strong guest preference for privacy and space.
- Looking at the property type distribution in Lee, House properties are the most common (52.1%), reflecting the local real estate landscape.
- Houses represent a significant 52.1% portion, catering likely to families or larger groups.
- The presence of 12.8% Hotel/Boutique listings indicates integration with traditional hospitality.
- Smaller segments like others, outdoor/unique, unique stays (combined 8.5%) offer potential for unique stay experiences.
Lee Airbnb Room Capacity Analysis (2026): Bedroom Distribution
Distribution of Listings by Number of Bedrooms
Room Capacity Insights for Lee
- The dominant room capacity in Lee is 2 bedrooms listings, making up 36.2% of the market. This suggests a strong demand for properties suitable for couples or solo travelers.
- Together, 2 bedrooms and 3 bedrooms properties represent 54.3% of the active Airbnb listings in Lee, indicating a high concentration in these sizes.
- A significant 40.4% of listings offer 3+ bedrooms, catering to larger groups and families seeking more space in Lee.
Lee Vacation Rental Guest Capacity Trends (2026)
Distribution of Listings by Guest Capacity
Guest Capacity Insights for Lee
- The most common guest capacity trend in Lee vacation rentals is listings accommodating 6 guests (34%). This suggests the primary traveler segment is likely larger groups.
- Properties designed for 6 guests and 8+ guests dominate the Lee STR market, accounting for 59.5% of listings.
- 62.7% of properties accommodate 6+ guests, serving the market segment for larger families or group travel in Lee.
- On average, properties in Lee are equipped to host 5.3 guests.
Lee Airbnb Booking Patterns (2026): Available vs. Booked Days
Available Days Distribution
Booked Days Distribution
Booking Pattern Insights for Lee
- The most common availability pattern in Lee falls within the 271-366 days range, representing 54.3% of listings. This suggests many properties have significant open periods on their calendars.
- Approximately 89.4% of listings show high availability (181+ days open annually), indicating potential for increased bookings or specific owner usage patterns.
- For booked days, the 31-90 days range is most frequent in Lee (38.3%), reflecting common guest stay durations or potential owner blocking patterns.
- A notable 10.7% of properties secure long booking periods (181+ days booked per year), highlighting successful long-term rental strategies or significant owner usage.
Lee Airbnb Minimum Stay Requirements Analysis
Distribution of Listings by Minimum Night Requirement
1 Night
8 listings
8.5% of total
2 Nights
34 listings
36.2% of total
3 Nights
5 listings
5.3% of total
4-6 Nights
4 listings
4.3% of total
7-29 Nights
1 listings
1.1% of total
30+ Nights
42 listings
44.7% of total
Key Insights
- The most prevalent minimum stay requirement in Lee is 30+ Nights, adopted by 44.7% of listings. This highlights the market's preference for longer commitments.
- A significant segment (44.7%) caters to monthly stays (30+ nights) in Lee, pointing to opportunities in the extended-stay market.
Recommendations
- Align with the market by considering a 30+ Nights minimum stay, as 44.7% of Lee hosts use this setting.
- If feasible, allowing 1-night stays, especially midweek or during low season, could capture last-minute bookings, as only 8.5% currently do.
- A 2-night minimum appears standard (36.2%). Consider this for weekends or peak periods.
- Explore offering discounts for stays of 30+ nights to attract the 44.7% of the market seeking extended stays.
- Adjust minimum nights based on seasonality – potentially shorter during low season and longer during peak demand periods in Lee.
Lee Airbnb Cancellation Policy Trends Analysis (2026)
Super Strict 60 Days
2 listings
2.2% of total
Limited
2 listings
2.2% of total
Flexible
8 listings
8.7% of total
Moderate
19 listings
20.7% of total
Firm
34 listings
37% of total
Strict
27 listings
29.3% of total
Cancellation Policy Insights for Lee
- The prevailing Airbnb cancellation policy trend in Lee is Firm, used by 37% of listings.
- A majority (66.3%) of hosts in Lee utilize Firm or Strict policies, indicating a market where hosts prioritize booking security.
Recommendations for Hosts
- Consider adopting a Firm policy to align with the 37% market standard in Lee.
- Regularly review your cancellation policy against competitors and market demand shifts in Lee.
Lee STR Booking Lead Time Analysis (2026)
Average Booking Lead Time by Month
Booking Lead Time Insights for Lee
- The overall average booking lead time for vacation rentals in Lee is 59 days.
- Guests book furthest in advance for stays during July (average 103 days), likely coinciding with peak travel demand or local events.
- The shortest booking windows occur for stays in March (average 23 days), indicating more last-minute travel plans during this time.
- Seasonally, Summer (85 days avg.) sees the longest lead times, while Spring (34 days avg.) has the shortest, reflecting typical travel planning cycles.
Recommendations for Hosts
- Use the overall average lead time (59 days) as a baseline for your pricing and availability strategy in Lee.
- For July stays, consider implementing length-of-stay discounts or slightly higher rates for bookings made less than 103 days out to capitalize on advance planning.
- Target marketing efforts for the Summer season well in advance (at least 85 days) to capture early planners.
- Monitor your own booking lead times against these Lee averages to identify opportunities for dynamic pricing adjustments.
Popular & Essential Airbnb Amenities in Lee (2026)
Amenity Prevalence
Amenity Insights for Lee
- Essential amenities in Lee that guests expect include: Smoke alarm, Wifi, Free parking on premises. Lacking these (any) could significantly impact bookings.
- Popular amenities like Heating, Air conditioning, TV are common but not universal. Offering these can provide a competitive edge.
Recommendations for Hosts
- Ensure your listing includes all essential amenities for Lee: Smoke alarm, Wifi, Free parking on premises.
- Prioritize adding missing essentials: Free parking on premises.
- Consider adding popular differentiators like Heating or Air conditioning to increase appeal.
- Highlight unique or less common amenities you offer (e.g., hot tub, dedicated workspace, EV charger) in your listing description and photos.
- Regularly check competitor amenities in Lee to stay competitive.
Lee Airbnb Guest Demographics & Profile Analysis (2026)
Guest Profile Summary for Lee
- The typical guest profile for Airbnb in Lee consists of primarily domestic travelers (97%), often arriving from nearby New York, typically belonging to the Post-2000s (Gen Z/Alpha) group (50%), primarily speaking English or Spanish.
- Domestic travelers account for 96.6% of guests.
- Key international markets include United States (96.6%) and DC (0.8%).
- Top languages spoken are English (66.7%) followed by Spanish (10.4%).
- A significant demographic segment is the Post-2000s (Gen Z/Alpha) group, representing 50% of guests.
Recommendations for Hosts
- Target domestic marketing efforts towards travelers from New York and Boston.
- Tailor amenities and listing descriptions to appeal to the dominant Post-2000s (Gen Z/Alpha) demographic (e.g., highlight fast WiFi, smart home features, local guides).
- Highlight unique local experiences or amenities relevant to the primary guest profile.
- Consider seasonal promotions aligned with peak travel times for key origin markets.
Nearby Short-Term Rental Market Comparison
How does the Lee Airbnb market stack up against its neighbors? Compare key performance metrics like average monthly revenue, ADR, and occupancy rates in surrounding areas to understand the broader regional STR landscape.
| Market | Active Properties | Monthly Revenue | Daily Rate | Avg. Occupancy |
|---|---|---|---|---|
| Middletown Springs | 13 | $6,843 | $507.55 | 32% |
| Pomfret | 15 | $6,549 | $502.74 | 45% |
| Town of Kingston | 10 | $6,470 | $473.76 | 49% |
| Frankford Township | 11 | $6,329 | $505.19 | 41% |
| Fort Ann | 35 | $6,238 | $790.41 | 37% |
| Town of East Hampton | 1,327 | $5,945 | $986.02 | 36% |
| Hanover | 33 | $5,826 | $1189.51 | 41% |
| Town of Monroe | 22 | $5,690 | $720.52 | 37% |
| Town of Ancram | 22 | $5,616 | $512.55 | 38% |
| Town of Schodack | 11 | $5,158 | $555.89 | 29% |