Holyoke Airbnb Market Analysis 2026: Short Term Rental Data & Vacation Rental Statistics in Massachusetts, United States
Is Airbnb profitable in Holyoke in 2026? Explore comprehensive Airbnb analytics for Holyoke, Massachusetts, United States to uncover income potential. This 2026 STR market report for Holyoke, based on AirROI data from February 2025 to January 2026, reveals key trends in the niche market of 32 active listings.
Whether you're considering an Airbnb investment in Holyoke, optimizing your existing vacation rental, or exploring rental arbitrage opportunities, understanding the Holyoke Airbnb data is crucial. Leveraging the low regulation environment is key to maximizing your short term rental income potential. Let's dive into the specifics.
Key Holyoke Airbnb Performance Metrics Overview
Monthly Airbnb Revenue Variations & Income Potential in Holyoke (2026)
Understanding the monthly revenue variations for Airbnb listings in Holyoke is key to maximizing your short term rental income potential. Seasonality significantly impacts earnings. Our analysis, based on data from the past 12 months, shows that the peak revenue month for STRs in Holyoke is typically December, while January often presents the lowest earnings, highlighting opportunities for strategic pricing adjustments during shoulder and low seasons. Explore the typical Airbnb income in Holyoke across different performance tiers:
- Best-in-class properties (Top 10%) achieve $5,658+ monthly, often utilizing dynamic pricing and superior guest experiences.
- Strong performing properties (Top 25%) earn $2,813 or more, indicating effective management and desirable locations/amenities.
- Typical properties (Median) generate around $1,708 per month, representing the average market performance.
- Entry-level properties (Bottom 25%) see earnings around $836, often with potential for optimization.
Average Monthly Airbnb Earnings Trend in Holyoke
Holyoke Airbnb Occupancy Rate Trends (2026)
Maximize your bookings by understanding the Holyoke STR occupancy trends. Seasonal demand shifts significantly influence how often properties are booked. Typically, Septembersees the highest demand (peak season occupancy), while January experiences the lowest (low season). Effective strategies, like adjusting minimum stays or offering promotions, can boost occupancy during slower periods. Here's how different property tiers perform in Holyoke:
- Best-in-class properties (Top 10%) achieve 79%+ occupancy, indicating high desirability and potentially optimized availability.
- Strong performing properties (Top 25%) maintain 65% or higher occupancy, suggesting good market fit and guest satisfaction.
- Typical properties (Median) have an occupancy rate around 45%.
- Entry-level properties (Bottom 25%) average 20% occupancy, potentially facing higher vacancy.
Average Monthly Occupancy Rate Trend in Holyoke
Average Daily Rate (ADR) Airbnb Trends in Holyoke (2026)
Effective short term rental pricing strategy in Holyoke involves understanding monthly ADR fluctuations. The Average Daily Rate (ADR) for Airbnb in Holyoke typically peaks in October and dips lowest during April. Leveraging Airbnb dynamic pricing tools or strategies based on this seasonality can significantly boost revenue. Here's a look at the typical nightly rates achieved:
- Best-in-class properties (Top 10%) command rates of $370+ per night, often due to premium features or locations.
- Strong performing properties (Top 25%) achieve nightly rates of $181 or more.
- Typical properties (Median) charge around $122 per night.
- Entry-level properties (Bottom 25%) earn around $85 per night.
Average Daily Rate (ADR) Trend by Month in Holyoke
Get Live Holyoke Market Intelligence 👇

Explore Real-time Analytics
Airbnb Seasonality Analysis & Trends in Holyoke (2026)
Peak Season (December, November, September)
- Revenue averages $3,286 per month
- Occupancy rates average 47.1%
- Daily rates average $205
Shoulder Season
- Revenue averages $2,730 per month
- Occupancy maintains around 44.1%
- Daily rates hold near $179
Low Season (January, April, July)
- Revenue drops to average $2,047 per month
- Occupancy decreases to average 42.4%
- Daily rates adjust to average $180
Seasonality Insights for Holyoke
- The Airbnb seasonality in Holyoke shows moderate seasonality with distinct peak and low periods. While the sections above show seasonal averages, it's also insightful to look at the extremes:
- During the high season, the absolute peak month showcases Holyoke's highest earning potential, with monthly revenues capable of climbing to $3,340, occupancy reaching a high of 51.8%, and ADRs peaking at $221.
- Conversely, the slowest single month of the year, typically falling within the low season, marks the market's lowest point. In this month, revenue might dip to $1,710, occupancy could drop to 27.1%, and ADRs may adjust down to $165.
- Understanding both the seasonal averages and these monthly peaks and troughs in revenue, occupancy, and ADR is crucial for maximizing your Airbnb profit potential in Holyoke.
Seasonal Strategies for Maximizing Profit
- Peak Season: Maximize revenue through premium pricing and potentially longer minimum stays. Ensure high availability.
- Low Season: Offer competitive pricing, special promotions (e.g., extended stay discounts), and flexible cancellation policies. Target off-season travelers like remote workers or budget-conscious guests.
- Shoulder Seasons: Implement dynamic pricing that balances peak and low rates. Target weekend travelers or specific events. Offer slightly more flexible terms than peak season.
- Regularly analyze your own performance against these Holyoke seasonality benchmarks and adjust your pricing and availability strategy accordingly.
Best Areas for Airbnb Investment in Holyoke (2026)
Exploring the top neighborhoods for short-term rentals in Holyoke? This section highlights key areas, outlining why they are attractive for hosts and guests, along with notable local attractions. Consider these locations based on your target guest profile and investment strategy.
| Neighborhood / Area | Why Host Here? (Target Guests & Appeal) | Key Attractions & Landmarks |
|---|---|---|
| Downtown Holyoke | The heart of Holyoke, featuring historic architecture and a growing arts scene. It's a central location with easy access to amenities and restaurants, making it appealing for visitors. | Holyoke Mall, Wistariahurst Museum, McCray's Farm, The Holyoke Heritage State Park, Mount Tom State Reservation |
| Holyoke Canal District | A revitalizing area along the canals, known for recreational activities and scenic views. Great for guests interested in outdoor activities and local history. | Canal Walk, Holyoke Merry Go Round, Hampden Row, The Volleyball Hall of Fame, Doughboy Monument |
| South Holyoke | A neighborhood that offers a glimpse into cultural diversity, with a mix of local restaurants and shops. Attractive for those seeking a more authentic local experience. | Pulaski Park, Bennett Park, Our Lady of Guadalupe Church, Local eateries and shops |
| El Pueblo | Known for its vibrant community and local festivities, attracting visitors looking for cultural experiences unique to Holyoke. | El Mercado, Annual Puerto Rican Parade, Local cultural events and festivals |
| North Holyoke | A quieter residential area that offers easy access to outdoor activities and parks. Ideal for families and those looking to relax away from the hustle and bustle. | Cunningham Park, Mount Tom State Reservation, Biking and hiking trails, Local farms |
| Holyoke Historic District | Rich in history and architecture, this area appeals to those interested in local history and culture, with unique historic homes and buildings. | Historic Holyoke Canal District, Holyoke Historic Fire Museum, The Soldiers' Monument, The Polish Fire Society |
| Whiting Peak | An area that offers great views and outdoor activities, popular among nature lovers and those looking for a retreat-style stay. | Mount Tom Forest, Hiking trails, Scenic viewpoints, Wildlife observation |
| West Holyoke | A quieter outer neighborhood with a suburban feel, appealing to families and longer-term renters looking for a peaceful environment. | Local parks, Shopping centers, Schools and community centers |
Understanding Airbnb License Requirements & STR Laws in Holyoke (2026)
While Holyoke, Massachusetts, United States currently shows low STR regulations, specific Airbnb license requirements might still exist or change. Always verify the latest short term rental regulations and Airbnb license requirements directly with local government authorities for Holyoke to ensure full compliance before hosting.
(Source: AirROI data, 2026, finding no licensed listings among those analyzed)
Top Performing Airbnb Properties in Holyoke (2026)
Benchmark your potential! Explore examples of top-performing Airbnb properties in Holyokebased on Trailing Twelve Month (TTM) revenue. Analyze their characteristics, revenue, occupancy rate, and ADR to understand what drives success in this market.
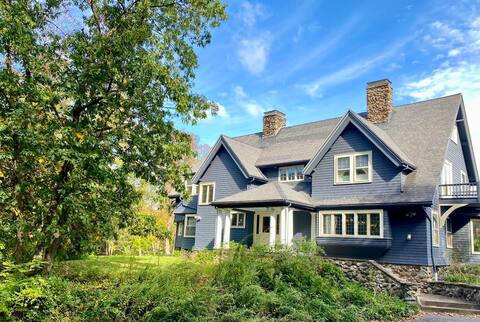
Historic Wyckoff House
Entire Place • 7 bedrooms
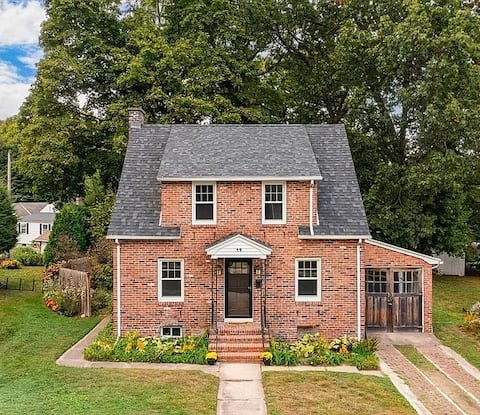
Quaint Cape Style Brick Home
Entire Place • 3 bedrooms
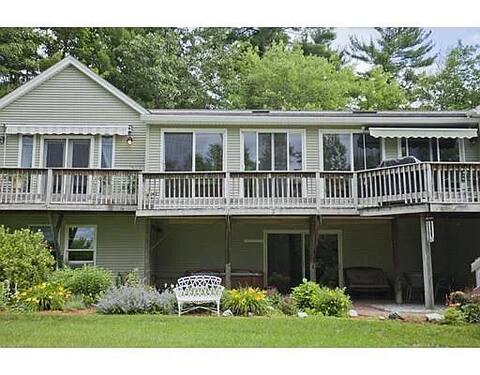
Beautiful, spacious 3 BR home in private setting.
Entire Place • 3 bedrooms
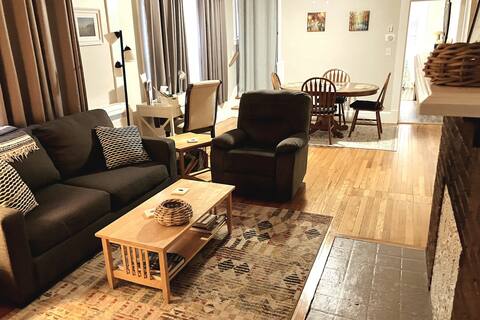
Heart of Western MA and Comforts of Home
Entire Place • 3 bedrooms
Boho Inspired Home in Holyoke
Entire Place • 2 bedrooms

Comfortable 3bdrm home with big backyard
Entire Place • 3 bedrooms
Note: Performance varies based on location, size, amenities, seasonality, and management quality. Data reflects the past 12 months.
Top Performing Airbnb Hosts in Holyoke (2026)
Learn from the best! This table showcases top-performing Airbnb hosts in Holyoke based on the number of properties managed and estimated total revenue over the past year. Analyze their scale and performance metrics.
| Host Name | Properties | Grossing Revenue | Stay Reviews | Avg Rating |
|---|---|---|---|---|
| Philip | 1 | $189,281 | 24 | 5.00/5.0 |
| Ryan | 2 | $68,737 | 213 | 4.83/5.0 |
| Dan | 3 | $57,015 | 148 | 4.96/5.0 |
| Tian Hui | 4 | $55,650 | 317 | 4.85/5.0 |
| Joseph | 2 | $54,859 | 443 | 4.97/5.0 |
| Nahndi | 3 | $53,520 | 47 | 4.40/5.0 |
| Elder | 1 | $44,268 | 40 | 4.83/5.0 |
| Mary | 1 | $36,631 | 109 | 4.98/5.0 |
| Yasha | 1 | $33,812 | 97 | 4.78/5.0 |
| April | 1 | $22,765 | 162 | 4.85/5.0 |
Analyzing the strategies of top hosts, such as their property selection, pricing, and guest communication, can offer valuable lessons for optimizing your own Airbnb operations in Holyoke.
Dive Deeper: Advanced Holyoke STR Market Data (2026)
Ready to unlock more insights? AirROI provides access to advanced metrics and comprehensive Airbnb data for Holyoke. Explore detailed analytics beyond this report to refine your investment strategy, optimize pricing, and maximize your vacation rental profits.
Explore Advanced MetricsHolyoke Short-Term Rental Market Composition (2026): Property & Room Types
Room Type Distribution
Property Type Distribution
Market Composition Insights for Holyoke
- The Holyoke Airbnb market composition is heavily skewed towards Entire Home/Apt listings, which make up 59.4% of the 32 active rentals. This indicates strong guest preference for privacy and space.
- However, a notable 40.6% share for Private Rooms suggests opportunities for budget-conscious travelers or hosts renting out spare rooms.
- Looking at the property type distribution in Holyoke, House properties are the most common (65.6%), reflecting the local real estate landscape.
- Houses represent a significant 65.6% portion, catering likely to families or larger groups.
Holyoke Airbnb Room Capacity Analysis (2026): Bedroom Distribution
Distribution of Listings by Number of Bedrooms
Room Capacity Insights for Holyoke
- The dominant room capacity in Holyoke is 3 bedrooms listings, making up 28.1% of the market. This suggests a strong demand for properties suitable for families or small groups.
- Together, 3 bedrooms and 2 bedrooms properties represent 46.9% of the active Airbnb listings in Holyoke, indicating a high concentration in these sizes.
- A significant 31.2% of listings offer 3+ bedrooms, catering to larger groups and families seeking more space in Holyoke.
Holyoke Vacation Rental Guest Capacity Trends (2026)
Distribution of Listings by Guest Capacity
Guest Capacity Insights for Holyoke
- The most common guest capacity trend in Holyoke vacation rentals is listings accommodating 6 guests (18.8%). This suggests the primary traveler segment is likely larger groups.
- Properties designed for 6 guests and 4 guests dominate the Holyoke STR market, accounting for 34.4% of listings.
- 21.9% of properties accommodate 6+ guests, serving the market segment for larger families or group travel in Holyoke.
- On average, properties in Holyoke are equipped to host 2.7 guests.
Holyoke Airbnb Booking Patterns (2026): Available vs. Booked Days
Available Days Distribution
Booked Days Distribution
Booking Pattern Insights for Holyoke
- The most common availability pattern in Holyoke falls within the 181-270 days range, representing 53.1% of listings. This suggests many properties have significant open periods on their calendars.
- Approximately 84.4% of listings show high availability (181+ days open annually), indicating potential for increased bookings or specific owner usage patterns.
- For booked days, the 91-180 days range is most frequent in Holyoke (56.3%), reflecting common guest stay durations or potential owner blocking patterns.
- A notable 15.6% of properties secure long booking periods (181+ days booked per year), highlighting successful long-term rental strategies or significant owner usage.
Holyoke Airbnb Minimum Stay Requirements Analysis
Distribution of Listings by Minimum Night Requirement
1 Night
7 listings
21.9% of total
2 Nights
9 listings
28.1% of total
4-6 Nights
3 listings
9.4% of total
7-29 Nights
2 listings
6.3% of total
30+ Nights
11 listings
34.4% of total
Key Insights
- The most prevalent minimum stay requirement in Holyoke is 30+ Nights, adopted by 34.4% of listings. This highlights the market's preference for longer commitments.
- A significant segment (34.4%) caters to monthly stays (30+ nights) in Holyoke, pointing to opportunities in the extended-stay market.
Recommendations
- Align with the market by considering a 30+ Nights minimum stay, as 34.4% of Holyoke hosts use this setting.
- If feasible, allowing 1-night stays, especially midweek or during low season, could capture last-minute bookings, as only 21.9% currently do.
- Explore offering discounts for stays of 30+ nights to attract the 34.4% of the market seeking extended stays.
- Adjust minimum nights based on seasonality – potentially shorter during low season and longer during peak demand periods in Holyoke.
Holyoke Airbnb Cancellation Policy Trends Analysis (2026)
Limited
1 listings
3.1% of total
Super Strict 30 Days
1 listings
3.1% of total
Flexible
9 listings
28.1% of total
Moderate
5 listings
15.6% of total
Firm
15 listings
46.9% of total
Strict
1 listings
3.1% of total
Cancellation Policy Insights for Holyoke
- The prevailing Airbnb cancellation policy trend in Holyoke is Firm, used by 46.9% of listings.
- There's a relatively balanced mix between guest-friendly (43.7%) and stricter (50.0%) policies, offering choices for different guest needs.
- Strict cancellation policies are quite rare (3.1%), potentially making listings with this policy less competitive unless justified by high demand or property type.
Recommendations for Hosts
- Consider adopting a Firm policy to align with the 46.9% market standard in Holyoke.
- Using a Strict policy might deter some guests, as only 3.1% of listings use it. Evaluate if potential revenue protection outweighs possible lower booking rates.
- Regularly review your cancellation policy against competitors and market demand shifts in Holyoke.
Holyoke STR Booking Lead Time Analysis (2026)
Average Booking Lead Time by Month
Booking Lead Time Insights for Holyoke
- The overall average booking lead time for vacation rentals in Holyoke is 38 days.
- Guests book furthest in advance for stays during May (average 90 days), likely coinciding with peak travel demand or local events.
- The shortest booking windows occur for stays in March (average 11 days), indicating more last-minute travel plans during this time.
- Seasonally, Spring (41 days avg.) sees the longest lead times, while Winter (21 days avg.) has the shortest, reflecting typical travel planning cycles.
Recommendations for Hosts
- Use the overall average lead time (38 days) as a baseline for your pricing and availability strategy in Holyoke.
- For May stays, consider implementing length-of-stay discounts or slightly higher rates for bookings made less than 90 days out to capitalize on advance planning.
- During March, focus on last-minute booking availability and promotions, as guests book with very short notice (11 days avg.).
- Target marketing efforts for the Spring season well in advance (at least 41 days) to capture early planners.
- Monitor your own booking lead times against these Holyoke averages to identify opportunities for dynamic pricing adjustments.
Popular & Essential Airbnb Amenities in Holyoke (2026)
Amenity Prevalence
Amenity Insights for Holyoke
- Essential amenities in Holyoke that guests expect include: Wifi, Smoke alarm. Lacking these (any) could significantly impact bookings.
- Popular amenities like Carbon monoxide alarm, TV, Heating are common but not universal. Offering these can provide a competitive edge.
Recommendations for Hosts
- Ensure your listing includes all essential amenities for Holyoke: Wifi, Smoke alarm.
- Prioritize adding missing essentials: Smoke alarm.
- Consider adding popular differentiators like Carbon monoxide alarm or TV to increase appeal.
- Highlight unique or less common amenities you offer (e.g., hot tub, dedicated workspace, EV charger) in your listing description and photos.
- Regularly check competitor amenities in Holyoke to stay competitive.
Holyoke Airbnb Guest Demographics & Profile Analysis (2026)
Guest Profile Summary for Holyoke
- The typical guest profile for Airbnb in Holyoke consists of primarily domestic travelers (95%), often arriving from nearby New York, typically belonging to the Post-2000s (Gen Z/Alpha) group (50%), primarily speaking English or Spanish.
- Domestic travelers account for 94.5% of guests.
- Key international markets include United States (94.5%) and Mexico (1.3%).
- Top languages spoken are English (64.8%) followed by Spanish (16%).
- A significant demographic segment is the Post-2000s (Gen Z/Alpha) group, representing 50% of guests.
Recommendations for Hosts
- Target domestic marketing efforts towards travelers from New York and Boston.
- Tailor amenities and listing descriptions to appeal to the dominant Post-2000s (Gen Z/Alpha) demographic (e.g., highlight fast WiFi, smart home features, local guides).
- Highlight unique local experiences or amenities relevant to the primary guest profile.
- Consider seasonal promotions aligned with peak travel times for key origin markets.
Nearby Short-Term Rental Market Comparison
How does the Holyoke Airbnb market stack up against its neighbors? Compare key performance metrics like average monthly revenue, ADR, and occupancy rates in surrounding areas to understand the broader regional STR landscape.
| Market | Active Properties | Monthly Revenue | Daily Rate | Avg. Occupancy |
|---|---|---|---|---|
| Middletown Springs | 13 | $6,843 | $507.55 | 32% |
| Pomfret | 15 | $6,549 | $502.74 | 45% |
| Fort Ann | 35 | $6,238 | $790.41 | 37% |
| Town of East Hampton | 1,327 | $5,945 | $986.02 | 36% |
| Hanover | 33 | $5,826 | $1189.51 | 41% |
| Middletown | 395 | $5,781 | $589.01 | 45% |
| North Andover | 12 | $5,625 | $440.84 | 45% |
| Town of Ancram | 22 | $5,616 | $512.55 | 38% |
| New Shoreham | 120 | $5,359 | $637.79 | 45% |
| Wellesley | 22 | $5,310 | $520.90 | 50% |