Harwich Airbnb Market Analysis 2026: Short Term Rental Data & Vacation Rental Statistics in Massachusetts, United States
Is Airbnb profitable in Harwich in 2026? Explore comprehensive Airbnb analytics for Harwich, Massachusetts, United States to uncover income potential. This 2026 STR market report for Harwich, based on AirROI data from February 2025 to January 2026, reveals key trends in the market of 319 active listings.
Whether you're considering an Airbnb investment in Harwich, optimizing your existing vacation rental, or exploring rental arbitrage opportunities, understanding the Harwich Airbnb data is crucial. Leveraging the low regulation environment is key to maximizing your short term rental income potential. Let's dive into the specifics.
Key Harwich Airbnb Performance Metrics Overview
Monthly Airbnb Revenue Variations & Income Potential in Harwich (2026)
Understanding the monthly revenue variations for Airbnb listings in Harwich is key to maximizing your short term rental income potential. Seasonality significantly impacts earnings. Our analysis, based on data from the past 12 months, shows that the peak revenue month for STRs in Harwich is typically July, while February often presents the lowest earnings, highlighting opportunities for strategic pricing adjustments during shoulder and low seasons. Explore the typical Airbnb income in Harwich across different performance tiers:
- Best-in-class properties (Top 10%) achieve $11,446+ monthly, often utilizing dynamic pricing and superior guest experiences.
- Strong performing properties (Top 25%) earn $7,000 or more, indicating effective management and desirable locations/amenities.
- Typical properties (Median) generate around $4,216 per month, representing the average market performance.
- Entry-level properties (Bottom 25%) see earnings around $2,106, often with potential for optimization.
Average Monthly Airbnb Earnings Trend in Harwich
Harwich Airbnb Occupancy Rate Trends (2026)
Maximize your bookings by understanding the Harwich STR occupancy trends. Seasonal demand shifts significantly influence how often properties are booked. Typically, Augustsees the highest demand (peak season occupancy), while February experiences the lowest (low season). Effective strategies, like adjusting minimum stays or offering promotions, can boost occupancy during slower periods. Here's how different property tiers perform in Harwich:
- Best-in-class properties (Top 10%) achieve 69%+ occupancy, indicating high desirability and potentially optimized availability.
- Strong performing properties (Top 25%) maintain 51% or higher occupancy, suggesting good market fit and guest satisfaction.
- Typical properties (Median) have an occupancy rate around 34%.
- Entry-level properties (Bottom 25%) average 18% occupancy, potentially facing higher vacancy.
Average Monthly Occupancy Rate Trend in Harwich
Average Daily Rate (ADR) Airbnb Trends in Harwich (2026)
Effective short term rental pricing strategy in Harwich involves understanding monthly ADR fluctuations. The Average Daily Rate (ADR) for Airbnb in Harwich typically peaks in July and dips lowest during March. Leveraging Airbnb dynamic pricing tools or strategies based on this seasonality can significantly boost revenue. Here's a look at the typical nightly rates achieved:
- Best-in-class properties (Top 10%) command rates of $749+ per night, often due to premium features or locations.
- Strong performing properties (Top 25%) achieve nightly rates of $520 or more.
- Typical properties (Median) charge around $387 per night.
- Entry-level properties (Bottom 25%) earn around $285 per night.
Average Daily Rate (ADR) Trend by Month in Harwich
Get Live Harwich Market Intelligence 👇

Explore Real-time Analytics
Airbnb Seasonality Analysis & Trends in Harwich (2026)
Peak Season (July, August, June)
- Revenue averages $10,784 per month
- Occupancy rates average 59.7%
- Daily rates average $488
Shoulder Season
- Revenue averages $4,371 per month
- Occupancy maintains around 32.4%
- Daily rates hold near $447
Low Season (February, March, December)
- Revenue drops to average $2,548 per month
- Occupancy decreases to average 21.6%
- Daily rates adjust to average $421
Seasonality Insights for Harwich
- The Airbnb seasonality in Harwich shows highly seasonal trends requiring careful strategy. While the sections above show seasonal averages, it's also insightful to look at the extremes:
- During the high season, the absolute peak month showcases Harwich's highest earning potential, with monthly revenues capable of climbing to $12,389, occupancy reaching a high of 66.2%, and ADRs peaking at $495.
- Conversely, the slowest single month of the year, typically falling within the low season, marks the market's lowest point. In this month, revenue might dip to $2,038, occupancy could drop to 17.5%, and ADRs may adjust down to $394.
- Understanding both the seasonal averages and these monthly peaks and troughs in revenue, occupancy, and ADR is crucial for maximizing your Airbnb profit potential in Harwich.
Seasonal Strategies for Maximizing Profit
- Peak Season: Maximize revenue through premium pricing and potentially longer minimum stays. Ensure high availability.
- Low Season: Offer competitive pricing, special promotions (e.g., extended stay discounts), and flexible cancellation policies. Target off-season travelers like remote workers or budget-conscious guests.
- Shoulder Seasons: Implement dynamic pricing that balances peak and low rates. Target weekend travelers or specific events. Offer slightly more flexible terms than peak season.
- Regularly analyze your own performance against these Harwich seasonality benchmarks and adjust your pricing and availability strategy accordingly.
Best Areas for Airbnb Investment in Harwich (2026)
Exploring the top neighborhoods for short-term rentals in Harwich? This section highlights key areas, outlining why they are attractive for hosts and guests, along with notable local attractions. Consider these locations based on your target guest profile and investment strategy.
| Neighborhood / Area | Why Host Here? (Target Guests & Appeal) | Key Attractions & Landmarks |
|---|---|---|
| Harwich Port | A charming village known for its picturesque harbor and historical sites. Attracts tourists looking for a peaceful coastal getaway with easy access to beaches and local dining. | Harwich Port Beach, Brodie’s Pub, The Herring Run, Cape Cod Rail Trail, Saquatucket Harbor |
| West Harwich | This area features beautiful beaches and is ideal for families and couples looking to enjoy Cape Cod's scenic environment. Popular for its relaxed atmosphere and proximity to local attractions. | Battery Bark Park, Long Pond, Harwich Cranberry Route, Cape Cod Lavender Farm, Pleasant Lake |
| North Harwich | Known for its serene landscapes and outdoor activities, this area is perfect for visitors who enjoy nature and hiking. Great for attracting those who appreciate a quieter retreat. | Nickerson State Park, Cranberry bogs, Hikers and bikers trails, Harwich Conservation Trust |
| East Harwich | Offers a mix of residential and vacation homes, providing a relaxed environment that is still near the coast and local amenities. Ideal for tourists seeking comfort and convenience. | East Harwich Village, Waterfront dining, Biking trails, Kelley’s Pond |
| Harwich Center | A central part of Harwich with shops, dining, and easy access to multiple points of interest. A good choice for visitors wanting a convenient base to explore Cape Cod. | Cranberry Valley Golf Course, Harwich Historical Society, Local Art Galleries, The Harwich Community Center |
| Pleasant Lake | A beautiful suburb known for its quiet charm and proximity to Pleasant Lake. Great for those looking for private and scenic accommodations. | Pleasant Lake, For Kids Only, Pleasant Lake General Store, Fishing and boating activities |
| Red River Beach | Employs a beautiful beach setting that's ideal for families and summer visitors. Offers lots of activities by the beach and is a favorite for vacationers. | Red River Beach, Cultural events in summer, Harwich Beach Association events, Water sports activities |
| Saquatucket Harbor | A popular spot for boating and fishing enthusiasts, this harbor area is lively in the summer and offers numerous waterfront activities. | Saquatucket Harbor, Boat rentals, Fishing excursions, Beachside dining, Local seafood markets |
Understanding Airbnb License Requirements & STR Laws in Harwich (2026)
While Harwich, Massachusetts, United States currently shows low STR regulations, specific Airbnb license requirements might still exist or change. Always verify the latest short term rental regulations and Airbnb license requirements directly with local government authorities for Harwich to ensure full compliance before hosting.
(Source: AirROI data, 2026, finding no licensed listings among those analyzed)
Top Performing Airbnb Properties in Harwich (2026)
Benchmark your potential! Explore examples of top-performing Airbnb properties in Harwichbased on Trailing Twelve Month (TTM) revenue. Analyze their characteristics, revenue, occupancy rate, and ADR to understand what drives success in this market.
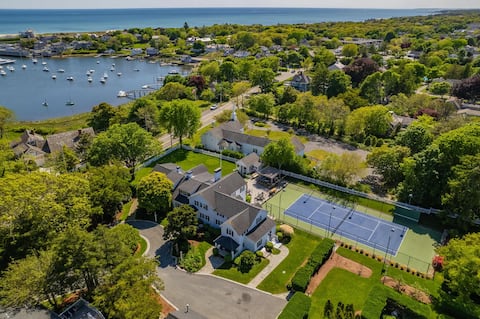
Estate with Private pool, tennis court, and playgr
Entire Place • 9 bedrooms
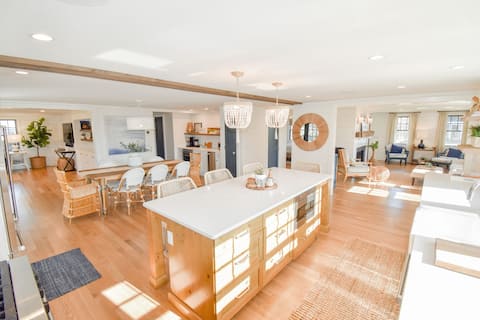
Gorgeous Home 2 Min Walk to Beach!
Entire Place • 5 bedrooms

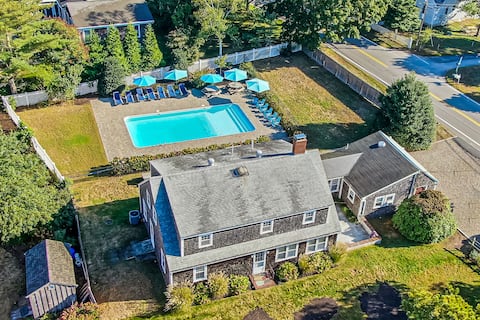
Luxurious Estate, Private Heated pool!
Entire Place • 6 bedrooms
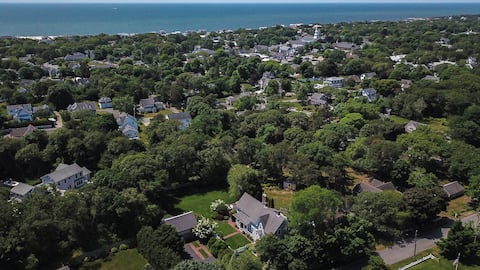
Heated Pool AC 1/2 Mile to Beach!
Entire Place • 8 bedrooms

Compound on Historic Bank St Near Wychmere Club
Entire Place • 7 bedrooms
Gorgeous Traditional Home, Modern Amenities, Downt
Entire Place • 6 bedrooms
Note: Performance varies based on location, size, amenities, seasonality, and management quality. Data reflects the past 12 months.
Top Performing Airbnb Hosts in Harwich (2026)
Learn from the best! This table showcases top-performing Airbnb hosts in Harwich based on the number of properties managed and estimated total revenue over the past year. Analyze their scale and performance metrics.
| Host Name | Properties | Grossing Revenue | Stay Reviews | Avg Rating |
|---|---|---|---|---|
| Del Mar Vacations | 32 | $3,418,011 | 721 | 4.79/5.0 |
| New England Vacation Rentals | 22 | $611,269 | 64 | 4.65/5.0 |
| Christine | 9 | $343,031 | 433 | 4.91/5.0 |
| Kim | 3 | $280,172 | 380 | 4.75/5.0 |
| Noreen | 3 | $258,295 | 120 | 4.99/5.0 |
| Aruna | 2 | $198,992 | 87 | 4.98/5.0 |
| Francis | 3 | $163,215 | 27 | 4.89/5.0 |
| Vacasa | 12 | $142,817 | 147 | 4.44/5.0 |
| Raj | 1 | $134,282 | 18 | 4.94/5.0 |
| Bryan | 1 | $128,986 | 33 | 5.00/5.0 |
Analyzing the strategies of top hosts, such as their property selection, pricing, and guest communication, can offer valuable lessons for optimizing your own Airbnb operations in Harwich.
Dive Deeper: Advanced Harwich STR Market Data (2026)
Ready to unlock more insights? AirROI provides access to advanced metrics and comprehensive Airbnb data for Harwich. Explore detailed analytics beyond this report to refine your investment strategy, optimize pricing, and maximize your vacation rental profits.
Explore Advanced MetricsHarwich Short-Term Rental Market Composition (2026): Property & Room Types
Room Type Distribution
Property Type Distribution
Market Composition Insights for Harwich
- The Harwich Airbnb market composition is heavily skewed towards Entire Home/Apt listings, which make up 97.5% of the 319 active rentals. This indicates strong guest preference for privacy and space.
- Looking at the property type distribution in Harwich, House properties are the most common (88.4%), reflecting the local real estate landscape.
- Houses represent a significant 88.4% portion, catering likely to families or larger groups.
- Smaller segments like others, hotel/boutique (combined 5.4%) offer potential for unique stay experiences.
Harwich Airbnb Room Capacity Analysis (2026): Bedroom Distribution
Distribution of Listings by Number of Bedrooms
Room Capacity Insights for Harwich
- The dominant room capacity in Harwich is 3 bedrooms listings, making up 33.2% of the market. This suggests a strong demand for properties suitable for families or small groups.
- Together, 3 bedrooms and 4 bedrooms properties represent 57.0% of the active Airbnb listings in Harwich, indicating a high concentration in these sizes.
- A significant 68.9% of listings offer 3+ bedrooms, catering to larger groups and families seeking more space in Harwich.
Harwich Vacation Rental Guest Capacity Trends (2026)
Distribution of Listings by Guest Capacity
Guest Capacity Insights for Harwich
- The most common guest capacity trend in Harwich vacation rentals is listings accommodating 8+ guests (47%). This suggests the primary traveler segment is likely larger groups.
- Properties designed for 8+ guests and 6 guests dominate the Harwich STR market, accounting for 67.7% of listings.
- 71.5% of properties accommodate 6+ guests, serving the market segment for larger families or group travel in Harwich.
- On average, properties in Harwich are equipped to host 6.2 guests.
Harwich Airbnb Booking Patterns (2026): Available vs. Booked Days
Available Days Distribution
Booked Days Distribution
Booking Pattern Insights for Harwich
- The most common availability pattern in Harwich falls within the 271-366 days range, representing 52.7% of listings. This suggests many properties have significant open periods on their calendars.
- Approximately 93.5% of listings show high availability (181+ days open annually), indicating potential for increased bookings or specific owner usage patterns.
- For booked days, the 91-180 days range is most frequent in Harwich (42.6%), reflecting common guest stay durations or potential owner blocking patterns.
- A notable 6.9% of properties secure long booking periods (181+ days booked per year), highlighting successful long-term rental strategies or significant owner usage.
Harwich Airbnb Minimum Stay Requirements Analysis
Distribution of Listings by Minimum Night Requirement
1 Night
9 listings
2.8% of total
2 Nights
35 listings
11% of total
3 Nights
28 listings
8.8% of total
4-6 Nights
31 listings
9.7% of total
7-29 Nights
20 listings
6.3% of total
30+ Nights
196 listings
61.4% of total
Key Insights
- The most prevalent minimum stay requirement in Harwich is 30+ Nights, adopted by 61.4% of listings. This highlights the market's preference for longer commitments.
- Very short stays (1-2 nights) are less common (13.8%), suggesting hosts prefer slightly longer bookings to optimize turnover.
- A significant segment (61.4%) caters to monthly stays (30+ nights) in Harwich, pointing to opportunities in the extended-stay market.
Recommendations
- Align with the market by considering a 30+ Nights minimum stay, as 61.4% of Harwich hosts use this setting.
- If feasible, allowing 1-night stays, especially midweek or during low season, could capture last-minute bookings, as only 2.8% currently do.
- Explore offering discounts for stays of 30+ nights to attract the 61.4% of the market seeking extended stays.
- Adjust minimum nights based on seasonality – potentially shorter during low season and longer during peak demand periods in Harwich.
Harwich Airbnb Cancellation Policy Trends Analysis (2026)
Super Strict 30 Days
26 listings
8.2% of total
Super Strict 60 Days
14 listings
4.4% of total
Flexible
15 listings
4.7% of total
Moderate
38 listings
11.9% of total
Firm
157 listings
49.2% of total
Strict
69 listings
21.6% of total
Cancellation Policy Insights for Harwich
- The prevailing Airbnb cancellation policy trend in Harwich is Firm, used by 49.2% of listings.
- A majority (70.8%) of hosts in Harwich utilize Firm or Strict policies, indicating a market where hosts prioritize booking security.
Recommendations for Hosts
- Consider adopting a Firm policy to align with the 49.2% market standard in Harwich.
- Regularly review your cancellation policy against competitors and market demand shifts in Harwich.
Harwich STR Booking Lead Time Analysis (2026)
Average Booking Lead Time by Month
Booking Lead Time Insights for Harwich
- The overall average booking lead time for vacation rentals in Harwich is 92 days.
- Guests book furthest in advance for stays during July (average 129 days), likely coinciding with peak travel demand or local events.
- The shortest booking windows occur for stays in March (average 49 days), indicating more last-minute travel plans during this time.
- Seasonally, Summer (117 days avg.) sees the longest lead times, while Winter (60 days avg.) has the shortest, reflecting typical travel planning cycles.
Recommendations for Hosts
- Use the overall average lead time (92 days) as a baseline for your pricing and availability strategy in Harwich.
- For July stays, consider implementing length-of-stay discounts or slightly higher rates for bookings made less than 129 days out to capitalize on advance planning.
- Target marketing efforts for the Summer season well in advance (at least 117 days) to capture early planners.
- Monitor your own booking lead times against these Harwich averages to identify opportunities for dynamic pricing adjustments.
Popular & Essential Airbnb Amenities in Harwich (2026)
Amenity Prevalence
Amenity Insights for Harwich
- Essential amenities in Harwich that guests expect include: Wifi, TV, Smoke alarm, Air conditioning, Free parking on premises, Coffee maker, Kitchen, Refrigerator, Microwave. Lacking these (any) could significantly impact bookings.
- Popular amenities like Carbon monoxide alarm are common but not universal. Offering these can provide a competitive edge.
Recommendations for Hosts
- Ensure your listing includes all essential amenities for Harwich: Wifi, TV, Smoke alarm, Air conditioning, Free parking on premises, Coffee maker, Kitchen, Refrigerator, Microwave.
- Prioritize adding missing essentials: Wifi, TV, Smoke alarm, Air conditioning, Free parking on premises, Coffee maker, Kitchen, Refrigerator, Microwave.
- Consider adding popular differentiators like Carbon monoxide alarm to increase appeal.
- Highlight unique or less common amenities you offer (e.g., hot tub, dedicated workspace, EV charger) in your listing description and photos.
- Regularly check competitor amenities in Harwich to stay competitive.
Harwich Airbnb Guest Demographics & Profile Analysis (2026)
Guest Profile Summary for Harwich
- The typical guest profile for Airbnb in Harwich consists of primarily domestic travelers (95%), often arriving from nearby Boston, typically belonging to the Post-2000s (Gen Z/Alpha) group (50%), primarily speaking English or Spanish.
- Domestic travelers account for 95.0% of guests.
- Key international markets include United States (95%) and United Kingdom (1.5%).
- Top languages spoken are English (73.6%) followed by Spanish (9.6%).
- A significant demographic segment is the Post-2000s (Gen Z/Alpha) group, representing 50% of guests.
Recommendations for Hosts
- Target domestic marketing efforts towards travelers from Boston and New York.
- Tailor amenities and listing descriptions to appeal to the dominant Post-2000s (Gen Z/Alpha) demographic (e.g., highlight fast WiFi, smart home features, local guides).
- Highlight unique local experiences or amenities relevant to the primary guest profile.
- Consider seasonal promotions aligned with peak travel times for key origin markets.
Nearby Short-Term Rental Market Comparison
How does the Harwich Airbnb market stack up against its neighbors? Compare key performance metrics like average monthly revenue, ADR, and occupancy rates in surrounding areas to understand the broader regional STR landscape.
| Market | Active Properties | Monthly Revenue | Daily Rate | Avg. Occupancy |
|---|---|---|---|---|
| Nantucket | 539 | $7,748 | $1045.40 | 41% |
| Middletown | 395 | $5,781 | $589.01 | 45% |
| North Andover | 12 | $5,625 | $440.84 | 45% |
| Nahant | 13 | $5,564 | $602.44 | 42% |
| New Shoreham | 120 | $5,359 | $637.79 | 45% |
| Wellesley | 22 | $5,310 | $520.90 | 50% |
| Edgartown | 255 | $5,250 | $818.21 | 40% |
| Mattapoisett | 34 | $5,105 | $476.61 | 52% |
| Amherst | 10 | $5,003 | $366.01 | 44% |
| Chatham | 370 | $4,755 | $532.54 | 43% |