Foxborough Airbnb Market Analysis 2026: Short Term Rental Data & Vacation Rental Statistics in Massachusetts, United States
Is Airbnb profitable in Foxborough in 2026? Explore comprehensive Airbnb analytics for Foxborough, Massachusetts, United States to uncover income potential. This 2026 STR market report for Foxborough, based on AirROI data from February 2025 to January 2026, reveals key trends in the niche market of 33 active listings.
Whether you're considering an Airbnb investment in Foxborough, optimizing your existing vacation rental, or exploring rental arbitrage opportunities, understanding the Foxborough Airbnb data is crucial. Leveraging the low regulation environment is key to maximizing your short term rental income potential. Let's dive into the specifics.
Key Foxborough Airbnb Performance Metrics Overview
Monthly Airbnb Revenue Variations & Income Potential in Foxborough (2026)
Understanding the monthly revenue variations for Airbnb listings in Foxborough is key to maximizing your short term rental income potential. Seasonality significantly impacts earnings. Our analysis, based on data from the past 12 months, shows that the peak revenue month for STRs in Foxborough is typically July, while December often presents the lowest earnings, highlighting opportunities for strategic pricing adjustments during shoulder and low seasons. Explore the typical Airbnb income in Foxborough across different performance tiers:
- Best-in-class properties (Top 10%) achieve $9,796+ monthly, often utilizing dynamic pricing and superior guest experiences.
- Strong performing properties (Top 25%) earn $3,803 or more, indicating effective management and desirable locations/amenities.
- Typical properties (Median) generate around $1,447 per month, representing the average market performance.
- Entry-level properties (Bottom 25%) see earnings around $662, often with potential for optimization.
Average Monthly Airbnb Earnings Trend in Foxborough
Foxborough Airbnb Occupancy Rate Trends (2026)
Maximize your bookings by understanding the Foxborough STR occupancy trends. Seasonal demand shifts significantly influence how often properties are booked. Typically, Maysees the highest demand (peak season occupancy), while December experiences the lowest (low season). Effective strategies, like adjusting minimum stays or offering promotions, can boost occupancy during slower periods. Here's how different property tiers perform in Foxborough:
- Best-in-class properties (Top 10%) achieve 57%+ occupancy, indicating high desirability and potentially optimized availability.
- Strong performing properties (Top 25%) maintain 33% or higher occupancy, suggesting good market fit and guest satisfaction.
- Typical properties (Median) have an occupancy rate around 19%.
- Entry-level properties (Bottom 25%) average 9% occupancy, potentially facing higher vacancy.
Average Monthly Occupancy Rate Trend in Foxborough
Average Daily Rate (ADR) Airbnb Trends in Foxborough (2026)
Effective short term rental pricing strategy in Foxborough involves understanding monthly ADR fluctuations. The Average Daily Rate (ADR) for Airbnb in Foxborough typically peaks in October and dips lowest during March. Leveraging Airbnb dynamic pricing tools or strategies based on this seasonality can significantly boost revenue. Here's a look at the typical nightly rates achieved:
- Best-in-class properties (Top 10%) command rates of $711+ per night, often due to premium features or locations.
- Strong performing properties (Top 25%) achieve nightly rates of $383 or more.
- Typical properties (Median) charge around $209 per night.
- Entry-level properties (Bottom 25%) earn around $168 per night.
Average Daily Rate (ADR) Trend by Month in Foxborough
Get Live Foxborough Market Intelligence 👇

Explore Real-time Analytics
Airbnb Seasonality Analysis & Trends in Foxborough (2026)
Peak Season (July, April, September)
- Revenue averages $5,452 per month
- Occupancy rates average 28.6%
- Daily rates average $363
Shoulder Season
- Revenue averages $3,697 per month
- Occupancy maintains around 25.8%
- Daily rates hold near $360
Low Season (February, November, December)
- Revenue drops to average $1,713 per month
- Occupancy decreases to average 20.6%
- Daily rates adjust to average $354
Seasonality Insights for Foxborough
- The Airbnb seasonality in Foxborough shows highly seasonal trends requiring careful strategy. While the sections above show seasonal averages, it's also insightful to look at the extremes:
- During the high season, the absolute peak month showcases Foxborough's highest earning potential, with monthly revenues capable of climbing to $5,544, occupancy reaching a high of 34.7%, and ADRs peaking at $414.
- Conversely, the slowest single month of the year, typically falling within the low season, marks the market's lowest point. In this month, revenue might dip to $1,208, occupancy could drop to 15.2%, and ADRs may adjust down to $297.
- Understanding both the seasonal averages and these monthly peaks and troughs in revenue, occupancy, and ADR is crucial for maximizing your Airbnb profit potential in Foxborough.
Seasonal Strategies for Maximizing Profit
- Peak Season: Maximize revenue through premium pricing and potentially longer minimum stays. Ensure high availability.
- Low Season: Offer competitive pricing, special promotions (e.g., extended stay discounts), and flexible cancellation policies. Target off-season travelers like remote workers or budget-conscious guests.
- Shoulder Seasons: Implement dynamic pricing that balances peak and low rates. Target weekend travelers or specific events. Offer slightly more flexible terms than peak season.
- Regularly analyze your own performance against these Foxborough seasonality benchmarks and adjust your pricing and availability strategy accordingly.
Best Areas for Airbnb Investment in Foxborough (2026)
Exploring the top neighborhoods for short-term rentals in Foxborough? This section highlights key areas, outlining why they are attractive for hosts and guests, along with notable local attractions. Consider these locations based on your target guest profile and investment strategy.
| Neighborhood / Area | Why Host Here? (Target Guests & Appeal) | Key Attractions & Landmarks |
|---|---|---|
| Foxborough Town Center | Convenient location with easy access to restaurants, shops, and attractions. Ideal for visitors wanting to explore the local community and nearby events. | Foxborough Common, Patriot Place, Gillette Stadium, Museum of America, F. Gilbert Hills State Forest |
| Gillette Stadium Area | Home to the New England Patriots and major concerts, this area draws sports fans and concert-goers, making it an ideal spot for short-term rentals. | Gillette Stadium, Patriot Place, Ten Pin Eatery, Cinemark at Patriot Place, The Hall at Patriot Place |
| Foxborough State Forest | A beautiful natural area that appeals to outdoor enthusiasts. Renting here targets families and nature lovers seeking recreational activities like hiking and picnicking. | Foxborough State Forest, hiking trails, picnic areas, wildlife viewing, scenic views |
| Patriot Place | A dynamic shopping, dining, and entertainment venue that attracts a wide range of visitors looking for convenience and fun during their stay. | Patriot Place shopping, restaurants, apple picking, concert events, sports games |
| East Foxborough | A quiet residential area perfect for families visiting for local events or those seeking a peaceful getaway. Offers a local vibe. | F. Gilbert Hills State Forest, local parks, walking trails, scenic drives, community events |
| North Foxborough | A suburban area with access to schools and parks, ideal for families and longer stays. Visitors appreciate the community feel and family-oriented attractions. | Mansfield Local Historic District, D.W. Field Park, local events, craft fairs, family-friendly restaurants |
| South Foxborough | Close to the train station, this area is great for commuters heading to Boston or Providence, appealing to business and leisure travelers alike. | Commuter Rail access, restaurants near the station, Foxborough Heritage Park, local shops |
| Foxborough Industrial Park | Attractive for business travelers attending events or meetings in the area, offering easy access to major roads and amenities. | local businesses, meeting facilities, professional services, nearby restaurants, convenience for corporate travel |
Understanding Airbnb License Requirements & STR Laws in Foxborough (2026)
While Foxborough, Massachusetts, United States currently shows low STR regulations, specific Airbnb license requirements might still exist or change. Always verify the latest short term rental regulations and Airbnb license requirements directly with local government authorities for Foxborough to ensure full compliance before hosting.
(Source: AirROI data, 2026, finding no licensed listings among those analyzed)
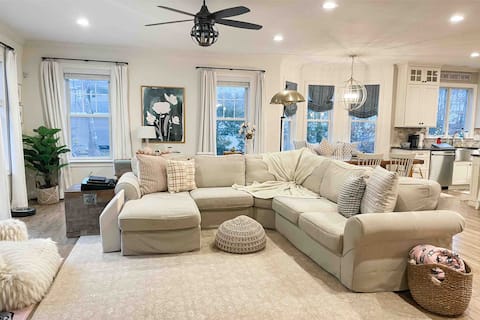
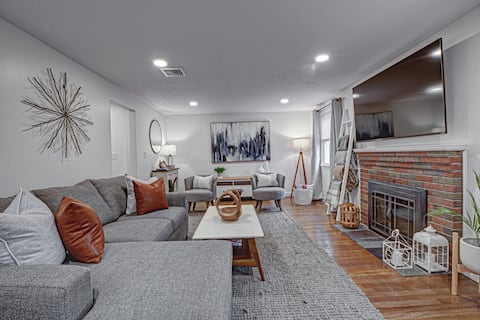
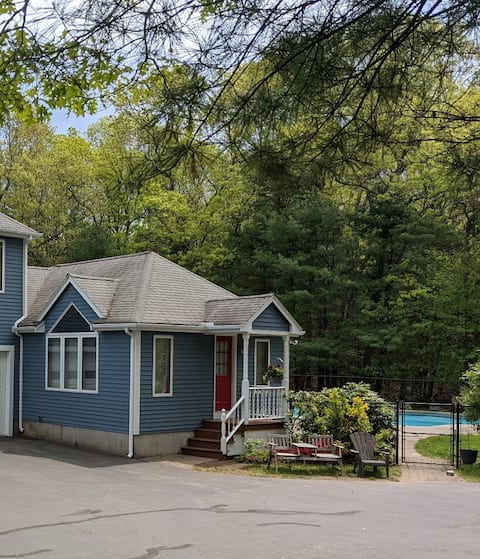
Top Performing Airbnb Properties in Foxborough (2026)
Benchmark your potential! Explore examples of top-performing Airbnb properties in Foxboroughbased on Trailing Twelve Month (TTM) revenue. Analyze their characteristics, revenue, occupancy rate, and ADR to understand what drives success in this market.
Walk to Gillette Stadium!
Entire Place • 4 bedrooms

Patriots Getaway
Entire Place • 4 bedrooms

A Lux Family Villa 6min to Gillette *Pool&Hot-Tub*
Entire Place • 5 bedrooms
Bates Boutique ☆ Home Away From Home
Entire Place • 4 bedrooms
World Cup Ready • 7 Miles to Gillette • Sleeps 6
Entire Place • 1 bedroom

2 Mi to Gillette Stadium: Foxborough Retreat!
Entire Place • 4 bedrooms
Note: Performance varies based on location, size, amenities, seasonality, and management quality. Data reflects the past 12 months.
Top Performing Airbnb Hosts in Foxborough (2026)
Learn from the best! This table showcases top-performing Airbnb hosts in Foxborough based on the number of properties managed and estimated total revenue over the past year. Analyze their scale and performance metrics.
| Host Name | Properties | Grossing Revenue | Stay Reviews | Avg Rating |
|---|---|---|---|---|
| Cristina | 1 | $304,598 | 7 | 5.00/5.0 |
| RoomPicks | 8 | $110,421 | 36 | 4.31/5.0 |
| Mornette | 5 | $98,405 | 293 | 4.93/5.0 |
| Sherri | 1 | $84,790 | 2 | Not Rated |
| Nas | 1 | $82,066 | 54 | 4.96/5.0 |
| Rodney | 1 | $73,903 | 190 | 4.97/5.0 |
| Elizabeth | 1 | $61,752 | 11 | 5.00/5.0 |
| Evolve | 1 | $59,160 | 9 | 4.33/5.0 |
| Anthony | 1 | $49,165 | 111 | 4.88/5.0 |
| Tina | 10 | $47,018 | 782 | 4.60/5.0 |
Analyzing the strategies of top hosts, such as their property selection, pricing, and guest communication, can offer valuable lessons for optimizing your own Airbnb operations in Foxborough.
Dive Deeper: Advanced Foxborough STR Market Data (2026)
Ready to unlock more insights? AirROI provides access to advanced metrics and comprehensive Airbnb data for Foxborough. Explore detailed analytics beyond this report to refine your investment strategy, optimize pricing, and maximize your vacation rental profits.
Explore Advanced MetricsFoxborough Short-Term Rental Market Composition (2026): Property & Room Types
Room Type Distribution
Property Type Distribution
Market Composition Insights for Foxborough
- The Foxborough Airbnb market composition is heavily skewed towards Entire Home/Apt listings, which make up 57.6% of the 33 active rentals. This indicates strong guest preference for privacy and space.
- However, a notable 42.4% share for Private Rooms suggests opportunities for budget-conscious travelers or hosts renting out spare rooms.
- Looking at the property type distribution in Foxborough, House properties are the most common (36.4%), reflecting the local real estate landscape.
- Houses represent a significant 36.4% portion, catering likely to families or larger groups.
- The presence of 30.3% Hotel/Boutique listings indicates integration with traditional hospitality.
Foxborough Airbnb Room Capacity Analysis (2026): Bedroom Distribution
Distribution of Listings by Number of Bedrooms
Room Capacity Insights for Foxborough
- The dominant room capacity in Foxborough is 1 bedroom listings, making up 39.4% of the market. This suggests a strong demand for properties suitable for couples or solo travelers.
- Together, 1 bedroom and 4 bedrooms properties represent 51.5% of the active Airbnb listings in Foxborough, indicating a high concentration in these sizes.
- A significant 24.2% of listings offer 3+ bedrooms, catering to larger groups and families seeking more space in Foxborough.
Foxborough Vacation Rental Guest Capacity Trends (2026)
Distribution of Listings by Guest Capacity
Guest Capacity Insights for Foxborough
- The most common guest capacity trend in Foxborough vacation rentals is listings accommodating 2 guests (21.2%). This suggests the primary traveler segment is likely couples or solo travelers.
- Properties designed for 2 guests and 8+ guests dominate the Foxborough STR market, accounting for 42.4% of listings.
- 36.3% of properties accommodate 6+ guests, serving the market segment for larger families or group travel in Foxborough.
- On average, properties in Foxborough are equipped to host 4.0 guests.
Foxborough Airbnb Booking Patterns (2026): Available vs. Booked Days
Available Days Distribution
Booked Days Distribution
Booking Pattern Insights for Foxborough
- The most common availability pattern in Foxborough falls within the 271-366 days range, representing 78.8% of listings. This suggests many properties have significant open periods on their calendars.
- Approximately 90.9% of listings show high availability (181+ days open annually), indicating potential for increased bookings or specific owner usage patterns.
- For booked days, the 31-90 days range is most frequent in Foxborough (42.4%), reflecting common guest stay durations or potential owner blocking patterns.
- A notable 9.1% of properties secure long booking periods (181+ days booked per year), highlighting successful long-term rental strategies or significant owner usage.
Foxborough Airbnb Minimum Stay Requirements Analysis
Distribution of Listings by Minimum Night Requirement
1 Night
23 listings
69.7% of total
2 Nights
3 listings
9.1% of total
3 Nights
1 listings
3% of total
30+ Nights
6 listings
18.2% of total
Key Insights
- The most prevalent minimum stay requirement in Foxborough is 1 Night, adopted by 69.7% of listings. This highlights the market's preference for shorter, flexible bookings.
- A strong majority (78.8%) of the Foxborough Airbnb data shows acceptance of very short stays (1-2 nights), indicating a dynamic, high-turnover market.
- A significant segment (18.2%) caters to monthly stays (30+ nights) in Foxborough, pointing to opportunities in the extended-stay market.
Recommendations
- Align with the market by considering a 1 Night minimum stay, as 69.7% of Foxborough hosts use this setting.
- Explore offering discounts for stays of 30+ nights to attract the 18.2% of the market seeking extended stays.
- Adjust minimum nights based on seasonality – potentially shorter during low season and longer during peak demand periods in Foxborough.
Foxborough Airbnb Cancellation Policy Trends Analysis (2026)
Flexible
5 listings
15.2% of total
Moderate
11 listings
33.3% of total
Firm
16 listings
48.5% of total
Strict
1 listings
3% of total
Cancellation Policy Insights for Foxborough
- The prevailing Airbnb cancellation policy trend in Foxborough is Firm, used by 48.5% of listings.
- A majority (51.5%) of hosts in Foxborough utilize Firm or Strict policies, indicating a market where hosts prioritize booking security.
- Strict cancellation policies are quite rare (3%), potentially making listings with this policy less competitive unless justified by high demand or property type.
Recommendations for Hosts
- Consider adopting a Firm policy to align with the 48.5% market standard in Foxborough.
- Using a Strict policy might deter some guests, as only 3% of listings use it. Evaluate if potential revenue protection outweighs possible lower booking rates.
- Regularly review your cancellation policy against competitors and market demand shifts in Foxborough.
Foxborough STR Booking Lead Time Analysis (2026)
Average Booking Lead Time by Month
Booking Lead Time Insights for Foxborough
- The overall average booking lead time for vacation rentals in Foxborough is 64 days.
- Guests book furthest in advance for stays during May (average 86 days), likely coinciding with peak travel demand or local events.
- The shortest booking windows occur for stays in February (average 3 days), indicating more last-minute travel plans during this time.
- Seasonally, Summer (72 days avg.) sees the longest lead times, while Winter (39 days avg.) has the shortest, reflecting typical travel planning cycles.
Recommendations for Hosts
- Use the overall average lead time (64 days) as a baseline for your pricing and availability strategy in Foxborough.
- For May stays, consider implementing length-of-stay discounts or slightly higher rates for bookings made less than 86 days out to capitalize on advance planning.
- During February, focus on last-minute booking availability and promotions, as guests book with very short notice (3 days avg.).
- Target marketing efforts for the Summer season well in advance (at least 72 days) to capture early planners.
- Monitor your own booking lead times against these Foxborough averages to identify opportunities for dynamic pricing adjustments.
Popular & Essential Airbnb Amenities in Foxborough (2026)
Amenity Prevalence
Amenity Insights for Foxborough
- Essential amenities in Foxborough that guests expect include: Heating, Smoke alarm, Wifi, Free parking on premises, TV, Coffee maker, Air conditioning. Lacking these (any) could significantly impact bookings.
- Popular amenities like Hair dryer, Carbon monoxide alarm, Iron are common but not universal. Offering these can provide a competitive edge.
Recommendations for Hosts
- Ensure your listing includes all essential amenities for Foxborough: Heating, Smoke alarm, Wifi, Free parking on premises, TV, Coffee maker, Air conditioning.
- Prioritize adding missing essentials: TV, Coffee maker, Air conditioning.
- Consider adding popular differentiators like Hair dryer or Carbon monoxide alarm to increase appeal.
- Highlight unique or less common amenities you offer (e.g., hot tub, dedicated workspace, EV charger) in your listing description and photos.
- Regularly check competitor amenities in Foxborough to stay competitive.
Foxborough Airbnb Guest Demographics & Profile Analysis (2026)
Guest Profile Summary for Foxborough
- The typical guest profile for Airbnb in Foxborough consists of primarily domestic travelers (88%), often arriving from nearby Boston, typically belonging to the Post-2000s (Gen Z/Alpha) group (50%), primarily speaking English or Spanish.
- Domestic travelers account for 87.5% of guests.
- Key international markets include United States (87.5%) and Canada (7%).
- Top languages spoken are English (73.9%) followed by Spanish (11.6%).
- A significant demographic segment is the Post-2000s (Gen Z/Alpha) group, representing 50% of guests.
Recommendations for Hosts
- Target domestic marketing efforts towards travelers from Boston and Montreal.
- Tailor amenities and listing descriptions to appeal to the dominant Post-2000s (Gen Z/Alpha) demographic (e.g., highlight fast WiFi, smart home features, local guides).
- Highlight unique local experiences or amenities relevant to the primary guest profile.
- Consider seasonal promotions aligned with peak travel times for key origin markets.
Nearby Short-Term Rental Market Comparison
How does the Foxborough Airbnb market stack up against its neighbors? Compare key performance metrics like average monthly revenue, ADR, and occupancy rates in surrounding areas to understand the broader regional STR landscape.
| Market | Active Properties | Monthly Revenue | Daily Rate | Avg. Occupancy |
|---|---|---|---|---|
| Nantucket | 539 | $7,748 | $1045.40 | 41% |
| Pomfret | 15 | $6,549 | $502.74 | 45% |
| Town of East Hampton | 1,327 | $5,945 | $986.02 | 36% |
| Hanover | 33 | $5,826 | $1189.51 | 41% |
| Middletown | 395 | $5,781 | $589.01 | 45% |
| North Andover | 12 | $5,625 | $440.84 | 45% |
| Nahant | 13 | $5,564 | $602.44 | 42% |
| New Shoreham | 120 | $5,359 | $637.79 | 45% |
| South Berwick | 12 | $5,351 | $228.88 | 58% |
| Wellesley | 22 | $5,310 | $520.90 | 50% |