Danvers Airbnb Market Analysis 2026: Short Term Rental Data & Vacation Rental Statistics in Massachusetts, United States
Is Airbnb profitable in Danvers in 2026? Explore comprehensive Airbnb analytics for Danvers, Massachusetts, United States to uncover income potential. This 2026 STR market report for Danvers, based on AirROI data from February 2025 to January 2026, reveals key trends in the niche market of 24 active listings.
Whether you're considering an Airbnb investment in Danvers, optimizing your existing vacation rental, or exploring rental arbitrage opportunities, understanding the Danvers Airbnb data is crucial. Leveraging the low regulation environment is key to maximizing your short term rental income potential. Let's dive into the specifics.
Key Danvers Airbnb Performance Metrics Overview
Monthly Airbnb Revenue Variations & Income Potential in Danvers (2026)
Understanding the monthly revenue variations for Airbnb listings in Danvers is key to maximizing your short term rental income potential. Seasonality significantly impacts earnings. Our analysis, based on data from the past 12 months, shows that the peak revenue month for STRs in Danvers is typically October, while January often presents the lowest earnings, highlighting opportunities for strategic pricing adjustments during shoulder and low seasons. Explore the typical Airbnb income in Danvers across different performance tiers:
- Best-in-class properties (Top 10%) achieve $7,620+ monthly, often utilizing dynamic pricing and superior guest experiences.
- Strong performing properties (Top 25%) earn $4,531 or more, indicating effective management and desirable locations/amenities.
- Typical properties (Median) generate around $2,590 per month, representing the average market performance.
- Entry-level properties (Bottom 25%) see earnings around $1,647, often with potential for optimization.
Average Monthly Airbnb Earnings Trend in Danvers
Danvers Airbnb Occupancy Rate Trends (2026)
Maximize your bookings by understanding the Danvers STR occupancy trends. Seasonal demand shifts significantly influence how often properties are booked. Typically, Augustsees the highest demand (peak season occupancy), while January experiences the lowest (low season). Effective strategies, like adjusting minimum stays or offering promotions, can boost occupancy during slower periods. Here's how different property tiers perform in Danvers:
- Best-in-class properties (Top 10%) achieve 81%+ occupancy, indicating high desirability and potentially optimized availability.
- Strong performing properties (Top 25%) maintain 65% or higher occupancy, suggesting good market fit and guest satisfaction.
- Typical properties (Median) have an occupancy rate around 49%.
- Entry-level properties (Bottom 25%) average 28% occupancy, potentially facing higher vacancy.
Average Monthly Occupancy Rate Trend in Danvers
Average Daily Rate (ADR) Airbnb Trends in Danvers (2026)
Effective short term rental pricing strategy in Danvers involves understanding monthly ADR fluctuations. The Average Daily Rate (ADR) for Airbnb in Danvers typically peaks in October and dips lowest during February. Leveraging Airbnb dynamic pricing tools or strategies based on this seasonality can significantly boost revenue. Here's a look at the typical nightly rates achieved:
- Best-in-class properties (Top 10%) command rates of $402+ per night, often due to premium features or locations.
- Strong performing properties (Top 25%) achieve nightly rates of $277 or more.
- Typical properties (Median) charge around $163 per night.
- Entry-level properties (Bottom 25%) earn around $125 per night.
Average Daily Rate (ADR) Trend by Month in Danvers
Get Live Danvers Market Intelligence 👇

Explore Real-time Analytics
Airbnb Seasonality Analysis & Trends in Danvers (2026)
Peak Season (October, August, September)
- Revenue averages $5,058 per month
- Occupancy rates average 64.4%
- Daily rates average $242
Shoulder Season
- Revenue averages $3,226 per month
- Occupancy maintains around 46.4%
- Daily rates hold near $211
Low Season (January, February, March)
- Revenue drops to average $2,386 per month
- Occupancy decreases to average 36.0%
- Daily rates adjust to average $194
Seasonality Insights for Danvers
- The Airbnb seasonality in Danvers shows highly seasonal trends requiring careful strategy. While the sections above show seasonal averages, it's also insightful to look at the extremes:
- During the high season, the absolute peak month showcases Danvers's highest earning potential, with monthly revenues capable of climbing to $5,935, occupancy reaching a high of 68.8%, and ADRs peaking at $271.
- Conversely, the slowest single month of the year, typically falling within the low season, marks the market's lowest point. In this month, revenue might dip to $1,975, occupancy could drop to 27.0%, and ADRs may adjust down to $183.
- Understanding both the seasonal averages and these monthly peaks and troughs in revenue, occupancy, and ADR is crucial for maximizing your Airbnb profit potential in Danvers.
Seasonal Strategies for Maximizing Profit
- Peak Season: Maximize revenue through premium pricing and potentially longer minimum stays. Ensure high availability.
- Low Season: Offer competitive pricing, special promotions (e.g., extended stay discounts), and flexible cancellation policies. Target off-season travelers like remote workers or budget-conscious guests.
- Shoulder Seasons: Implement dynamic pricing that balances peak and low rates. Target weekend travelers or specific events. Offer slightly more flexible terms than peak season.
- Regularly analyze your own performance against these Danvers seasonality benchmarks and adjust your pricing and availability strategy accordingly.
Best Areas for Airbnb Investment in Danvers (2026)
Exploring the top neighborhoods for short-term rentals in Danvers? This section highlights key areas, outlining why they are attractive for hosts and guests, along with notable local attractions. Consider these locations based on your target guest profile and investment strategy.
| Neighborhood / Area | Why Host Here? (Target Guests & Appeal) | Key Attractions & Landmarks |
|---|---|---|
| Danvers Center | The heart of Danvers, featuring an array of shops, restaurants, and historical sites. Attracts visitors for its charming New England vibe and convenience to local attractions. | Danvers Museum, Endicott Park, The North Shore Music Theatre, Historic Danvers, Danvers Rail Trail |
| Danversport | A scenic area along the water with parks and waterfront views. Great for guests looking to enjoy outdoor activities and proximity to nature. | Danversport Yacht Club, Waterfront Park, Cherry Hill Park, Whipple Hill, Beverly Harbor |
| Coolidge Park | A residential area known for its quiet atmosphere and family-friendly environment. Ideal for guests seeking a relaxing stay with access to local amenities. | Coolidge Park, Danvers High School, local shops and cafes, nearby hiking trails, historical landmarks |
| Gallows Hill | Historical significance with close proximity to Salem and its attractions, appealing to those interested in history and culture. | Gallows Hill Park, Salem Witch Trials Memorial, Peabody Essex Museum, The House of the Seven Gables, Salem Common |
| Liberty Tree Mall | A shopping hub in the region that draws visitors for retail therapy and dining options. Popular among families and shoppers. | Liberty Tree Mall, restaurants and cafes, regional attractions, movie theaters, family entertainment centers |
| Ashland Farm | A peaceful neighborhood with a focus on nature and community. Great for those looking to escape the hustle and bustle and enjoy a quiet retreat. | nature trails, local parks, close proximity to hiking, community events, scenic views |
| Endicott Park | A destination known for its recreational offerings, including trails and outdoor activities, appealing to active travelers. | Endicott Park, walking trails, picnic areas, dog parks, nature observation |
| Danvers High School Area | Home to educational facilities and community activities, it attracts families and those visiting local students. | Danvers High School, community sports events, local theaters, education-focused events, residential amenities |
Understanding Airbnb License Requirements & STR Laws in Danvers (2026)
While Danvers, Massachusetts, United States currently shows low STR regulations, specific Airbnb license requirements might still exist or change. Always verify the latest short term rental regulations and Airbnb license requirements directly with local government authorities for Danvers to ensure full compliance before hosting.
(Source: AirROI data, 2026, finding no licensed listings among those analyzed)
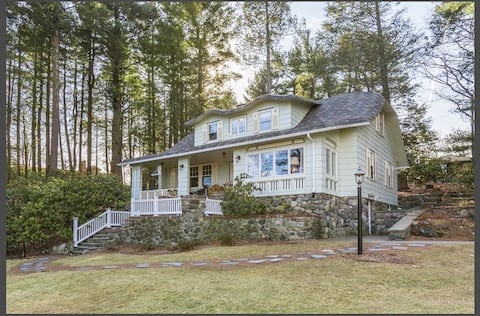
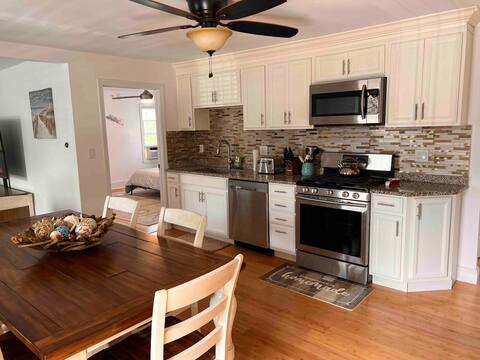
Top Performing Airbnb Properties in Danvers (2026)
Benchmark your potential! Explore examples of top-performing Airbnb properties in Danversbased on Trailing Twelve Month (TTM) revenue. Analyze their characteristics, revenue, occupancy rate, and ADR to understand what drives success in this market.
Private & Convenient Home in Danvers
Entire Place • 4 bedrooms

Large, Comfortable & Conveniently located Home
Entire Place • 4 bedrooms
Danvers spacious apt near mall/ Hospital/Salem
Entire Place • 3 bedrooms

Luxury and modern apt near Mall/Hospital/Salem
Entire Place • 3 bedrooms

Charming upscale apartment
Entire Place • 2 bedrooms

Historical period home with modern amenities..
Entire Place • 2 bedrooms
Note: Performance varies based on location, size, amenities, seasonality, and management quality. Data reflects the past 12 months.
Top Performing Airbnb Hosts in Danvers (2026)
Learn from the best! This table showcases top-performing Airbnb hosts in Danvers based on the number of properties managed and estimated total revenue over the past year. Analyze their scale and performance metrics.
| Host Name | Properties | Grossing Revenue | Stay Reviews | Avg Rating |
|---|---|---|---|---|
| Osvaldo | 2 | $135,980 | 179 | 4.97/5.0 |
| Julie | 1 | $117,048 | 159 | 4.92/5.0 |
| Kuan | 1 | $102,282 | 110 | 4.98/5.0 |
| Robert | 3 | $101,805 | 261 | 4.85/5.0 |
| Albana | 1 | $50,718 | 61 | 4.98/5.0 |
| Evolve | 1 | $31,089 | 28 | 4.96/5.0 |
| Elizabeth M | 1 | $29,094 | 336 | 4.94/5.0 |
| Eileen V | 1 | $23,865 | 106 | 4.97/5.0 |
| Lois | 1 | $23,601 | 38 | 5.00/5.0 |
| Bruna | 1 | $22,495 | 106 | 4.86/5.0 |
Analyzing the strategies of top hosts, such as their property selection, pricing, and guest communication, can offer valuable lessons for optimizing your own Airbnb operations in Danvers.
Dive Deeper: Advanced Danvers STR Market Data (2026)
Ready to unlock more insights? AirROI provides access to advanced metrics and comprehensive Airbnb data for Danvers. Explore detailed analytics beyond this report to refine your investment strategy, optimize pricing, and maximize your vacation rental profits.
Explore Advanced MetricsDanvers Short-Term Rental Market Composition (2026): Property & Room Types
Room Type Distribution
Property Type Distribution
Market Composition Insights for Danvers
- The Danvers Airbnb market composition is heavily skewed towards Entire Home/Apt listings, which make up 79.2% of the 24 active rentals. This indicates strong guest preference for privacy and space.
- Looking at the property type distribution in Danvers, Apartment/Condo properties are the most common (62.5%), reflecting the local real estate landscape.
- Houses represent a significant 16.7% portion, catering likely to families or larger groups.
- The presence of 8.3% Hotel/Boutique listings indicates integration with traditional hospitality.
Danvers Airbnb Room Capacity Analysis (2026): Bedroom Distribution
Distribution of Listings by Number of Bedrooms
Room Capacity Insights for Danvers
- The dominant room capacity in Danvers is 1 bedroom listings, making up 41.7% of the market. This suggests a strong demand for properties suitable for couples or solo travelers.
- Together, 1 bedroom and 2 bedrooms properties represent 58.4% of the active Airbnb listings in Danvers, indicating a high concentration in these sizes.
- A significant 20.8% of listings offer 3+ bedrooms, catering to larger groups and families seeking more space in Danvers.
Danvers Vacation Rental Guest Capacity Trends (2026)
Distribution of Listings by Guest Capacity
Guest Capacity Insights for Danvers
- The most common guest capacity trend in Danvers vacation rentals is listings accommodating 2 guests (29.2%). This suggests the primary traveler segment is likely couples or solo travelers.
- Properties designed for 2 guests and 4 guests dominate the Danvers STR market, accounting for 50.0% of listings.
- 20.8% of properties accommodate 6+ guests, serving the market segment for larger families or group travel in Danvers.
- On average, properties in Danvers are equipped to host 3.4 guests.
Danvers Airbnb Booking Patterns (2026): Available vs. Booked Days
Available Days Distribution
Booked Days Distribution
Booking Pattern Insights for Danvers
- The most common availability pattern in Danvers falls within the 271-366 days range, representing 37.5% of listings. This suggests many properties have significant open periods on their calendars.
- Approximately 70.8% of listings show high availability (181+ days open annually), indicating potential for increased bookings or specific owner usage patterns.
- For booked days, the 91-180 days range is most frequent in Danvers (29.2%), reflecting common guest stay durations or potential owner blocking patterns.
- A notable 33.3% of properties secure long booking periods (181+ days booked per year), highlighting successful long-term rental strategies or significant owner usage.
Danvers Airbnb Minimum Stay Requirements Analysis
Distribution of Listings by Minimum Night Requirement
1 Night
6 listings
25% of total
2 Nights
6 listings
25% of total
3 Nights
1 listings
4.2% of total
7-29 Nights
1 listings
4.2% of total
30+ Nights
10 listings
41.7% of total
Key Insights
- The most prevalent minimum stay requirement in Danvers is 30+ Nights, adopted by 41.7% of listings. This highlights the market's preference for longer commitments.
- A significant segment (41.7%) caters to monthly stays (30+ nights) in Danvers, pointing to opportunities in the extended-stay market.
Recommendations
- Align with the market by considering a 30+ Nights minimum stay, as 41.7% of Danvers hosts use this setting.
- If feasible, allowing 1-night stays, especially midweek or during low season, could capture last-minute bookings, as only 25% currently do.
- Explore offering discounts for stays of 30+ nights to attract the 41.7% of the market seeking extended stays.
- Adjust minimum nights based on seasonality – potentially shorter during low season and longer during peak demand periods in Danvers.
Danvers Airbnb Cancellation Policy Trends Analysis (2026)
Flexible
6 listings
25% of total
Moderate
3 listings
12.5% of total
Firm
11 listings
45.8% of total
Strict
4 listings
16.7% of total
Cancellation Policy Insights for Danvers
- The prevailing Airbnb cancellation policy trend in Danvers is Firm, used by 45.8% of listings.
- A majority (62.5%) of hosts in Danvers utilize Firm or Strict policies, indicating a market where hosts prioritize booking security.
Recommendations for Hosts
- Consider adopting a Firm policy to align with the 45.8% market standard in Danvers.
- Regularly review your cancellation policy against competitors and market demand shifts in Danvers.
Danvers STR Booking Lead Time Analysis (2026)
Average Booking Lead Time by Month
Booking Lead Time Insights for Danvers
- The overall average booking lead time for vacation rentals in Danvers is 65 days.
- Guests book furthest in advance for stays during October (average 125 days), likely coinciding with peak travel demand or local events.
- The shortest booking windows occur for stays in February (average 20 days), indicating more last-minute travel plans during this time.
- Seasonally, Fall (101 days avg.) sees the longest lead times, while Winter (37 days avg.) has the shortest, reflecting typical travel planning cycles.
Recommendations for Hosts
- Use the overall average lead time (65 days) as a baseline for your pricing and availability strategy in Danvers.
- For October stays, consider implementing length-of-stay discounts or slightly higher rates for bookings made less than 125 days out to capitalize on advance planning.
- Target marketing efforts for the Fall season well in advance (at least 101 days) to capture early planners.
- Monitor your own booking lead times against these Danvers averages to identify opportunities for dynamic pricing adjustments.
Popular & Essential Airbnb Amenities in Danvers (2026)
Amenity Prevalence
Amenity Insights for Danvers
- Essential amenities in Danvers that guests expect include: TV, Smoke alarm, Heating, Hot water, Wifi, Air conditioning, Bed linens, Free parking on premises. Lacking these (any) could significantly impact bookings.
- Popular amenities like Carbon monoxide alarm, Microwave are common but not universal. Offering these can provide a competitive edge.
Recommendations for Hosts
- Ensure your listing includes all essential amenities for Danvers: TV, Smoke alarm, Heating, Hot water, Wifi, Air conditioning, Bed linens, Free parking on premises.
- Prioritize adding missing essentials: Bed linens, Free parking on premises.
- Consider adding popular differentiators like Carbon monoxide alarm or Microwave to increase appeal.
- Highlight unique or less common amenities you offer (e.g., hot tub, dedicated workspace, EV charger) in your listing description and photos.
- Regularly check competitor amenities in Danvers to stay competitive.
Danvers Airbnb Guest Demographics & Profile Analysis (2026)
Guest Profile Summary for Danvers
- The typical guest profile for Airbnb in Danvers consists of primarily domestic travelers (95%), often arriving from nearby New York, typically belonging to the Post-2000s (Gen Z/Alpha) group (50%), primarily speaking English or Spanish.
- Domestic travelers account for 94.5% of guests.
- Key international markets include United States (94.5%) and United Kingdom (1.7%).
- Top languages spoken are English (71.2%) followed by Spanish (18%).
- A significant demographic segment is the Post-2000s (Gen Z/Alpha) group, representing 50% of guests.
Recommendations for Hosts
- Target domestic marketing efforts towards travelers from New York and Chicago.
- Tailor amenities and listing descriptions to appeal to the dominant Post-2000s (Gen Z/Alpha) demographic (e.g., highlight fast WiFi, smart home features, local guides).
- Highlight unique local experiences or amenities relevant to the primary guest profile.
- Consider seasonal promotions aligned with peak travel times for key origin markets.
Nearby Short-Term Rental Market Comparison
How does the Danvers Airbnb market stack up against its neighbors? Compare key performance metrics like average monthly revenue, ADR, and occupancy rates in surrounding areas to understand the broader regional STR landscape.
| Market | Active Properties | Monthly Revenue | Daily Rate | Avg. Occupancy |
|---|---|---|---|---|
| Nantucket | 539 | $7,748 | $1045.40 | 41% |
| Middletown | 395 | $5,781 | $589.01 | 45% |
| North Andover | 12 | $5,625 | $440.84 | 45% |
| Nahant | 13 | $5,564 | $602.44 | 42% |
| New Shoreham | 120 | $5,359 | $637.79 | 45% |
| South Berwick | 12 | $5,351 | $228.88 | 58% |
| Wellesley | 22 | $5,310 | $520.90 | 50% |
| Kennebunkport | 152 | $5,309 | $669.87 | 43% |
| Edgartown | 255 | $5,250 | $818.21 | 40% |
| Mattapoisett | 34 | $5,105 | $476.61 | 52% |