Brewster Airbnb Market Analysis 2026: Short Term Rental Data & Vacation Rental Statistics in Massachusetts, United States
Is Airbnb profitable in Brewster in 2026? Explore comprehensive Airbnb analytics for Brewster, Massachusetts, United States to uncover income potential. This 2026 STR market report for Brewster, based on AirROI data from February 2025 to January 2026, reveals key trends in the market of 260 active listings.
Whether you're considering an Airbnb investment in Brewster, optimizing your existing vacation rental, or exploring rental arbitrage opportunities, understanding the Brewster Airbnb data is crucial. Leveraging the low regulation environment is key to maximizing your short term rental income potential. Let's dive into the specifics.
Key Brewster Airbnb Performance Metrics Overview
Monthly Airbnb Revenue Variations & Income Potential in Brewster (2026)
Understanding the monthly revenue variations for Airbnb listings in Brewster is key to maximizing your short term rental income potential. Seasonality significantly impacts earnings. Our analysis, based on data from the past 12 months, shows that the peak revenue month for STRs in Brewster is typically July, while February often presents the lowest earnings, highlighting opportunities for strategic pricing adjustments during shoulder and low seasons. Explore the typical Airbnb income in Brewster across different performance tiers:
- Best-in-class properties (Top 10%) achieve $9,067+ monthly, often utilizing dynamic pricing and superior guest experiences.
- Strong performing properties (Top 25%) earn $6,062 or more, indicating effective management and desirable locations/amenities.
- Typical properties (Median) generate around $3,672 per month, representing the average market performance.
- Entry-level properties (Bottom 25%) see earnings around $1,945, often with potential for optimization.
Average Monthly Airbnb Earnings Trend in Brewster
Brewster Airbnb Occupancy Rate Trends (2026)
Maximize your bookings by understanding the Brewster STR occupancy trends. Seasonal demand shifts significantly influence how often properties are booked. Typically, Julysees the highest demand (peak season occupancy), while February experiences the lowest (low season). Effective strategies, like adjusting minimum stays or offering promotions, can boost occupancy during slower periods. Here's how different property tiers perform in Brewster:
- Best-in-class properties (Top 10%) achieve 74%+ occupancy, indicating high desirability and potentially optimized availability.
- Strong performing properties (Top 25%) maintain 55% or higher occupancy, suggesting good market fit and guest satisfaction.
- Typical properties (Median) have an occupancy rate around 36%.
- Entry-level properties (Bottom 25%) average 19% occupancy, potentially facing higher vacancy.
Average Monthly Occupancy Rate Trend in Brewster
Average Daily Rate (ADR) Airbnb Trends in Brewster (2026)
Effective short term rental pricing strategy in Brewster involves understanding monthly ADR fluctuations. The Average Daily Rate (ADR) for Airbnb in Brewster typically peaks in July and dips lowest during March. Leveraging Airbnb dynamic pricing tools or strategies based on this seasonality can significantly boost revenue. Here's a look at the typical nightly rates achieved:
- Best-in-class properties (Top 10%) command rates of $644+ per night, often due to premium features or locations.
- Strong performing properties (Top 25%) achieve nightly rates of $471 or more.
- Typical properties (Median) charge around $344 per night.
- Entry-level properties (Bottom 25%) earn around $235 per night.
Average Daily Rate (ADR) Trend by Month in Brewster
Get Live Brewster Market Intelligence 👇

Explore Real-time Analytics
Airbnb Seasonality Analysis & Trends in Brewster (2026)
Peak Season (July, August, June)
- Revenue averages $9,159 per month
- Occupancy rates average 62.2%
- Daily rates average $431
Shoulder Season
- Revenue averages $3,693 per month
- Occupancy maintains around 34.0%
- Daily rates hold near $392
Low Season (February, March, December)
- Revenue drops to average $2,191 per month
- Occupancy decreases to average 25.4%
- Daily rates adjust to average $367
Seasonality Insights for Brewster
- The Airbnb seasonality in Brewster shows highly seasonal trends requiring careful strategy. While the sections above show seasonal averages, it's also insightful to look at the extremes:
- During the high season, the absolute peak month showcases Brewster's highest earning potential, with monthly revenues capable of climbing to $10,432, occupancy reaching a high of 68.6%, and ADRs peaking at $438.
- Conversely, the slowest single month of the year, typically falling within the low season, marks the market's lowest point. In this month, revenue might dip to $1,792, occupancy could drop to 21.0%, and ADRs may adjust down to $348.
- Understanding both the seasonal averages and these monthly peaks and troughs in revenue, occupancy, and ADR is crucial for maximizing your Airbnb profit potential in Brewster.
Seasonal Strategies for Maximizing Profit
- Peak Season: Maximize revenue through premium pricing and potentially longer minimum stays. Ensure high availability.
- Low Season: Offer competitive pricing, special promotions (e.g., extended stay discounts), and flexible cancellation policies. Target off-season travelers like remote workers or budget-conscious guests.
- Shoulder Seasons: Implement dynamic pricing that balances peak and low rates. Target weekend travelers or specific events. Offer slightly more flexible terms than peak season.
- Regularly analyze your own performance against these Brewster seasonality benchmarks and adjust your pricing and availability strategy accordingly.
Best Areas for Airbnb Investment in Brewster (2026)
Exploring the top neighborhoods for short-term rentals in Brewster? This section highlights key areas, outlining why they are attractive for hosts and guests, along with notable local attractions. Consider these locations based on your target guest profile and investment strategy.
| Neighborhood / Area | Why Host Here? (Target Guests & Appeal) | Key Attractions & Landmarks |
|---|---|---|
| Paine's Creek Beach | A quiet, picturesque beach area perfect for families and those seeking a relaxing getaway. Ideal for visitors who appreciate natural beauty and outdoor activities. | Paine's Creek Beach, Cape Cod Bay, Nature trails, Kayaking, Fishing spots |
| Nickerson State Park | A popular destination for nature lovers with hiking trails, ponds, and camping facilities. Great for those who enjoy outdoor adventures and wildlife. | Hiking trails, Freshwater ponds, Camping, Picnic areas, Biking trails |
| Brewster Conservation Trust | A serene area with beautiful natural landscapes and walking trails. Attracts visitors looking for tranquility and nature conservation. | Walking trails, Wildlife viewing, Nature preserves, Scenic views |
| Olde Cape Cod | A charming historic district filled with beautiful old homes and Cape Cod architecture. Appeals to those interested in local history and culture. | Historic homes, Local shops, Dining options, Cultural events |
| Crosby Landing Beach | A family-friendly beach known for its calm waters and soft sand. Perfect for beach lovers and families with kids. | Crosby Landing Beach, Swimming, Sunbathing, Picnicking, Beachcombing |
| Brewster's Farmers Market | A local favorite for fresh produce, crafts, and community activities. Attracts those who enjoy local culture and farm-to-table experiences. | Fresh produce, Local crafts, Live music, Community events |
| Drummer Boy Park | A historical park that hosts various events and is a great place for picnics and outdoor activities. Appeals to families and history enthusiasts. | Historical exhibits, Playgrounds, Picnic areas, Community events |
| Brewster Historical Society | A great spot for learning about the local history and culture of Brewster. Ideal for visitors interested in heritage tourism. | Historical exhibits, Guided tours, Local artifacts, Community events |
Understanding Airbnb License Requirements & STR Laws in Brewster (2026)
While Brewster, Massachusetts, United States currently shows low STR regulations, specific Airbnb license requirements might still exist or change. Always verify the latest short term rental regulations and Airbnb license requirements directly with local government authorities for Brewster to ensure full compliance before hosting.
(Source: AirROI data, 2026, finding no licensed listings among those analyzed)
Top Performing Airbnb Properties in Brewster (2026)
Benchmark your potential! Explore examples of top-performing Airbnb properties in Brewsterbased on Trailing Twelve Month (TTM) revenue. Analyze their characteristics, revenue, occupancy rate, and ADR to understand what drives success in this market.
Entire Community!LUX house+4 TinyHomes! 1 nt min
Entire Place • 8 bedrooms

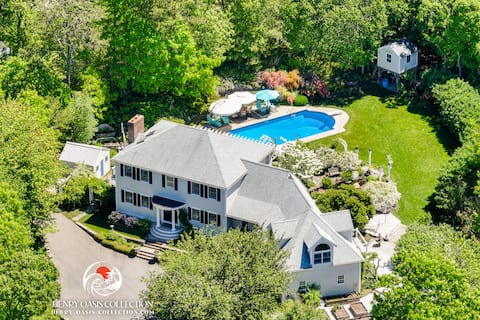
Spacious Home with Private In-Ground Pool!
Entire Place • 5 bedrooms
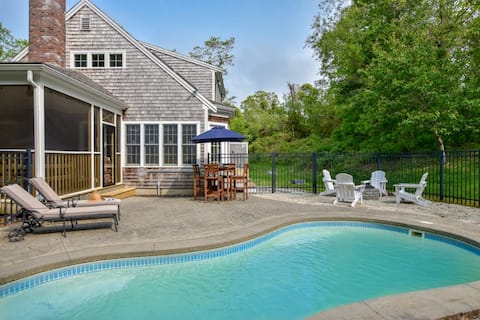
Cape Cod Oasis: pool, hot tub, firepit & grill!
Entire Place • 5 bedrooms

Large Luxury Cape Cod Escape!
Entire Place • 5 bedrooms

Modern Cape, Private Heated Pool, Beach, Golf
Entire Place • 4 bedrooms
In-Ground Plunge Pool Dog Friendly!
Entire Place • 3 bedrooms
Note: Performance varies based on location, size, amenities, seasonality, and management quality. Data reflects the past 12 months.
Top Performing Airbnb Hosts in Brewster (2026)
Learn from the best! This table showcases top-performing Airbnb hosts in Brewster based on the number of properties managed and estimated total revenue over the past year. Analyze their scale and performance metrics.
| Host Name | Properties | Grossing Revenue | Stay Reviews | Avg Rating |
|---|---|---|---|---|
| Del Mar Vacations | 24 | $1,883,469 | 657 | 4.75/5.0 |
| Micaran | 6 | $524,874 | 328 | 4.98/5.0 |
| Bruce | 4 | $189,038 | 221 | 4.89/5.0 |
| Merritt | 2 | $163,750 | 49 | 4.83/5.0 |
| Henry | 1 | $158,816 | 24 | 5.00/5.0 |
| Max | 3 | $148,958 | 70 | 5.00/5.0 |
| Tara | 1 | $146,404 | 22 | 4.91/5.0 |
| Walt | 1 | $139,346 | 42 | 4.98/5.0 |
| Jean | 2 | $135,202 | 190 | 4.96/5.0 |
| Robert Paul Vacations | 3 | $132,176 | 5 | Not Rated |
Analyzing the strategies of top hosts, such as their property selection, pricing, and guest communication, can offer valuable lessons for optimizing your own Airbnb operations in Brewster.
Dive Deeper: Advanced Brewster STR Market Data (2026)
Ready to unlock more insights? AirROI provides access to advanced metrics and comprehensive Airbnb data for Brewster. Explore detailed analytics beyond this report to refine your investment strategy, optimize pricing, and maximize your vacation rental profits.
Explore Advanced MetricsBrewster Short-Term Rental Market Composition (2026): Property & Room Types
Room Type Distribution
Property Type Distribution
Market Composition Insights for Brewster
- The Brewster Airbnb market composition is heavily skewed towards Entire Home/Apt listings, which make up 94.6% of the 260 active rentals. This indicates strong guest preference for privacy and space.
- Looking at the property type distribution in Brewster, House properties are the most common (75.4%), reflecting the local real estate landscape.
- Houses represent a significant 75.4% portion, catering likely to families or larger groups.
- Smaller segments like others, outdoor/unique (combined 4.2%) offer potential for unique stay experiences.
Brewster Airbnb Room Capacity Analysis (2026): Bedroom Distribution
Distribution of Listings by Number of Bedrooms
Room Capacity Insights for Brewster
- The dominant room capacity in Brewster is 3 bedrooms listings, making up 28.5% of the market. This suggests a strong demand for properties suitable for families or small groups.
- Together, 3 bedrooms and 2 bedrooms properties represent 53.1% of the active Airbnb listings in Brewster, indicating a high concentration in these sizes.
- A significant 53.5% of listings offer 3+ bedrooms, catering to larger groups and families seeking more space in Brewster.
Brewster Vacation Rental Guest Capacity Trends (2026)
Distribution of Listings by Guest Capacity
Guest Capacity Insights for Brewster
- The most common guest capacity trend in Brewster vacation rentals is listings accommodating 8+ guests (37.7%). This suggests the primary traveler segment is likely larger groups.
- Properties designed for 8+ guests and 6 guests dominate the Brewster STR market, accounting for 58.1% of listings.
- 61.9% of properties accommodate 6+ guests, serving the market segment for larger families or group travel in Brewster.
- On average, properties in Brewster are equipped to host 5.7 guests.
Brewster Airbnb Booking Patterns (2026): Available vs. Booked Days
Available Days Distribution
Booked Days Distribution
Booking Pattern Insights for Brewster
- The most common availability pattern in Brewster falls within the 271-366 days range, representing 47.7% of listings. This suggests many properties have significant open periods on their calendars.
- Approximately 89.6% of listings show high availability (181+ days open annually), indicating potential for increased bookings or specific owner usage patterns.
- For booked days, the 91-180 days range is most frequent in Brewster (40.4%), reflecting common guest stay durations or potential owner blocking patterns.
- A notable 12.7% of properties secure long booking periods (181+ days booked per year), highlighting successful long-term rental strategies or significant owner usage.
Brewster Airbnb Minimum Stay Requirements Analysis
Distribution of Listings by Minimum Night Requirement
1 Night
11 listings
4.2% of total
2 Nights
33 listings
12.7% of total
3 Nights
24 listings
9.2% of total
4-6 Nights
37 listings
14.2% of total
7-29 Nights
15 listings
5.8% of total
30+ Nights
140 listings
53.8% of total
Key Insights
- The most prevalent minimum stay requirement in Brewster is 30+ Nights, adopted by 53.8% of listings. This highlights the market's preference for longer commitments.
- Very short stays (1-2 nights) are less common (16.9%), suggesting hosts prefer slightly longer bookings to optimize turnover.
- A significant segment (53.8%) caters to monthly stays (30+ nights) in Brewster, pointing to opportunities in the extended-stay market.
Recommendations
- Align with the market by considering a 30+ Nights minimum stay, as 53.8% of Brewster hosts use this setting.
- If feasible, allowing 1-night stays, especially midweek or during low season, could capture last-minute bookings, as only 4.2% currently do.
- Explore offering discounts for stays of 30+ nights to attract the 53.8% of the market seeking extended stays.
- Adjust minimum nights based on seasonality – potentially shorter during low season and longer during peak demand periods in Brewster.
Brewster Airbnb Cancellation Policy Trends Analysis (2026)
Super Strict 30 Days
10 listings
3.8% of total
Super Strict 60 Days
6 listings
2.3% of total
Limited
1 listings
0.4% of total
Flexible
11 listings
4.2% of total
Moderate
43 listings
16.5% of total
Firm
123 listings
47.3% of total
Strict
66 listings
25.4% of total
Cancellation Policy Insights for Brewster
- The prevailing Airbnb cancellation policy trend in Brewster is Firm, used by 47.3% of listings.
- A majority (72.7%) of hosts in Brewster utilize Firm or Strict policies, indicating a market where hosts prioritize booking security.
Recommendations for Hosts
- Consider adopting a Firm policy to align with the 47.3% market standard in Brewster.
- Regularly review your cancellation policy against competitors and market demand shifts in Brewster.
Brewster STR Booking Lead Time Analysis (2026)
Average Booking Lead Time by Month
Booking Lead Time Insights for Brewster
- The overall average booking lead time for vacation rentals in Brewster is 77 days.
- Guests book furthest in advance for stays during July (average 118 days), likely coinciding with peak travel demand or local events.
- The shortest booking windows occur for stays in December (average 35 days), indicating more last-minute travel plans during this time.
- Seasonally, Summer (108 days avg.) sees the longest lead times, while Winter (39 days avg.) has the shortest, reflecting typical travel planning cycles.
Recommendations for Hosts
- Use the overall average lead time (77 days) as a baseline for your pricing and availability strategy in Brewster.
- For July stays, consider implementing length-of-stay discounts or slightly higher rates for bookings made less than 118 days out to capitalize on advance planning.
- Target marketing efforts for the Summer season well in advance (at least 108 days) to capture early planners.
- Monitor your own booking lead times against these Brewster averages to identify opportunities for dynamic pricing adjustments.
Popular & Essential Airbnb Amenities in Brewster (2026)
Amenity Prevalence
Amenity Insights for Brewster
- Essential amenities in Brewster that guests expect include: Smoke alarm, Free parking on premises, Wifi, Hot water, Carbon monoxide alarm, TV. Lacking these (any) could significantly impact bookings.
- Popular amenities like Coffee maker, Dishes and silverware, Air conditioning are common but not universal. Offering these can provide a competitive edge.
Recommendations for Hosts
- Ensure your listing includes all essential amenities for Brewster: Smoke alarm, Free parking on premises, Wifi, Hot water, Carbon monoxide alarm, TV.
- Prioritize adding missing essentials: Smoke alarm, Free parking on premises, Wifi, Hot water, Carbon monoxide alarm, TV.
- Consider adding popular differentiators like Coffee maker or Dishes and silverware to increase appeal.
- Highlight unique or less common amenities you offer (e.g., hot tub, dedicated workspace, EV charger) in your listing description and photos.
- Regularly check competitor amenities in Brewster to stay competitive.
Brewster Airbnb Guest Demographics & Profile Analysis (2026)
Guest Profile Summary for Brewster
- The typical guest profile for Airbnb in Brewster consists of primarily domestic travelers (93%), often arriving from nearby Boston, typically belonging to the Post-2000s (Gen Z/Alpha) group (50%), primarily speaking English or Spanish.
- Domestic travelers account for 93.3% of guests.
- Key international markets include United States (93.3%) and United Kingdom (1.8%).
- Top languages spoken are English (67.4%) followed by Spanish (10%).
- A significant demographic segment is the Post-2000s (Gen Z/Alpha) group, representing 50% of guests.
Recommendations for Hosts
- Target domestic marketing efforts towards travelers from Boston and New York.
- Tailor amenities and listing descriptions to appeal to the dominant Post-2000s (Gen Z/Alpha) demographic (e.g., highlight fast WiFi, smart home features, local guides).
- Highlight unique local experiences or amenities relevant to the primary guest profile.
- Consider seasonal promotions aligned with peak travel times for key origin markets.
Nearby Short-Term Rental Market Comparison
How does the Brewster Airbnb market stack up against its neighbors? Compare key performance metrics like average monthly revenue, ADR, and occupancy rates in surrounding areas to understand the broader regional STR landscape.
| Market | Active Properties | Monthly Revenue | Daily Rate | Avg. Occupancy |
|---|---|---|---|---|
| Nantucket | 539 | $7,748 | $1045.40 | 41% |
| Middletown | 395 | $5,781 | $589.01 | 45% |
| North Andover | 12 | $5,625 | $440.84 | 45% |
| Nahant | 13 | $5,564 | $602.44 | 42% |
| New Shoreham | 120 | $5,359 | $637.79 | 45% |
| Wellesley | 22 | $5,310 | $520.90 | 50% |
| Edgartown | 255 | $5,250 | $818.21 | 40% |
| Mattapoisett | 34 | $5,105 | $476.61 | 52% |
| Amherst | 10 | $5,003 | $366.01 | 44% |
| Chatham | 370 | $4,755 | $532.54 | 43% |