Beverly Airbnb Market Analysis 2026: Short Term Rental Data & Vacation Rental Statistics in Massachusetts, United States
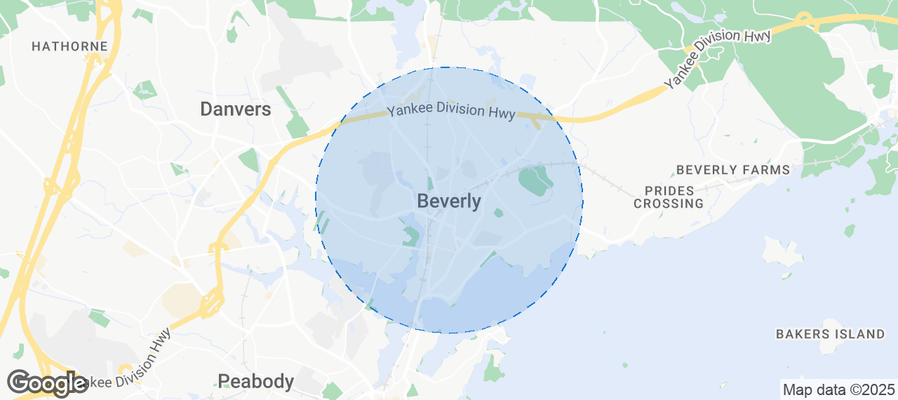
Is Airbnb profitable in Beverly in 2026? Explore comprehensive Airbnb analytics for Beverly, Massachusetts, United States to uncover income potential. This 2026 STR market report for Beverly, based on AirROI data from February 2025 to January 2026, reveals key trends in the niche market of 87 active listings.
Whether you're considering an Airbnb investment in Beverly, optimizing your existing vacation rental, or exploring rental arbitrage opportunities, understanding the Beverly Airbnb data is crucial. Leveraging the low regulation environment is key to maximizing your short term rental income potential. Let's dive into the specifics.
Key Beverly Airbnb Performance Metrics Overview
Monthly Airbnb Revenue Variations & Income Potential in Beverly (2026)
Understanding the monthly revenue variations for Airbnb listings in Beverly is key to maximizing your short term rental income potential. Seasonality significantly impacts earnings. Our analysis, based on data from the past 12 months, shows that the peak revenue month for STRs in Beverly is typically October, while January often presents the lowest earnings, highlighting opportunities for strategic pricing adjustments during shoulder and low seasons. Explore the typical Airbnb income in Beverly across different performance tiers:
- Best-in-class properties (Top 10%) achieve $7,669+ monthly, often utilizing dynamic pricing and superior guest experiences.
- Strong performing properties (Top 25%) earn $5,295 or more, indicating effective management and desirable locations/amenities.
- Typical properties (Median) generate around $3,672 per month, representing the average market performance.
- Entry-level properties (Bottom 25%) see earnings around $2,460, often with potential for optimization.
Average Monthly Airbnb Earnings Trend in Beverly
Beverly Airbnb Occupancy Rate Trends (2026)
Maximize your bookings by understanding the Beverly STR occupancy trends. Seasonal demand shifts significantly influence how often properties are booked. Typically, Octobersees the highest demand (peak season occupancy), while January experiences the lowest (low season). Effective strategies, like adjusting minimum stays or offering promotions, can boost occupancy during slower periods. Here's how different property tiers perform in Beverly:
- Best-in-class properties (Top 10%) achieve 82%+ occupancy, indicating high desirability and potentially optimized availability.
- Strong performing properties (Top 25%) maintain 70% or higher occupancy, suggesting good market fit and guest satisfaction.
- Typical properties (Median) have an occupancy rate around 51%.
- Entry-level properties (Bottom 25%) average 31% occupancy, potentially facing higher vacancy.
Average Monthly Occupancy Rate Trend in Beverly
Average Daily Rate (ADR) Airbnb Trends in Beverly (2026)
Effective short term rental pricing strategy in Beverly involves understanding monthly ADR fluctuations. The Average Daily Rate (ADR) for Airbnb in Beverly typically peaks in October and dips lowest during February. Leveraging Airbnb dynamic pricing tools or strategies based on this seasonality can significantly boost revenue. Here's a look at the typical nightly rates achieved:
- Best-in-class properties (Top 10%) command rates of $464+ per night, often due to premium features or locations.
- Strong performing properties (Top 25%) achieve nightly rates of $304 or more.
- Typical properties (Median) charge around $226 per night.
- Entry-level properties (Bottom 25%) earn around $179 per night.
Average Daily Rate (ADR) Trend by Month in Beverly
Get Live Beverly Market Intelligence 👇
Explore Real-time Analytics
Airbnb Seasonality Analysis & Trends in Beverly (2026)
Peak Season (October, September, August)
- Revenue averages $7,403 per month
- Occupancy rates average 66.1%
- Daily rates average $353
Shoulder Season
- Revenue averages $3,811 per month
- Occupancy maintains around 47.7%
- Daily rates hold near $297
Low Season (January, February, March)
- Revenue drops to average $2,112 per month
- Occupancy decreases to average 39.4%
- Daily rates adjust to average $270
Seasonality Insights for Beverly
- The Airbnb seasonality in Beverly shows highly seasonal trends requiring careful strategy. While the sections above show seasonal averages, it's also insightful to look at the extremes:
- During the high season, the absolute peak month showcases Beverly's highest earning potential, with monthly revenues capable of climbing to $9,851, occupancy reaching a high of 73.5%, and ADRs peaking at $397.
- Conversely, the slowest single month of the year, typically falling within the low season, marks the market's lowest point. In this month, revenue might dip to $1,840, occupancy could drop to 31.5%, and ADRs may adjust down to $267.
- Understanding both the seasonal averages and these monthly peaks and troughs in revenue, occupancy, and ADR is crucial for maximizing your Airbnb profit potential in Beverly.
Seasonal Strategies for Maximizing Profit
- Peak Season: Maximize revenue through premium pricing and potentially longer minimum stays. Ensure high availability.
- Low Season: Offer competitive pricing, special promotions (e.g., extended stay discounts), and flexible cancellation policies. Target off-season travelers like remote workers or budget-conscious guests.
- Shoulder Seasons: Implement dynamic pricing that balances peak and low rates. Target weekend travelers or specific events. Offer slightly more flexible terms than peak season.
- Regularly analyze your own performance against these Beverly seasonality benchmarks and adjust your pricing and availability strategy accordingly.
Best Areas for Airbnb Investment in Beverly (2026)
Exploring the top neighborhoods for short-term rentals in Beverly? This section highlights key areas, outlining why they are attractive for hosts and guests, along with notable local attractions. Consider these locations based on your target guest profile and investment strategy.
| Neighborhood / Area | Why Host Here? (Target Guests & Appeal) | Key Attractions & Landmarks |
|---|---|---|
| Beverly Farms | Beverly Farms is known for its charming coastal views and historic homes, offering a serene environment perfect for vacationers seeking relaxation and picturesque scenery. | Beverly Farms Beach, Cove Beach, Beverly Harbor, The Cabot, Balleyview Park |
| Rogers Park | Rogers Park features a vibrant community with family-friendly environments, parks, and beaches. It's ideal for families and groups looking for recreational activities. | Rogers Park, Lake Beverly, Beverly Recreation Department, Local dining spots, Ocean Ave Beach Access |
| Beverly City Center | The City Center offers a blend of urban convenience with access to shops, restaurants, and cultural venues. It attracts visitors who prefer a more metropolitan experience. | Beverly Arts District, Local Shops, Museums, Beverly Common, Public Transportation Access |
| Mansfield Park | Mansfield Park is known for its spacious green areas and open parks, making it popular with families and those looking to enjoy outdoor activities. | Mansfield Park, Beverly Farms Coastal Trail, Dog Parks, Picnic Areas, Walking Trails |
| Salem | Just a short drive or train ride away, Salem is famous for its witch trial history and offers additional attractions, expanding the potential guest market. | Salem Witch Museum, The House of the Seven Gables, Salem Maritime National Historic Site, Derby Wharf, Historical Tours |
| Lynch Park | Lynch Park features gardens and waterfront views, making it a picturesque spot that attracts couples and nature lovers. | Lynch Park Beach, Beverly Yacht Club, Gardens and Green Spaces, Walking Trails, Picnic Areas |
| Endicott College | Hosting near Endicott College caters to students, visiting families, and educational events, providing a steady stream of potential short-term renters. | Endicott College Campus, Cultural Events, Sports Facilities, Student Activities, Nearby Beaches |
| Beverly Shores | Beverly Shores is a beautiful residential area known for its beach access and community feel, ideal for guests looking for a home-like stay. | Beverly Shores Beach, Cohasset Cove, Family-friendly parks, Local dining and shops, Seaside Trails |
Understanding Airbnb License Requirements & STR Laws in Beverly (2026)
While Beverly, Massachusetts, United States currently shows low STR regulations, specific Airbnb license requirements might still exist or change. Always verify the latest short term rental regulations and Airbnb license requirements directly with local government authorities for Beverly to ensure full compliance before hosting.
(Source: AirROI data, 2026, based on 1% licensed listings)
Top Performing Airbnb Properties in Beverly (2026)
Benchmark your potential! Explore examples of top-performing Airbnb properties in Beverlybased on Trailing Twelve Month (TTM) revenue. Analyze their characteristics, revenue, occupancy rate, and ADR to understand what drives success in this market.
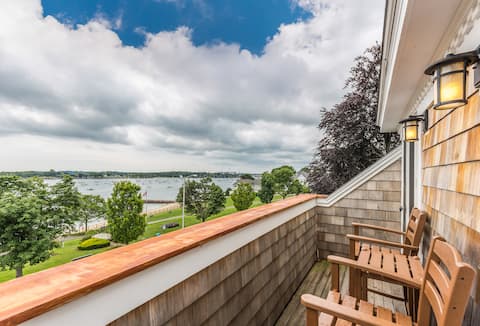
Beverly/Salem oceanfront unit
Entire Place • 1 bedroom

5BR Minutes to Salem|Historic Downtown Beverly
Entire Place • 5 bedrooms
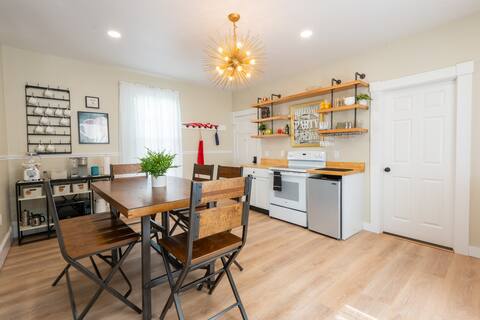
*NEW Spacious Reatreat|3BR|Salem+Beverly|Parking
Entire Place • 3 bedrooms

Bright, comfortable home close to train + Salem
Entire Place • 4 bedrooms

Downtown Beverly| Water view| 2 BR| Steps 2 beach
Entire Place • 2 bedrooms

Stunning Design|Fireplace|Custom Desk|Balcony
Entire Place • 1 bedroom
Note: Performance varies based on location, size, amenities, seasonality, and management quality. Data reflects the past 12 months.
Top Performing Airbnb Hosts in Beverly (2026)
Learn from the best! This table showcases top-performing Airbnb hosts in Beverly based on the number of properties managed and estimated total revenue over the past year. Analyze their scale and performance metrics.
| Host Name | Properties | Grossing Revenue | Stay Reviews | Avg Rating |
|---|---|---|---|---|
| Christian | 8 | $336,630 | 808 | 4.76/5.0 |
| Michael | 9 | $270,301 | 734 | 4.89/5.0 |
| Kathleen | 2 | $242,546 | 142 | 4.87/5.0 |
| Rachel | 3 | $240,082 | 220 | 4.93/5.0 |
| Darryl | 3 | $231,597 | 186 | 4.97/5.0 |
| Shila | 3 | $206,685 | 354 | 4.97/5.0 |
| Erin | 3 | $125,326 | 418 | 4.82/5.0 |
| Atlantic Vacation Homes | 2 | $119,843 | 29 | 4.96/5.0 |
| Matty | 2 | $118,340 | 108 | 4.95/5.0 |
| Susan | 3 | $89,627 | 288 | 4.92/5.0 |
Analyzing the strategies of top hosts, such as their property selection, pricing, and guest communication, can offer valuable lessons for optimizing your own Airbnb operations in Beverly.
Dive Deeper: Advanced Beverly STR Market Data (2026)
Ready to unlock more insights? AirROI provides access to advanced metrics and comprehensive Airbnb data for Beverly. Explore detailed analytics beyond this report to refine your investment strategy, optimize pricing, and maximize your vacation rental profits.
Explore Advanced MetricsBeverly Short-Term Rental Market Composition (2026): Property & Room Types
Room Type Distribution
Property Type Distribution
Market Composition Insights for Beverly
- The Beverly Airbnb market composition is heavily skewed towards Entire Home/Apt listings, which make up 90.8% of the 87 active rentals. This indicates strong guest preference for privacy and space.
- Looking at the property type distribution in Beverly, Apartment/Condo properties are the most common (65.5%), reflecting the local real estate landscape.
- Houses represent a significant 18.4% portion, catering likely to families or larger groups.
- The presence of 5.7% Hotel/Boutique listings indicates integration with traditional hospitality.
Beverly Airbnb Room Capacity Analysis (2026): Bedroom Distribution
Distribution of Listings by Number of Bedrooms
Room Capacity Insights for Beverly
- The dominant room capacity in Beverly is 1 bedroom listings, making up 35.6% of the market. This suggests a strong demand for properties suitable for couples or solo travelers.
- Together, 1 bedroom and 2 bedrooms properties represent 70.1% of the active Airbnb listings in Beverly, indicating a high concentration in these sizes.
- A significant 21.8% of listings offer 3+ bedrooms, catering to larger groups and families seeking more space in Beverly.
Beverly Vacation Rental Guest Capacity Trends (2026)
Distribution of Listings by Guest Capacity
Guest Capacity Insights for Beverly
- The most common guest capacity trend in Beverly vacation rentals is listings accommodating 2 guests (24.1%). This suggests the primary traveler segment is likely couples or solo travelers.
- Properties designed for 2 guests and 6 guests dominate the Beverly STR market, accounting for 45.9% of listings.
- 34.4% of properties accommodate 6+ guests, serving the market segment for larger families or group travel in Beverly.
- On average, properties in Beverly are equipped to host 4.2 guests.
Beverly Airbnb Booking Patterns (2026): Available vs. Booked Days
Available Days Distribution
Booked Days Distribution
Booking Pattern Insights for Beverly
- The most common availability pattern in Beverly falls within the 181-270 days range, representing 50.6% of listings. This suggests many properties have significant open periods on their calendars.
- Approximately 69.0% of listings show high availability (181+ days open annually), indicating potential for increased bookings or specific owner usage patterns.
- For booked days, the 91-180 days range is most frequent in Beverly (51.7%), reflecting common guest stay durations or potential owner blocking patterns.
- A notable 31.0% of properties secure long booking periods (181+ days booked per year), highlighting successful long-term rental strategies or significant owner usage.
Beverly Airbnb Minimum Stay Requirements Analysis
Distribution of Listings by Minimum Night Requirement
1 Night
20 listings
23% of total
2 Nights
18 listings
20.7% of total
3 Nights
3 listings
3.4% of total
4-6 Nights
2 listings
2.3% of total
7-29 Nights
1 listings
1.1% of total
30+ Nights
43 listings
49.4% of total
Key Insights
- The most prevalent minimum stay requirement in Beverly is 30+ Nights, adopted by 49.4% of listings. This highlights the market's preference for longer commitments.
- A significant segment (49.4%) caters to monthly stays (30+ nights) in Beverly, pointing to opportunities in the extended-stay market.
Recommendations
- Align with the market by considering a 30+ Nights minimum stay, as 49.4% of Beverly hosts use this setting.
- If feasible, allowing 1-night stays, especially midweek or during low season, could capture last-minute bookings, as only 23% currently do.
- Explore offering discounts for stays of 30+ nights to attract the 49.4% of the market seeking extended stays.
- Adjust minimum nights based on seasonality – potentially shorter during low season and longer during peak demand periods in Beverly.
Beverly Airbnb Cancellation Policy Trends Analysis (2026)
Super Strict 30 Days
3 listings
3.4% of total
Limited
1 listings
1.1% of total
Flexible
7 listings
8% of total
Moderate
25 listings
28.7% of total
Firm
40 listings
46% of total
Strict
11 listings
12.6% of total
Cancellation Policy Insights for Beverly
- The prevailing Airbnb cancellation policy trend in Beverly is Firm, used by 46% of listings.
- A majority (58.6%) of hosts in Beverly utilize Firm or Strict policies, indicating a market where hosts prioritize booking security.
Recommendations for Hosts
- Consider adopting a Firm policy to align with the 46% market standard in Beverly.
- Using a Strict policy might deter some guests, as only 12.6% of listings use it. Evaluate if potential revenue protection outweighs possible lower booking rates.
- Regularly review your cancellation policy against competitors and market demand shifts in Beverly.
Beverly STR Booking Lead Time Analysis (2026)
Average Booking Lead Time by Month
Booking Lead Time Insights for Beverly
- The overall average booking lead time for vacation rentals in Beverly is 67 days.
- Guests book furthest in advance for stays during October (average 120 days), likely coinciding with peak travel demand or local events.
- The shortest booking windows occur for stays in February (average 22 days), indicating more last-minute travel plans during this time.
- Seasonally, Fall (91 days avg.) sees the longest lead times, while Winter (29 days avg.) has the shortest, reflecting typical travel planning cycles.
Recommendations for Hosts
- Use the overall average lead time (67 days) as a baseline for your pricing and availability strategy in Beverly.
- For October stays, consider implementing length-of-stay discounts or slightly higher rates for bookings made less than 120 days out to capitalize on advance planning.
- Target marketing efforts for the Fall season well in advance (at least 91 days) to capture early planners.
- Monitor your own booking lead times against these Beverly averages to identify opportunities for dynamic pricing adjustments.
Popular & Essential Airbnb Amenities in Beverly (2026)
Amenity Prevalence
Amenity Insights for Beverly
- Essential amenities in Beverly that guests expect include: Carbon monoxide alarm, Smoke alarm, Heating, Wifi, Air conditioning, TV, Hangers. Lacking these (any) could significantly impact bookings.
- Popular amenities like Hot water, Hair dryer, Bed linens are common but not universal. Offering these can provide a competitive edge.
Recommendations for Hosts
- Ensure your listing includes all essential amenities for Beverly: Carbon monoxide alarm, Smoke alarm, Heating, Wifi, Air conditioning, TV, Hangers.
- Prioritize adding missing essentials: Heating, Wifi, Air conditioning, TV, Hangers.
- Consider adding popular differentiators like Hot water or Hair dryer to increase appeal.
- Highlight unique or less common amenities you offer (e.g., hot tub, dedicated workspace, EV charger) in your listing description and photos.
- Regularly check competitor amenities in Beverly to stay competitive.
Beverly Airbnb Guest Demographics & Profile Analysis (2026)
Guest Profile Summary for Beverly
- The typical guest profile for Airbnb in Beverly consists of primarily domestic travelers (93%), often arriving from nearby New York, typically belonging to the Post-2000s (Gen Z/Alpha) group (50%), primarily speaking English or Spanish.
- Domestic travelers account for 93.4% of guests.
- Key international markets include United States (93.4%) and Canada (2.2%).
- Top languages spoken are English (70.4%) followed by Spanish (12.5%).
- A significant demographic segment is the Post-2000s (Gen Z/Alpha) group, representing 50% of guests.
Recommendations for Hosts
- Target domestic marketing efforts towards travelers from New York and Boston.
- Tailor amenities and listing descriptions to appeal to the dominant Post-2000s (Gen Z/Alpha) demographic (e.g., highlight fast WiFi, smart home features, local guides).
- Highlight unique local experiences or amenities relevant to the primary guest profile.
- Consider seasonal promotions aligned with peak travel times for key origin markets.
Nearby Short-Term Rental Market Comparison
How does the Beverly Airbnb market stack up against its neighbors? Compare key performance metrics like average monthly revenue, ADR, and occupancy rates in surrounding areas to understand the broader regional STR landscape.
| Market | Active Properties | Monthly Revenue | Daily Rate | Avg. Occupancy |
|---|---|---|---|---|
| Nantucket | 539 | $7,748 | $1045.40 | 41% |
| Middletown | 395 | $5,781 | $589.01 | 45% |
| North Andover | 12 | $5,625 | $440.84 | 45% |
| Nahant | 13 | $5,564 | $602.44 | 42% |
| New Shoreham | 120 | $5,359 | $637.79 | 45% |
| South Berwick | 12 | $5,351 | $228.88 | 58% |
| Wellesley | 22 | $5,310 | $520.90 | 50% |
| Kennebunkport | 152 | $5,309 | $669.87 | 43% |
| Edgartown | 255 | $5,250 | $818.21 | 40% |
| Mattapoisett | 34 | $5,105 | $476.61 | 52% |