Barnstable Airbnb Market Analysis 2026: Short Term Rental Data & Vacation Rental Statistics in Massachusetts, United States
Is Airbnb profitable in Barnstable in 2026? Explore comprehensive Airbnb analytics for Barnstable, Massachusetts, United States to uncover income potential. This 2026 STR market report for Barnstable, based on AirROI data from February 2025 to January 2026, reveals key trends in the market of 607 active listings.
Whether you're considering an Airbnb investment in Barnstable, optimizing your existing vacation rental, or exploring rental arbitrage opportunities, understanding the Barnstable Airbnb data is crucial. Leveraging the low regulation environment is key to maximizing your short term rental income potential. Let's dive into the specifics.
Key Barnstable Airbnb Performance Metrics Overview
Monthly Airbnb Revenue Variations & Income Potential in Barnstable (2026)
Understanding the monthly revenue variations for Airbnb listings in Barnstable is key to maximizing your short term rental income potential. Seasonality significantly impacts earnings. Our analysis, based on data from the past 12 months, shows that the peak revenue month for STRs in Barnstable is typically July, while February often presents the lowest earnings, highlighting opportunities for strategic pricing adjustments during shoulder and low seasons. Explore the typical Airbnb income in Barnstable across different performance tiers:
- Best-in-class properties (Top 10%) achieve $10,376+ monthly, often utilizing dynamic pricing and superior guest experiences.
- Strong performing properties (Top 25%) earn $6,425 or more, indicating effective management and desirable locations/amenities.
- Typical properties (Median) generate around $3,837 per month, representing the average market performance.
- Entry-level properties (Bottom 25%) see earnings around $2,084, often with potential for optimization.
Average Monthly Airbnb Earnings Trend in Barnstable
Barnstable Airbnb Occupancy Rate Trends (2026)
Maximize your bookings by understanding the Barnstable STR occupancy trends. Seasonal demand shifts significantly influence how often properties are booked. Typically, Julysees the highest demand (peak season occupancy), while January experiences the lowest (low season). Effective strategies, like adjusting minimum stays or offering promotions, can boost occupancy during slower periods. Here's how different property tiers perform in Barnstable:
- Best-in-class properties (Top 10%) achieve 72%+ occupancy, indicating high desirability and potentially optimized availability.
- Strong performing properties (Top 25%) maintain 53% or higher occupancy, suggesting good market fit and guest satisfaction.
- Typical properties (Median) have an occupancy rate around 35%.
- Entry-level properties (Bottom 25%) average 19% occupancy, potentially facing higher vacancy.
Average Monthly Occupancy Rate Trend in Barnstable
Average Daily Rate (ADR) Airbnb Trends in Barnstable (2026)
Effective short term rental pricing strategy in Barnstable involves understanding monthly ADR fluctuations. The Average Daily Rate (ADR) for Airbnb in Barnstable typically peaks in July and dips lowest during February. Leveraging Airbnb dynamic pricing tools or strategies based on this seasonality can significantly boost revenue. Here's a look at the typical nightly rates achieved:
- Best-in-class properties (Top 10%) command rates of $832+ per night, often due to premium features or locations.
- Strong performing properties (Top 25%) achieve nightly rates of $547 or more.
- Typical properties (Median) charge around $368 per night.
- Entry-level properties (Bottom 25%) earn around $253 per night.
Average Daily Rate (ADR) Trend by Month in Barnstable
Get Live Barnstable Market Intelligence 👇

Explore Real-time Analytics
Airbnb Seasonality Analysis & Trends in Barnstable (2026)
Peak Season (July, August, June)
- Revenue averages $9,685 per month
- Occupancy rates average 60.1%
- Daily rates average $498
Shoulder Season
- Revenue averages $4,076 per month
- Occupancy maintains around 33.5%
- Daily rates hold near $454
Low Season (January, February, March)
- Revenue drops to average $2,382 per month
- Occupancy decreases to average 24.2%
- Daily rates adjust to average $426
Seasonality Insights for Barnstable
- The Airbnb seasonality in Barnstable shows highly seasonal trends requiring careful strategy. While the sections above show seasonal averages, it's also insightful to look at the extremes:
- During the high season, the absolute peak month showcases Barnstable's highest earning potential, with monthly revenues capable of climbing to $11,254, occupancy reaching a high of 66.7%, and ADRs peaking at $506.
- Conversely, the slowest single month of the year, typically falling within the low season, marks the market's lowest point. In this month, revenue might dip to $2,113, occupancy could drop to 19.4%, and ADRs may adjust down to $407.
- Understanding both the seasonal averages and these monthly peaks and troughs in revenue, occupancy, and ADR is crucial for maximizing your Airbnb profit potential in Barnstable.
Seasonal Strategies for Maximizing Profit
- Peak Season: Maximize revenue through premium pricing and potentially longer minimum stays. Ensure high availability.
- Low Season: Offer competitive pricing, special promotions (e.g., extended stay discounts), and flexible cancellation policies. Target off-season travelers like remote workers or budget-conscious guests.
- Shoulder Seasons: Implement dynamic pricing that balances peak and low rates. Target weekend travelers or specific events. Offer slightly more flexible terms than peak season.
- Regularly analyze your own performance against these Barnstable seasonality benchmarks and adjust your pricing and availability strategy accordingly.
Best Areas for Airbnb Investment in Barnstable (2026)
Exploring the top neighborhoods for short-term rentals in Barnstable? This section highlights key areas, outlining why they are attractive for hosts and guests, along with notable local attractions. Consider these locations based on your target guest profile and investment strategy.
| Neighborhood / Area | Why Host Here? (Target Guests & Appeal) | Key Attractions & Landmarks |
|---|---|---|
| Hyannis | Hyannis is the largest village in Barnstable, featuring a vibrant harbor and a plethora of dining and shopping options. It serves as a gateway to the lovely beaches of Cape Cod and offers attractions that draw visitors year-round. | Cape Cod Mall, John F. Kennedy Hyannis Museum, Hyannis Harbor, Kalmus Beach, Barnstable Village |
| Osterville | Osterville is an affluent and picturesque village known for its charming Main Street and beautiful beaches. It attracts families and travelers looking for a tranquil getaway with upscale accommodations and dining. | Dowses Beach, Osterville Village Library, Osterville Fish Company, North Bay Breach, Seven Seas Beach |
| Centerville | Centerville is a serene, residential area with proximity to beautiful beaches and Cape Cod's scenic landscapes. It offers a mix of family-friendly activities and relaxation, making it appealing for vacationers and families. | Craigville Beach, Cape Cod Carousel, Centerville Historical Museum, Four Seas Ice Cream, Prince Cove Marina |
| Barnstable Village | This historic village is rich in colonial history and has charming shops, restaurants, and waterfront views. It is particularly attractive for visitors interested in local culture and history. | Barnstable Old Gaol, The Barnstable Village Historic District, Miller Beach, Barnstable Village Gallery, Centrally located for exploring Cape Cod |
| Yarmouth Port | Yarmouth Port, known for its scenic views and historic charm, is perfect for those looking to enjoy a peaceful environment with easy access to Cape Cod's natural beauty. | JFK Memorial, Natural Resources Trust of Barnstable, Grays Beach, Parker River Wildlife Refuge, Whydah Pirate Museum |
| Cotuit | Cotuit is an idyllic village that boasts classic Cape Cod charm, with a laid-back atmosphere and beautiful waterfront access. It attracts those seeking a more low-key, authentic Cape experience. | Cotuit Kettleers Baseball, Cotuit Library, Ropes Beach, Eel River, Historical Society of Cotuit |
| Sandy Neck | Sandy Neck is known for its stunning beaches and natural beauty. It's a hotspot for outdoor activities and attracts nature lovers and families in search of adventure. | Sandy Neck Beach, Cape Cod National Seashore, Off-road vehicle access areas, Beautiful sunset spots, Nature trails and dunes |
| Waquoit | Waquoit is a hidden gem in Mashpee that offers beautiful beaches and a peaceful atmosphere. It's ideal for travelers looking to experience the beauty of Cape Cod without the large crowds. | Waquoit Bay National Estuarine Research Reserve, South Cape Beach, Waquoit Village, Cove Burying Ground, Nature trails |
Understanding Airbnb License Requirements & STR Laws in Barnstable (2026)
While Barnstable, Massachusetts, United States currently shows low STR regulations, specific Airbnb license requirements might still exist or change. Always verify the latest short term rental regulations and Airbnb license requirements directly with local government authorities for Barnstable to ensure full compliance before hosting.
(Source: AirROI data, 2026, finding no licensed listings among those analyzed)
Top Performing Airbnb Properties in Barnstable (2026)
Benchmark your potential! Explore examples of top-performing Airbnb properties in Barnstablebased on Trailing Twelve Month (TTM) revenue. Analyze their characteristics, revenue, occupancy rate, and ADR to understand what drives success in this market.

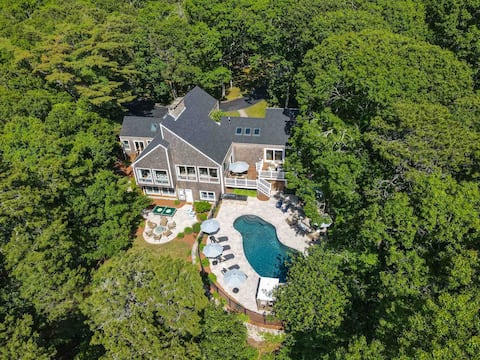
Hyannis Port Beachfront Estate, Heated Pool
Entire Place • 9 bedrooms
4BR 4BA Osterville luxury home with pool/hot tub
Entire Place • 4 bedrooms
![Hyannis Coastal Villa [9bd] - Beaches & Ferries](https://a0.muscache.com/im/pictures/a4c91423-1993-40c1-bae6-1499a1272a7d.jpg?im_w=480&im_format=avif)
Hyannis Coastal Villa [9bd] - Beaches & Ferries
Entire Place • 9 bedrooms

Relax by the Lake: Private Beach & Views
Entire Place • 5 bedrooms

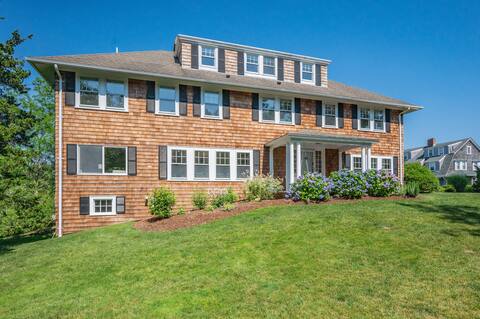
Luxury Historic Estate with Expansive Grounds
Entire Place • 6 bedrooms
Modern Classic Cape Cod Beach House
Entire Place • 6 bedrooms
Note: Performance varies based on location, size, amenities, seasonality, and management quality. Data reflects the past 12 months.
Top Performing Airbnb Hosts in Barnstable (2026)
Learn from the best! This table showcases top-performing Airbnb hosts in Barnstable based on the number of properties managed and estimated total revenue over the past year. Analyze their scale and performance metrics.
| Host Name | Properties | Grossing Revenue | Stay Reviews | Avg Rating |
|---|---|---|---|---|
| Del Mar Vacations | 15 | $1,058,767 | 389 | 4.83/5.0 |
| Evolve | 23 | $800,113 | 612 | 4.75/5.0 |
| Chris | 13 | $489,500 | 835 | 4.84/5.0 |
| Chris | 7 | $413,659 | 61 | 4.93/5.0 |
| Lloyd | 3 | $392,290 | 168 | 4.86/5.0 |
| Shaelyn | 7 | $386,252 | 43 | 5.00/5.0 |
| New England Vacation Rentals | 6 | $339,377 | 24 | 4.85/5.0 |
| Jonathan | 1 | $333,736 | 16 | 5.00/5.0 |
| Margaret | 6 | $323,376 | 68 | 4.96/5.0 |
| Courtney | 1 | $277,118 | 22 | 5.00/5.0 |
Analyzing the strategies of top hosts, such as their property selection, pricing, and guest communication, can offer valuable lessons for optimizing your own Airbnb operations in Barnstable.
Dive Deeper: Advanced Barnstable STR Market Data (2026)
Ready to unlock more insights? AirROI provides access to advanced metrics and comprehensive Airbnb data for Barnstable. Explore detailed analytics beyond this report to refine your investment strategy, optimize pricing, and maximize your vacation rental profits.
Explore Advanced MetricsBarnstable Short-Term Rental Market Composition (2026): Property & Room Types
Room Type Distribution
Property Type Distribution
Market Composition Insights for Barnstable
- The Barnstable Airbnb market composition is heavily skewed towards Entire Home/Apt listings, which make up 92.9% of the 607 active rentals. This indicates strong guest preference for privacy and space.
- Looking at the property type distribution in Barnstable, House properties are the most common (82.5%), reflecting the local real estate landscape.
- Houses represent a significant 82.5% portion, catering likely to families or larger groups.
- The presence of 5.9% Hotel/Boutique listings indicates integration with traditional hospitality.
- Smaller segments like others, outdoor/unique (combined 3.3%) offer potential for unique stay experiences.
Barnstable Airbnb Room Capacity Analysis (2026): Bedroom Distribution
Distribution of Listings by Number of Bedrooms
Room Capacity Insights for Barnstable
- The dominant room capacity in Barnstable is 3 bedrooms listings, making up 32.5% of the market. This suggests a strong demand for properties suitable for families or small groups.
- Together, 3 bedrooms and 4 bedrooms properties represent 54.7% of the active Airbnb listings in Barnstable, indicating a high concentration in these sizes.
- A significant 67.7% of listings offer 3+ bedrooms, catering to larger groups and families seeking more space in Barnstable.
Barnstable Vacation Rental Guest Capacity Trends (2026)
Distribution of Listings by Guest Capacity
Guest Capacity Insights for Barnstable
- The most common guest capacity trend in Barnstable vacation rentals is listings accommodating 8+ guests (44.6%). This suggests the primary traveler segment is likely larger groups.
- Properties designed for 8+ guests and 6 guests dominate the Barnstable STR market, accounting for 64.7% of listings.
- 70.0% of properties accommodate 6+ guests, serving the market segment for larger families or group travel in Barnstable.
- On average, properties in Barnstable are equipped to host 6.1 guests.
Barnstable Airbnb Booking Patterns (2026): Available vs. Booked Days
Available Days Distribution
Booked Days Distribution
Booking Pattern Insights for Barnstable
- The most common availability pattern in Barnstable falls within the 271-366 days range, representing 53.4% of listings. This suggests many properties have significant open periods on their calendars.
- Approximately 92.3% of listings show high availability (181+ days open annually), indicating potential for increased bookings or specific owner usage patterns.
- For booked days, the 91-180 days range is most frequent in Barnstable (40.9%), reflecting common guest stay durations or potential owner blocking patterns.
- A notable 8.5% of properties secure long booking periods (181+ days booked per year), highlighting successful long-term rental strategies or significant owner usage.
Barnstable Airbnb Minimum Stay Requirements Analysis
Distribution of Listings by Minimum Night Requirement
1 Night
40 listings
6.6% of total
2 Nights
88 listings
14.5% of total
3 Nights
44 listings
7.3% of total
4-6 Nights
92 listings
15.2% of total
7-29 Nights
44 listings
7.3% of total
30+ Nights
298 listings
49.2% of total
Key Insights
- The most prevalent minimum stay requirement in Barnstable is 30+ Nights, adopted by 49.2% of listings. This highlights the market's preference for longer commitments.
- A significant segment (49.2%) caters to monthly stays (30+ nights) in Barnstable, pointing to opportunities in the extended-stay market.
Recommendations
- Align with the market by considering a 30+ Nights minimum stay, as 49.2% of Barnstable hosts use this setting.
- If feasible, allowing 1-night stays, especially midweek or during low season, could capture last-minute bookings, as only 6.6% currently do.
- Explore offering discounts for stays of 30+ nights to attract the 49.2% of the market seeking extended stays.
- Adjust minimum nights based on seasonality – potentially shorter during low season and longer during peak demand periods in Barnstable.
Barnstable Airbnb Cancellation Policy Trends Analysis (2026)
Super Strict 30 Days
38 listings
6.3% of total
Limited
3 listings
0.5% of total
Super Strict 60 Days
13 listings
2.1% of total
Flexible
41 listings
6.8% of total
Moderate
86 listings
14.2% of total
Firm
284 listings
46.9% of total
Strict
141 listings
23.3% of total
Cancellation Policy Insights for Barnstable
- The prevailing Airbnb cancellation policy trend in Barnstable is Firm, used by 46.9% of listings.
- A majority (70.2%) of hosts in Barnstable utilize Firm or Strict policies, indicating a market where hosts prioritize booking security.
Recommendations for Hosts
- Consider adopting a Firm policy to align with the 46.9% market standard in Barnstable.
- Regularly review your cancellation policy against competitors and market demand shifts in Barnstable.
Barnstable STR Booking Lead Time Analysis (2026)
Average Booking Lead Time by Month
Booking Lead Time Insights for Barnstable
- The overall average booking lead time for vacation rentals in Barnstable is 70 days.
- Guests book furthest in advance for stays during July (average 106 days), likely coinciding with peak travel demand or local events.
- The shortest booking windows occur for stays in March (average 28 days), indicating more last-minute travel plans during this time.
- Seasonally, Summer (97 days avg.) sees the longest lead times, while Winter (33 days avg.) has the shortest, reflecting typical travel planning cycles.
Recommendations for Hosts
- Use the overall average lead time (70 days) as a baseline for your pricing and availability strategy in Barnstable.
- For July stays, consider implementing length-of-stay discounts or slightly higher rates for bookings made less than 106 days out to capitalize on advance planning.
- Target marketing efforts for the Summer season well in advance (at least 97 days) to capture early planners.
- Monitor your own booking lead times against these Barnstable averages to identify opportunities for dynamic pricing adjustments.
Popular & Essential Airbnb Amenities in Barnstable (2026)
Amenity Prevalence
Amenity Insights for Barnstable
- Essential amenities in Barnstable that guests expect include: Wifi, Smoke alarm, TV, Free parking on premises, Air conditioning, Carbon monoxide alarm. Lacking these (any) could significantly impact bookings.
- Popular amenities like Heating, Kitchen, Hot water are common but not universal. Offering these can provide a competitive edge.
Recommendations for Hosts
- Ensure your listing includes all essential amenities for Barnstable: Wifi, Smoke alarm, TV, Free parking on premises, Air conditioning, Carbon monoxide alarm.
- Prioritize adding missing essentials: Wifi, Smoke alarm, TV, Free parking on premises, Air conditioning, Carbon monoxide alarm.
- Consider adding popular differentiators like Heating or Kitchen to increase appeal.
- Highlight unique or less common amenities you offer (e.g., hot tub, dedicated workspace, EV charger) in your listing description and photos.
- Regularly check competitor amenities in Barnstable to stay competitive.
Barnstable Airbnb Guest Demographics & Profile Analysis (2026)
Guest Profile Summary for Barnstable
- The typical guest profile for Airbnb in Barnstable consists of primarily domestic travelers (93%), often arriving from nearby Boston, typically belonging to the Post-2000s (Gen Z/Alpha) group (50%), primarily speaking English or Spanish.
- Domestic travelers account for 93.1% of guests.
- Key international markets include United States (93.1%) and United Kingdom (1.6%).
- Top languages spoken are English (68.4%) followed by Spanish (9.5%).
- A significant demographic segment is the Post-2000s (Gen Z/Alpha) group, representing 50% of guests.
Recommendations for Hosts
- Target domestic marketing efforts towards travelers from Boston and New York.
- Tailor amenities and listing descriptions to appeal to the dominant Post-2000s (Gen Z/Alpha) demographic (e.g., highlight fast WiFi, smart home features, local guides).
- Highlight unique local experiences or amenities relevant to the primary guest profile.
- Consider seasonal promotions aligned with peak travel times for key origin markets.
Nearby Short-Term Rental Market Comparison
How does the Barnstable Airbnb market stack up against its neighbors? Compare key performance metrics like average monthly revenue, ADR, and occupancy rates in surrounding areas to understand the broader regional STR landscape.
| Market | Active Properties | Monthly Revenue | Daily Rate | Avg. Occupancy |
|---|---|---|---|---|
| Nantucket | 539 | $7,748 | $1045.40 | 41% |
| Middletown | 395 | $5,781 | $589.01 | 45% |
| North Andover | 12 | $5,625 | $440.84 | 45% |
| Nahant | 13 | $5,564 | $602.44 | 42% |
| New Shoreham | 120 | $5,359 | $637.79 | 45% |
| Wellesley | 22 | $5,310 | $520.90 | 50% |
| Edgartown | 255 | $5,250 | $818.21 | 40% |
| Mattapoisett | 34 | $5,105 | $476.61 | 52% |
| Amherst | 10 | $5,003 | $366.01 | 44% |
| Chatham | 370 | $4,755 | $532.54 | 43% |