Attleboro Airbnb Market Analysis 2025: Short Term Rental Data & Vacation Rental Statistics in Massachusetts, United States
Is Airbnb profitable in Attleboro in 2025? Explore comprehensive Airbnb analytics for Attleboro, Massachusetts, United States to uncover income potential. This 2025 STR market report for Attleboro, based on AirROI data from September 2024 to August 2025, reveals key trends in the niche market of 19 active listings.
Whether you're considering an Airbnb investment in Attleboro, optimizing your existing vacation rental, or exploring rental arbitrage opportunities, understanding the Attleboro Airbnb data is crucial. Leveraging the low regulation environment is key to maximizing your short term rental income potential. Let's dive into the specifics.
Key Attleboro Airbnb Performance Metrics Overview
Monthly Airbnb Revenue Variations & Income Potential in Attleboro (2025)
Understanding the monthly revenue variations for Airbnb listings in Attleboro is key to maximizing your short term rental income potential. Seasonality significantly impacts earnings. Our analysis, based on data from the past 12 months, shows that the peak revenue month for STRs in Attleboro is typically March, while December often presents the lowest earnings, highlighting opportunities for strategic pricing adjustments during shoulder and low seasons. Explore the typical Airbnb income in Attleboro across different performance tiers:
- Best-in-class properties (Top 10%) achieve $4,163+ monthly, often utilizing dynamic pricing and superior guest experiences.
- Strong performing properties (Top 25%) earn $2,246 or more, indicating effective management and desirable locations/amenities.
- Typical properties (Median) generate around $983 per month, representing the average market performance.
- Entry-level properties (Bottom 25%) see earnings around $306, often with potential for optimization.
Average Monthly Airbnb Earnings Trend in Attleboro
Attleboro Airbnb Occupancy Rate Trends (2025)
Maximize your bookings by understanding the Attleboro STR occupancy trends. Seasonal demand shifts significantly influence how often properties are booked. Typically, Septembersees the highest demand (peak season occupancy), while March experiences the lowest (low season). Effective strategies, like adjusting minimum stays or offering promotions, can boost occupancy during slower periods. Here's how different property tiers perform in Attleboro:
- Best-in-class properties (Top 10%) achieve 74%+ occupancy, indicating high desirability and potentially optimized availability.
- Strong performing properties (Top 25%) maintain 42% or higher occupancy, suggesting good market fit and guest satisfaction.
- Typical properties (Median) have an occupancy rate around 18%.
- Entry-level properties (Bottom 25%) average 8% occupancy, potentially facing higher vacancy.
Average Monthly Occupancy Rate Trend in Attleboro
Average Daily Rate (ADR) Airbnb Trends in Attleboro (2025)
Effective short term rental pricing strategy in Attleboro involves understanding monthly ADR fluctuations. The Average Daily Rate (ADR) for Airbnb in Attleboro typically peaks in June and dips lowest during February. Leveraging Airbnb dynamic pricing tools or strategies based on this seasonality can significantly boost revenue. Here's a look at the typical nightly rates achieved:
- Best-in-class properties (Top 10%) command rates of $226+ per night, often due to premium features or locations.
- Strong performing properties (Top 25%) achieve nightly rates of $190 or more.
- Typical properties (Median) charge around $121 per night.
- Entry-level properties (Bottom 25%) earn around $43 per night.
Average Daily Rate (ADR) Trend by Month in Attleboro
Get Live Attleboro Market Intelligence 👇

Explore Real-time Analytics
Airbnb Seasonality Analysis & Trends in Attleboro (2025)
Peak Season (March, January, April)
- Revenue averages $2,318 per month
- Occupancy rates average 24.9%
- Daily rates average $118
Shoulder Season
- Revenue averages $1,578 per month
- Occupancy maintains around 33.8%
- Daily rates hold near $127
Low Season (February, October, December)
- Revenue drops to average $1,107 per month
- Occupancy decreases to average 30.2%
- Daily rates adjust to average $118
Seasonality Insights for Attleboro
- The Airbnb seasonality in Attleboro shows highly seasonal trends requiring careful strategy. While the sections above show seasonal averages, it's also insightful to look at the extremes:
- During the high season, the absolute peak month showcases Attleboro's highest earning potential, with monthly revenues capable of climbing to $2,411, occupancy reaching a high of 41.3%, and ADRs peaking at $132.
- Conversely, the slowest single month of the year, typically falling within the low season, marks the market's lowest point. In this month, revenue might dip to $921, occupancy could drop to 9.7%, and ADRs may adjust down to $117.
- Understanding both the seasonal averages and these monthly peaks and troughs in revenue, occupancy, and ADR is crucial for maximizing your Airbnb profit potential in Attleboro.
Seasonal Strategies for Maximizing Profit
- Peak Season: Maximize revenue through premium pricing and potentially longer minimum stays. Ensure high availability.
- Low Season: Offer competitive pricing, special promotions (e.g., extended stay discounts), and flexible cancellation policies. Target off-season travelers like remote workers or budget-conscious guests.
- Shoulder Seasons: Implement dynamic pricing that balances peak and low rates. Target weekend travelers or specific events. Offer slightly more flexible terms than peak season.
- Regularly analyze your own performance against these Attleboro seasonality benchmarks and adjust your pricing and availability strategy accordingly.
Best Areas for Airbnb Investment in Attleboro (2025)
Exploring the top neighborhoods for short-term rentals in Attleboro? This section highlights key areas, outlining why they are attractive for hosts and guests, along with notable local attractions. Consider these locations based on your target guest profile and investment strategy.
| Neighborhood / Area | Why Host Here? (Target Guests & Appeal) | Key Attractions & Landmarks |
|---|---|---|
| Downtown Attleboro | The heart of Attleboro with a vibrant community and access to restaurants, shops, and the train station for easy commuting to Boston. Ideal for business travelers and tourists looking for convenience. | Attleboro Arts Museum, Capron Park Zoo, Raymond Hall, local restaurants and cafes, historic buildings |
| Attleboro Falls | A quaint residential area that offers a small-town feel with scenic views and access to nature trails. Attracts families and outdoor enthusiasts. | Falls Pond, Houghton's Pond, local parks, nature trails, historic sites |
| North Attleborough | Close proximity to shopping and dining options, as well as easy access to major highways. Popular area for families and individuals seeking suburban living. | North Attleborough Town Common, local shopping centers, restaurants, parks |
| South Attleborough | Offers a mix of residential and commercial properties with access to major roads and public transportation. Great for families and those commuting to work. | local parks, shopping areas, dining options, easy commuter access |
| Woonsocket Line Area | This area near the Rhode Island border provides access to both Attleboro and nearby Woonsocket attractions, making it a convenient spot for guests. | Tender Crop Farm, local dining, cycling routes |
| Capron Park | Home to Capron Park Zoo and scenic park areas, this is a great location for families and animal lovers. | Capron Park Zoo, Capron Park, children's playgrounds, picnic areas |
| Lakeville | Located just a short drive from Attleboro, offering beautiful lakeside views and recreational activities. Perfect for guests seeking relaxation and nature. | Lakeville's lakes, boating, hiking trails |
| Seekonk | Adjacent to Attleboro, Seekonk offers additional shopping and dining options, along with parks and recreational spaces. Ideal for guests who want a broader area to explore. | Seekonk Pond, local shopping centers, dining options, Seekonk Meadows |
Understanding Airbnb License Requirements & STR Laws in Attleboro (2025)
While Attleboro, Massachusetts, United States currently shows low STR regulations, specific Airbnb license requirements might still exist or change. Always verify the latest short term rental regulations and Airbnb license requirements directly with local government authorities for Attleboro to ensure full compliance before hosting.
(Source: AirROI data, 2025, finding no licensed listings among those analyzed)
Top Performing Airbnb Properties in Attleboro (2025)
Benchmark your potential! Explore examples of top-performing Airbnb properties in Attleborobased on Trailing Twelve Month (TTM) revenue. Analyze their characteristics, revenue, occupancy rate, and ADR to understand what drives success in this market.
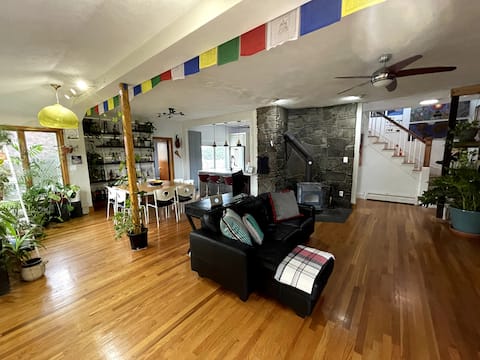
3 Bedroom Creative Home For Your Enjoyment
Entire Place • 3 bedrooms

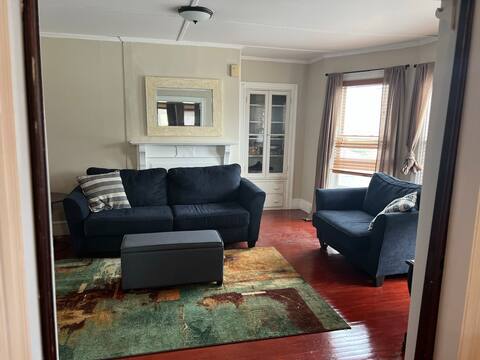
Cozy, spacious 2 bedroom finished basement suite
Entire Place • 2 bedrooms
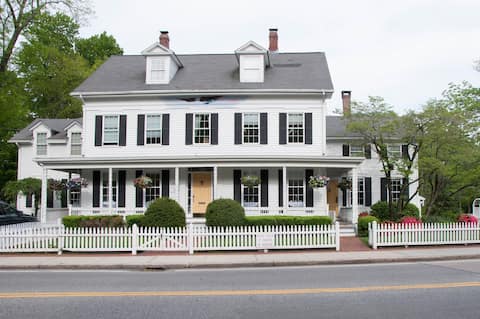
New England Victorian apartment
Entire Place • 1 bedroom
Colonel Blackinton Inn Room #5
Private Room • 1 bedroom

Colonel Blackinton Inn Room #4
Private Room • 1 bedroom

Colonel Blackinton Inn Room #3
Private Room • 1 bedroom
Note: Performance varies based on location, size, amenities, seasonality, and management quality. Data reflects the past 12 months.
Top Performing Airbnb Hosts in Attleboro (2025)
Learn from the best! This table showcases top-performing Airbnb hosts in Attleboro based on the number of properties managed and estimated total revenue over the past year. Analyze their scale and performance metrics.
| Host Name | Properties | Grossing Revenue | Stay Reviews | Avg Rating |
|---|---|---|---|---|
| Victor | 1 | $47,958 | 54 | 4.93/5.0 |
| Kimberly | 8 | $40,690 | 175 | 4.67/5.0 |
| Ryan | 1 | $38,372 | 180 | 4.81/5.0 |
| Donald | 1 | $18,679 | 13 | 4.92/5.0 |
| Alfred Hess | 7 | $6,430 | 110 | 4.98/5.0 |
| Kristyn | 1 | $994 | 1 | Not Rated |
Analyzing the strategies of top hosts, such as their property selection, pricing, and guest communication, can offer valuable lessons for optimizing your own Airbnb operations in Attleboro.
Dive Deeper: Advanced Attleboro STR Market Data (2025)
Ready to unlock more insights? AirROI provides access to advanced metrics and comprehensive Airbnb data for Attleboro. Explore detailed analytics beyond this report to refine your investment strategy, optimize pricing, and maximize your vacation rental profits.
Explore Advanced MetricsAttleboro Short-Term Rental Market Composition (2025): Property & Room Types
Room Type Distribution
Property Type Distribution
Market Composition Insights for Attleboro
- The Attleboro Airbnb market composition is heavily skewed towards Private Room listings, which make up 42.1% of the 19 active rentals. This indicates strong guest preference for privacy and space.
- Looking at the property type distribution in Attleboro, Hotel/Boutique properties are the most common (42.1%), reflecting the local real estate landscape.
- The presence of 42.1% Hotel/Boutique listings indicates integration with traditional hospitality.
Attleboro Airbnb Room Capacity Analysis (2025): Bedroom Distribution
Distribution of Listings by Number of Bedrooms
Room Capacity Insights for Attleboro
- The dominant room capacity in Attleboro is 1 bedroom listings, making up 52.6% of the market. This suggests a strong demand for properties suitable for couples or solo travelers.
- Together, 1 bedroom and 3 bedrooms properties represent 57.9% of the active Airbnb listings in Attleboro, indicating a high concentration in these sizes.
- With over half the market (52.6%) consisting of studios or 1-bedroom units, Attleboro is particularly well-suited for individuals or couples.
- Listings with 3+ bedrooms (5.3%) represent a smaller niche, potentially indicating an underserved market for larger group accommodations in Attleboro.
Attleboro Vacation Rental Guest Capacity Trends (2025)
Distribution of Listings by Guest Capacity
Guest Capacity Insights for Attleboro
- The most common guest capacity trend in Attleboro vacation rentals is listings accommodating 2 guests (42.1%). This suggests the primary traveler segment is likely couples or solo travelers.
- Properties designed for 2 guests and 4 guests dominate the Attleboro STR market, accounting for 52.6% of listings.
- A significant 47.4% of listings cater specifically to 1-2 guests, highlighting strong demand from couples and solo travelers in Attleboro.
- On average, properties in Attleboro are equipped to host 1.7 guests.
Attleboro Airbnb Booking Patterns (2025): Available vs. Booked Days
Available Days Distribution
Booked Days Distribution
Booking Pattern Insights for Attleboro
- The most common availability pattern in Attleboro falls within the 271-366 days range, representing 84.2% of listings. This suggests many properties have significant open periods on their calendars.
- Approximately 89.5% of listings show high availability (181+ days open annually), indicating potential for increased bookings or specific owner usage patterns.
- For booked days, the 1-30 days range is most frequent in Attleboro (57.9%), reflecting common guest stay durations or potential owner blocking patterns.
- A notable 10.6% of properties secure long booking periods (181+ days booked per year), highlighting successful long-term rental strategies or significant owner usage.
Attleboro Airbnb Minimum Stay Requirements Analysis
Distribution of Listings by Minimum Night Requirement
1 Night
16 listings
84.2% of total
2 Nights
1 listings
5.3% of total
4-6 Nights
1 listings
5.3% of total
30+ Nights
1 listings
5.3% of total
Key Insights
- The most prevalent minimum stay requirement in Attleboro is 1 Night, adopted by 84.2% of listings. This highlights the market's preference for shorter, flexible bookings.
- A strong majority (89.5%) of the Attleboro Airbnb data shows acceptance of very short stays (1-2 nights), indicating a dynamic, high-turnover market.
Recommendations
- Align with the market by considering a 1 Night minimum stay, as 84.2% of Attleboro hosts use this setting.
- Explore offering discounts for stays of 30+ nights to attract the 5.3% of the market seeking extended stays.
- Adjust minimum nights based on seasonality – potentially shorter during low season and longer during peak demand periods in Attleboro.
Attleboro Airbnb Cancellation Policy Trends Analysis (2025)
Flexible
2 listings
10.5% of total
Moderate
8 listings
42.1% of total
Firm
2 listings
10.5% of total
Strict
7 listings
36.8% of total
Cancellation Policy Insights for Attleboro
- The prevailing Airbnb cancellation policy trend in Attleboro is Moderate, used by 42.1% of listings.
- There's a relatively balanced mix between guest-friendly (52.6%) and stricter (47.3%) policies, offering choices for different guest needs.
Recommendations for Hosts
- Consider adopting a Moderate policy to align with the 42.1% market standard in Attleboro.
- With 36.8% using Strict terms, this is a viable option in Attleboro, particularly for high-value properties or during peak demand periods.
- Regularly review your cancellation policy against competitors and market demand shifts in Attleboro.
Attleboro STR Booking Lead Time Analysis (2025)
Average Booking Lead Time by Month
Booking Lead Time Insights for Attleboro
- The overall average booking lead time for vacation rentals in Attleboro is 21 days.
- Guests book furthest in advance for stays during May (average 63 days), likely coinciding with peak travel demand or local events.
- The shortest booking windows occur for stays in March (average 5 days), indicating more last-minute travel plans during this time.
- Seasonally, Summer (34 days avg.) sees the longest lead times, while Fall (16 days avg.) has the shortest, reflecting typical travel planning cycles.
Recommendations for Hosts
- Use the overall average lead time (21 days) as a baseline for your pricing and availability strategy in Attleboro.
- For May stays, consider implementing length-of-stay discounts or slightly higher rates for bookings made less than 63 days out to capitalize on advance planning.
- During March, focus on last-minute booking availability and promotions, as guests book with very short notice (5 days avg.).
- Target marketing efforts for the Summer season well in advance (at least 34 days) to capture early planners.
- Monitor your own booking lead times against these Attleboro averages to identify opportunities for dynamic pricing adjustments.
Popular & Essential Airbnb Amenities in Attleboro (2025)
Amenity Prevalence
No amenities with partial availability (less than 100%) were found to display in the chart. All essential amenities might be present in all listings. Check insights below.
Amenity Insights for Attleboro
- Essential amenities in Attleboro that guests expect include: Iron, First aid kit, Free parking on premises, TV, Fire extinguisher, Heating, Smoke alarm, Shampoo, Hair dryer, Hangers. Lacking these (any) could significantly impact bookings.
Recommendations for Hosts
- Ensure your listing includes all essential amenities for Attleboro: Iron, First aid kit, Free parking on premises, TV, Fire extinguisher, Heating, Smoke alarm, Shampoo, Hair dryer, Hangers.
- Highlight unique or less common amenities you offer (e.g., hot tub, dedicated workspace, EV charger) in your listing description and photos.
- Regularly check competitor amenities in Attleboro to stay competitive.
Attleboro Airbnb Guest Demographics & Profile Analysis (2025)
Guest Profile Summary for Attleboro
- The typical guest profile for Airbnb in Attleboro consists of primarily domestic travelers (94%), often arriving from nearby Freeport, typically belonging to the Post-2000s (Gen Z/Alpha) group (50%), primarily speaking English or Spanish.
- Domestic travelers account for 93.8% of guests.
- Key international markets include United States (93.8%) and United Kingdom (3.7%).
- Top languages spoken are English (80.7%) followed by Spanish (7%).
- A significant demographic segment is the Post-2000s (Gen Z/Alpha) group, representing 50% of guests.
Recommendations for Hosts
- Target domestic marketing efforts towards travelers from Freeport and Providence.
- Tailor amenities and listing descriptions to appeal to the dominant Post-2000s (Gen Z/Alpha) demographic (e.g., highlight fast WiFi, smart home features, local guides).
- Highlight unique local experiences or amenities relevant to the primary guest profile.
- Consider seasonal promotions aligned with peak travel times for key origin markets.
Nearby Short-Term Rental Market Comparison
How does the Attleboro Airbnb market stack up against its neighbors? Compare key performance metrics like average monthly revenue, ADR, and occupancy rates in surrounding areas to understand the broader regional STR landscape.
| Market | Active Properties | Monthly Revenue | Daily Rate | Avg. Occupancy |
|---|---|---|---|---|
| Nahant | 12 | $6,440 | $620.28 | 45% |
| Nantucket | 570 | $6,231 | $991.78 | 38% |
| North Andover | 12 | $5,711 | $436.05 | 49% |
| North Hampton | 10 | $5,604 | $542.10 | 38% |
| Middletown | 402 | $5,042 | $546.49 | 43% |
| Town of East Hampton | 1,408 | $4,982 | $981.60 | 32% |
| Town of Southampton | 1,300 | $4,891 | $978.42 | 31% |
| New Shoreham | 113 | $4,810 | $641.26 | 42% |
| Westminster | 10 | $4,736 | $445.48 | 55% |
| Wellesley | 21 | $4,493 | $514.59 | 50% |