Westover Airbnb Market Analysis 2026: Short Term Rental Data & Vacation Rental Statistics in Maryland, United States
Is Airbnb profitable in Westover in 2026? Explore comprehensive Airbnb analytics for Westover, Maryland, United States to uncover income potential. This 2026 STR market report for Westover, based on AirROI data from February 2025 to January 2026, reveals key trends in the niche market of 22 active listings.
Whether you're considering an Airbnb investment in Westover, optimizing your existing vacation rental, or exploring rental arbitrage opportunities, understanding the Westover Airbnb data is crucial. Leveraging the low regulation environment is key to maximizing your short term rental income potential. Let's dive into the specifics.
Key Westover Airbnb Performance Metrics Overview
Monthly Airbnb Revenue Variations & Income Potential in Westover (2026)
Understanding the monthly revenue variations for Airbnb listings in Westover is key to maximizing your short term rental income potential. Seasonality significantly impacts earnings. Our analysis, based on data from the past 12 months, shows that the peak revenue month for STRs in Westover is typically August, while January often presents the lowest earnings, highlighting opportunities for strategic pricing adjustments during shoulder and low seasons. Explore the typical Airbnb income in Westover across different performance tiers:
- Best-in-class properties (Top 10%) achieve $8,196+ monthly, often utilizing dynamic pricing and superior guest experiences.
- Strong performing properties (Top 25%) earn $5,472 or more, indicating effective management and desirable locations/amenities.
- Typical properties (Median) generate around $2,319 per month, representing the average market performance.
- Entry-level properties (Bottom 25%) see earnings around $833, often with potential for optimization.
Average Monthly Airbnb Earnings Trend in Westover
Westover Airbnb Occupancy Rate Trends (2026)
Maximize your bookings by understanding the Westover STR occupancy trends. Seasonal demand shifts significantly influence how often properties are booked. Typically, Augustsees the highest demand (peak season occupancy), while January experiences the lowest (low season). Effective strategies, like adjusting minimum stays or offering promotions, can boost occupancy during slower periods. Here's how different property tiers perform in Westover:
- Best-in-class properties (Top 10%) achieve 69%+ occupancy, indicating high desirability and potentially optimized availability.
- Strong performing properties (Top 25%) maintain 50% or higher occupancy, suggesting good market fit and guest satisfaction.
- Typical properties (Median) have an occupancy rate around 31%.
- Entry-level properties (Bottom 25%) average 19% occupancy, potentially facing higher vacancy.
Average Monthly Occupancy Rate Trend in Westover
Average Daily Rate (ADR) Airbnb Trends in Westover (2026)
Effective short term rental pricing strategy in Westover involves understanding monthly ADR fluctuations. The Average Daily Rate (ADR) for Airbnb in Westover typically peaks in August and dips lowest during February. Leveraging Airbnb dynamic pricing tools or strategies based on this seasonality can significantly boost revenue. Here's a look at the typical nightly rates achieved:
- Best-in-class properties (Top 10%) command rates of $810+ per night, often due to premium features or locations.
- Strong performing properties (Top 25%) achieve nightly rates of $377 or more.
- Typical properties (Median) charge around $236 per night.
- Entry-level properties (Bottom 25%) earn around $165 per night.
Average Daily Rate (ADR) Trend by Month in Westover
Get Live Westover Market Intelligence 👇

Explore Real-time Analytics
Airbnb Seasonality Analysis & Trends in Westover (2026)
Peak Season (August, July, June)
- Revenue averages $5,498 per month
- Occupancy rates average 52.8%
- Daily rates average $361
Shoulder Season
- Revenue averages $3,219 per month
- Occupancy maintains around 32.7%
- Daily rates hold near $342
Low Season (January, March, November)
- Revenue drops to average $2,049 per month
- Occupancy decreases to average 25.0%
- Daily rates adjust to average $342
Seasonality Insights for Westover
- The Airbnb seasonality in Westover shows highly seasonal trends requiring careful strategy. While the sections above show seasonal averages, it's also insightful to look at the extremes:
- During the high season, the absolute peak month showcases Westover's highest earning potential, with monthly revenues capable of climbing to $6,212, occupancy reaching a high of 59.2%, and ADRs peaking at $371.
- Conversely, the slowest single month of the year, typically falling within the low season, marks the market's lowest point. In this month, revenue might dip to $1,423, occupancy could drop to 17.5%, and ADRs may adjust down to $311.
- Understanding both the seasonal averages and these monthly peaks and troughs in revenue, occupancy, and ADR is crucial for maximizing your Airbnb profit potential in Westover.
Seasonal Strategies for Maximizing Profit
- Peak Season: Maximize revenue through premium pricing and potentially longer minimum stays. Ensure high availability.
- Low Season: Offer competitive pricing, special promotions (e.g., extended stay discounts), and flexible cancellation policies. Target off-season travelers like remote workers or budget-conscious guests.
- Shoulder Seasons: Implement dynamic pricing that balances peak and low rates. Target weekend travelers or specific events. Offer slightly more flexible terms than peak season.
- Regularly analyze your own performance against these Westover seasonality benchmarks and adjust your pricing and availability strategy accordingly.
Best Areas for Airbnb Investment in Westover (2026)
Exploring the top neighborhoods for short-term rentals in Westover? This section highlights key areas, outlining why they are attractive for hosts and guests, along with notable local attractions. Consider these locations based on your target guest profile and investment strategy.
| Neighborhood / Area | Why Host Here? (Target Guests & Appeal) | Key Attractions & Landmarks |
|---|---|---|
| West Ocean City | A popular destination for beach lovers and families, West Ocean City offers a quieter alternative to the busy Ocean City boardwalk while still being close to beautiful beaches and attractions. | Ocean City Boardwalk, Assateague Island National Seashore, Sunset Park, West Ocean City Harbor, Mason Dixon Fishing Charters |
| Berlin | Recognized for its charming Main Street and historic buildings, Berlin is a quaint town close to Ocean City that attracts visitors seeking a small-town feel with local shops and eateries. | Bud Church of God, Main Street, Atlantic Hotel, Berlin Falls Park, The Globe Theatre |
| Salisbury | As the largest city in the Eastern Shore region, Salisbury offers a variety of urban attractions and is a hub for travelers visiting nearby coastal areas. | Salisbury Zoo, Centre at Salisbury, Pemberton Historical Park, Poplar Hill Mansion, Wicomico County Youth and Civic Center |
| Pocomoke City | A charming small town known for its scenic beauty and outdoor activities, Pocomoke City is perfect for guests looking to explore nature and wildlife. | Pocomoke River State Park, Great Cypress Swamp, Delmarva Discovery Center, Cypress Park, Historic Downtown Pocomoke |
| Cambridge | Known for its historic waterfront and cultural sites, Cambridge attracts visitors looking for a blend of history and outdoor experiences. | Harriet Tubman Underground Railroad Museum, Choptank River Lighthouse, Long Wharf Park, Canterbury Hotel, Cambridge Main Street |
| Easton | A cultural hub of the Eastern Shore, Easton features art galleries, music venues, and various shops, making it a vibrant area for tourists. | Academy Art Museum, Easton Historic District, Avalon Theatre, Tattooed Moose, Talbot County Courthouse |
| St. Michaels | A picturesque waterfront town known for its maritime history, St. Michaels is a popular spot with visitors looking for charming shops and scenic views. | Chesapeake Bay Maritime Museum, St. Michaels Museum, Watermen’s Wharf, Oxford-Bellevue Ferry, St. Michaels Winery |
| Ocean City | A famous resort town known for its beaches and boardwalk, Ocean City attracts millions of visitors each year, making it a prime location for vacation rentals. | Ocean City Beach, Ocean City Boardwalk, Jolly Roger Amusement Park, Trimper's Rides, Assateague Island National Seashore |
Understanding Airbnb License Requirements & STR Laws in Westover (2026)
While Westover, Maryland, United States currently shows low STR regulations, specific Airbnb license requirements might still exist or change. Always verify the latest short term rental regulations and Airbnb license requirements directly with local government authorities for Westover to ensure full compliance before hosting.
(Source: AirROI data, 2026, based on 5% licensed listings)
Top Performing Airbnb Properties in Westover (2026)
Benchmark your potential! Explore examples of top-performing Airbnb properties in Westoverbased on Trailing Twelve Month (TTM) revenue. Analyze their characteristics, revenue, occupancy rate, and ADR to understand what drives success in this market.
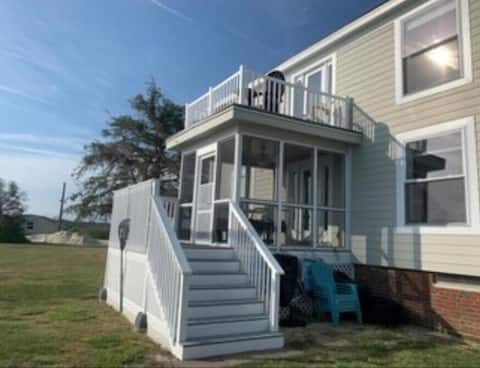
Breathtaking Waterfront Retreat
Entire Place • 8 bedrooms

The Farm
Entire Place • 6 bedrooms

Rumbley Cottage on the Tangier Sound-Private Beach
Entire Place • 2 bedrooms
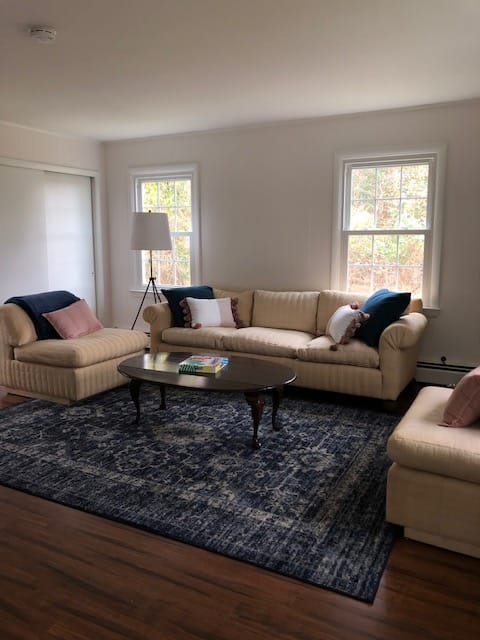
Farm House Stay on the Eastern Shore of Maryland
Entire Place • 3 bedrooms
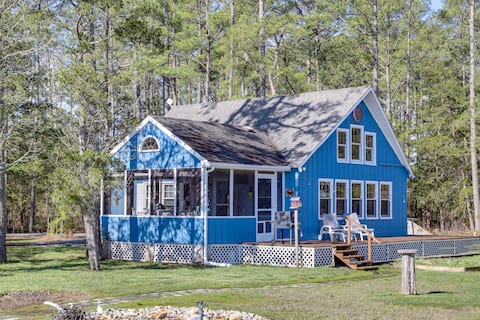
Dog-Friendly Westover Cottage w/ River Access!
Entire Place • 2 bedrooms

Beachfront Chesapeake Bay Retreat
Entire Place • 4 bedrooms
Note: Performance varies based on location, size, amenities, seasonality, and management quality. Data reflects the past 12 months.
Top Performing Airbnb Hosts in Westover (2026)
Learn from the best! This table showcases top-performing Airbnb hosts in Westover based on the number of properties managed and estimated total revenue over the past year. Analyze their scale and performance metrics.
| Host Name | Properties | Grossing Revenue | Stay Reviews | Avg Rating |
|---|---|---|---|---|
| Dana | 4 | $192,408 | 239 | 5.00/5.0 |
| Mary Beth | 1 | $103,401 | 5 | 5.00/5.0 |
| Kristina | 1 | $83,290 | 245 | 4.99/5.0 |
| Evolve | 1 | $49,894 | 51 | 4.86/5.0 |
| Margaret | 1 | $48,165 | 92 | 4.93/5.0 |
| Chris | 1 | $40,519 | 47 | 4.85/5.0 |
| Traci | 1 | $36,414 | 56 | 5.00/5.0 |
| Martha | 2 | $27,161 | 146 | 4.91/5.0 |
| Jennifer | 1 | $21,717 | 7 | 5.00/5.0 |
| Cheryl | 1 | $18,368 | 179 | 4.93/5.0 |
Analyzing the strategies of top hosts, such as their property selection, pricing, and guest communication, can offer valuable lessons for optimizing your own Airbnb operations in Westover.
Dive Deeper: Advanced Westover STR Market Data (2026)
Ready to unlock more insights? AirROI provides access to advanced metrics and comprehensive Airbnb data for Westover. Explore detailed analytics beyond this report to refine your investment strategy, optimize pricing, and maximize your vacation rental profits.
Explore Advanced MetricsWestover Short-Term Rental Market Composition (2026): Property & Room Types
Room Type Distribution
Property Type Distribution
Market Composition Insights for Westover
- The Westover Airbnb market composition is heavily skewed towards Entire Home/Apt listings, which make up 86.4% of the 22 active rentals. This indicates strong guest preference for privacy and space.
- Looking at the property type distribution in Westover, House properties are the most common (68.2%), reflecting the local real estate landscape.
- Houses represent a significant 68.2% portion, catering likely to families or larger groups.
- Smaller segments like others (combined 4.5%) offer potential for unique stay experiences.
Westover Airbnb Room Capacity Analysis (2026): Bedroom Distribution
Distribution of Listings by Number of Bedrooms
Room Capacity Insights for Westover
- The dominant room capacity in Westover is 2 bedrooms listings, making up 36.4% of the market. This suggests a strong demand for properties suitable for couples or solo travelers.
- Together, 2 bedrooms and 3 bedrooms properties represent 59.1% of the active Airbnb listings in Westover, indicating a high concentration in these sizes.
- A significant 36.3% of listings offer 3+ bedrooms, catering to larger groups and families seeking more space in Westover.
Westover Vacation Rental Guest Capacity Trends (2026)
Distribution of Listings by Guest Capacity
Guest Capacity Insights for Westover
- The most common guest capacity trend in Westover vacation rentals is listings accommodating 4 guests (31.8%). This suggests the primary traveler segment is likely small families or groups.
- Properties designed for 4 guests and 8+ guests dominate the Westover STR market, accounting for 59.1% of listings.
- 40.9% of properties accommodate 6+ guests, serving the market segment for larger families or group travel in Westover.
- On average, properties in Westover are equipped to host 4.7 guests.
Westover Airbnb Booking Patterns (2026): Available vs. Booked Days
Available Days Distribution
Booked Days Distribution
Booking Pattern Insights for Westover
- The most common availability pattern in Westover falls within the 271-366 days range, representing 59.1% of listings. This suggests many properties have significant open periods on their calendars.
- Approximately 90.9% of listings show high availability (181+ days open annually), indicating potential for increased bookings or specific owner usage patterns.
- For booked days, the 31-90 days range is most frequent in Westover (50%), reflecting common guest stay durations or potential owner blocking patterns.
- A notable 9.1% of properties secure long booking periods (181+ days booked per year), highlighting successful long-term rental strategies or significant owner usage.
Westover Airbnb Minimum Stay Requirements Analysis
Distribution of Listings by Minimum Night Requirement
1 Night
2 listings
9.1% of total
2 Nights
13 listings
59.1% of total
3 Nights
2 listings
9.1% of total
30+ Nights
5 listings
22.7% of total
Key Insights
- The most prevalent minimum stay requirement in Westover is 2 Nights, adopted by 59.1% of listings. This highlights the market's preference for shorter, flexible bookings.
- A strong majority (68.2%) of the Westover Airbnb data shows acceptance of very short stays (1-2 nights), indicating a dynamic, high-turnover market.
- A significant segment (22.7%) caters to monthly stays (30+ nights) in Westover, pointing to opportunities in the extended-stay market.
Recommendations
- Align with the market by considering a 2 Nights minimum stay, as 59.1% of Westover hosts use this setting.
- If feasible, allowing 1-night stays, especially midweek or during low season, could capture last-minute bookings, as only 9.1% currently do.
- A 2-night minimum appears standard (59.1%). Consider this for weekends or peak periods.
- Explore offering discounts for stays of 30+ nights to attract the 22.7% of the market seeking extended stays.
- Adjust minimum nights based on seasonality – potentially shorter during low season and longer during peak demand periods in Westover.
Westover Airbnb Cancellation Policy Trends Analysis (2026)
Flexible
6 listings
27.3% of total
Moderate
5 listings
22.7% of total
Firm
10 listings
45.5% of total
Strict
1 listings
4.5% of total
Cancellation Policy Insights for Westover
- The prevailing Airbnb cancellation policy trend in Westover is Firm, used by 45.5% of listings.
- There's a relatively balanced mix between guest-friendly (50.0%) and stricter (50.0%) policies, offering choices for different guest needs.
- Strict cancellation policies are quite rare (4.5%), potentially making listings with this policy less competitive unless justified by high demand or property type.
Recommendations for Hosts
- Consider adopting a Firm policy to align with the 45.5% market standard in Westover.
- Using a Strict policy might deter some guests, as only 4.5% of listings use it. Evaluate if potential revenue protection outweighs possible lower booking rates.
- Regularly review your cancellation policy against competitors and market demand shifts in Westover.
Westover STR Booking Lead Time Analysis (2026)
Average Booking Lead Time by Month
Booking Lead Time Insights for Westover
- The overall average booking lead time for vacation rentals in Westover is 43 days.
- Guests book furthest in advance for stays during July (average 80 days), likely coinciding with peak travel demand or local events.
- The shortest booking windows occur for stays in February (average 8 days), indicating more last-minute travel plans during this time.
- Seasonally, Summer (69 days avg.) sees the longest lead times, while Winter (23 days avg.) has the shortest, reflecting typical travel planning cycles.
Recommendations for Hosts
- Use the overall average lead time (43 days) as a baseline for your pricing and availability strategy in Westover.
- For July stays, consider implementing length-of-stay discounts or slightly higher rates for bookings made less than 80 days out to capitalize on advance planning.
- During February, focus on last-minute booking availability and promotions, as guests book with very short notice (8 days avg.).
- Target marketing efforts for the Summer season well in advance (at least 69 days) to capture early planners.
- Monitor your own booking lead times against these Westover averages to identify opportunities for dynamic pricing adjustments.
Popular & Essential Airbnb Amenities in Westover (2026)
Amenity Prevalence
Amenity Insights for Westover
- Essential amenities in Westover that guests expect include: Free parking on premises, Air conditioning. Lacking these (any) could significantly impact bookings.
- Popular amenities like Kitchen, Hot water, Heating are common but not universal. Offering these can provide a competitive edge.
Recommendations for Hosts
- Ensure your listing includes all essential amenities for Westover: Free parking on premises, Air conditioning.
- Prioritize adding missing essentials: Free parking on premises, Air conditioning.
- Consider adding popular differentiators like Kitchen or Hot water to increase appeal.
- Highlight unique or less common amenities you offer (e.g., hot tub, dedicated workspace, EV charger) in your listing description and photos.
- Regularly check competitor amenities in Westover to stay competitive.
Westover Airbnb Guest Demographics & Profile Analysis (2026)
Guest Profile Summary for Westover
- The typical guest profile for Airbnb in Westover consists of primarily domestic travelers (91%), often arriving from nearby Washington, typically belonging to the Post-2000s (Gen Z/Alpha) group (50%), primarily speaking English or Spanish.
- Domestic travelers account for 91.4% of guests.
- Key international markets include United States (91.4%) and DC (7.1%).
- Top languages spoken are English (67.7%) followed by Spanish (7.7%).
- A significant demographic segment is the Post-2000s (Gen Z/Alpha) group, representing 50% of guests.
Recommendations for Hosts
- Target domestic marketing efforts towards travelers from Washington and New York.
- Tailor amenities and listing descriptions to appeal to the dominant Post-2000s (Gen Z/Alpha) demographic (e.g., highlight fast WiFi, smart home features, local guides).
- Highlight unique local experiences or amenities relevant to the primary guest profile.
- Consider seasonal promotions aligned with peak travel times for key origin markets.
Nearby Short-Term Rental Market Comparison
How does the Westover Airbnb market stack up against its neighbors? Compare key performance metrics like average monthly revenue, ADR, and occupancy rates in surrounding areas to understand the broader regional STR landscape.
| Market | Active Properties | Monthly Revenue | Daily Rate | Avg. Occupancy |
|---|---|---|---|---|
| Centreville | 17 | $6,298 | $565.66 | 45% |
| Mayo | 13 | $5,915 | $447.58 | 51% |
| Cape May Point | 23 | $5,479 | $542.19 | 46% |
| Stone Harbor | 42 | $5,467 | $785.22 | 39% |
| Stevensville | 80 | $5,412 | $556.79 | 41% |
| Weems | 11 | $5,077 | $417.22 | 47% |
| Lower Windsor Township | 14 | $5,062 | $428.71 | 45% |
| Arundel on the Bay | 29 | $5,043 | $486.96 | 40% |
| Cape May | 334 | $5,029 | $553.79 | 42% |
| Surf City | 47 | $5,004 | $715.29 | 44% |