Shady Side Airbnb Market Analysis 2025: Short Term Rental Data & Vacation Rental Statistics in Maryland, United States
Is Airbnb profitable in Shady Side in 2025? Explore comprehensive Airbnb analytics for Shady Side, Maryland, United States to uncover income potential. This 2025 STR market report for Shady Side, based on AirROI data from November 2024 to October 2025, reveals key trends in the niche market of 21 active listings.
Whether you're considering an Airbnb investment in Shady Side, optimizing your existing vacation rental, or exploring rental arbitrage opportunities, understanding the Shady Side Airbnb data is crucial. Navigating the high regulation landscape is key to maximizing your short term rental income potential. Let's dive into the specifics.
Key Shady Side Airbnb Performance Metrics Overview
Monthly Airbnb Revenue Variations & Income Potential in Shady Side (2025)
Understanding the monthly revenue variations for Airbnb listings in Shady Side is key to maximizing your short term rental income potential. Seasonality significantly impacts earnings. Our analysis, based on data from the past 12 months, shows that the peak revenue month for STRs in Shady Side is typically August, while February often presents the lowest earnings, highlighting opportunities for strategic pricing adjustments during shoulder and low seasons. Explore the typical Airbnb income in Shady Side across different performance tiers:
- Best-in-class properties (Top 10%) achieve $10,310+ monthly, often utilizing dynamic pricing and superior guest experiences.
- Strong performing properties (Top 25%) earn $7,000 or more, indicating effective management and desirable locations/amenities.
- Typical properties (Median) generate around $3,887 per month, representing the average market performance.
- Entry-level properties (Bottom 25%) see earnings around $2,424, often with potential for optimization.
Average Monthly Airbnb Earnings Trend in Shady Side
Shady Side Airbnb Occupancy Rate Trends (2025)
Maximize your bookings by understanding the Shady Side STR occupancy trends. Seasonal demand shifts significantly influence how often properties are booked. Typically, Julysees the highest demand (peak season occupancy), while February experiences the lowest (low season). Effective strategies, like adjusting minimum stays or offering promotions, can boost occupancy during slower periods. Here's how different property tiers perform in Shady Side:
- Best-in-class properties (Top 10%) achieve 79%+ occupancy, indicating high desirability and potentially optimized availability.
- Strong performing properties (Top 25%) maintain 58% or higher occupancy, suggesting good market fit and guest satisfaction.
- Typical properties (Median) have an occupancy rate around 37%.
- Entry-level properties (Bottom 25%) average 22% occupancy, potentially facing higher vacancy.
Average Monthly Occupancy Rate Trend in Shady Side
Average Daily Rate (ADR) Airbnb Trends in Shady Side (2025)
Effective short term rental pricing strategy in Shady Side involves understanding monthly ADR fluctuations. The Average Daily Rate (ADR) for Airbnb in Shady Side typically peaks in June and dips lowest during February. Leveraging Airbnb dynamic pricing tools or strategies based on this seasonality can significantly boost revenue. Here's a look at the typical nightly rates achieved:
- Best-in-class properties (Top 10%) command rates of $660+ per night, often due to premium features or locations.
- Strong performing properties (Top 25%) achieve nightly rates of $459 or more.
- Typical properties (Median) charge around $337 per night.
- Entry-level properties (Bottom 25%) earn around $234 per night.
Average Daily Rate (ADR) Trend by Month in Shady Side
Get Live Shady Side Market Intelligence 👇

Explore Real-time Analytics
Airbnb Seasonality Analysis & Trends in Shady Side (2025)
Peak Season (August, July, June)
- Revenue averages $7,704 per month
- Occupancy rates average 52.7%
- Daily rates average $444
Shoulder Season
- Revenue averages $4,749 per month
- Occupancy maintains around 40.5%
- Daily rates hold near $380
Low Season (January, February, November)
- Revenue drops to average $3,154 per month
- Occupancy decreases to average 34.8%
- Daily rates adjust to average $357
Seasonality Insights for Shady Side
- The Airbnb seasonality in Shady Side shows highly seasonal trends requiring careful strategy. While the sections above show seasonal averages, it's also insightful to look at the extremes:
- During the high season, the absolute peak month showcases Shady Side's highest earning potential, with monthly revenues capable of climbing to $8,646, occupancy reaching a high of 54.4%, and ADRs peaking at $451.
- Conversely, the slowest single month of the year, typically falling within the low season, marks the market's lowest point. In this month, revenue might dip to $2,530, occupancy could drop to 33.3%, and ADRs may adjust down to $329.
- Understanding both the seasonal averages and these monthly peaks and troughs in revenue, occupancy, and ADR is crucial for maximizing your Airbnb profit potential in Shady Side.
Seasonal Strategies for Maximizing Profit
- Peak Season: Maximize revenue through premium pricing and potentially longer minimum stays. Ensure high availability.
- Low Season: Offer competitive pricing, special promotions (e.g., extended stay discounts), and flexible cancellation policies. Target off-season travelers like remote workers or budget-conscious guests.
- Shoulder Seasons: Implement dynamic pricing that balances peak and low rates. Target weekend travelers or specific events. Offer slightly more flexible terms than peak season.
- Regularly analyze your own performance against these Shady Side seasonality benchmarks and adjust your pricing and availability strategy accordingly.
Best Areas for Airbnb Investment in Shady Side (2025)
Exploring the top neighborhoods for short-term rentals in Shady Side? This section highlights key areas, outlining why they are attractive for hosts and guests, along with notable local attractions. Consider these locations based on your target guest profile and investment strategy.
| Neighborhood / Area | Why Host Here? (Target Guests & Appeal) | Key Attractions & Landmarks |
|---|---|---|
| Shady Side | A charming waterfront community in Anne Arundel County known for its picturesque views and relaxed lifestyle. Ideal for vacationers seeking a peaceful retreat while being close to nature. | Sandy Point State Park, Broadneck Park, Chesapeake Bay, Shady Side Church, local seafood restaurants |
| Sandy Point | Located near the Chesapeake Bay Bridge, this area is popular with tourists for its beaches and parks, making it a great spot for short-term rentals. | Sandy Point State Park, Chesapeake Bay Bridge, local marinas, water sports and activities, picnic areas |
| North Beach | A coastal community with beautiful beaches and a boardwalk, perfect for families and travelers looking for seaside leisure. | North Beach Boardwalk, Bayside Park, local shops and cafes, beachfront activities, Marley Park |
| Deale | A small waterfront town perfect for fishing and boating enthusiasts, attracting visitors looking for outdoor adventures on the bay. | Deale Beach, local marinas, boat rentals, waterfront dining, nature trails |
| Riva | A quiet neighborhood close to Annapolis, making it appealing for visitors who want accessibility to both city vibes and nature retreats. | Broadneck Park, Parker Run Park, access to the Severn River, local dining, close proximity to Annapolis |
| Annapolis | The historic capital of Maryland known for its colonial buildings and rich history. An attractive destination for visitors exploring the area. | United States Naval Academy, Historic District, Maryland State House, Annapolis City Dock, Waterfront dining |
| Galesville | A quaint village known for its waterfront charm and community events, attracting visitors looking for a unique small-town experience. | Galesville Memorial Park, local seafood markets, waterfront views, community events, historical sites |
| Chesapeake Beach | A resort town known for its amusement park and beaches, providing family-friendly activities and making it a popular rental destination during the summer. | Chesapeake Beach Railway Museum, Breezy Point Beach, Boardwalk, water sports, town events |
Understanding Airbnb License Requirements & STR Laws in Shady Side (2025)
Yes, Shady Side, Maryland, United States enforces high STR regulations. Obtaining a license and ensuring compliance is almost certainly required according to current 2025 STR laws. Always verify the latest short term rental regulations and Airbnb license requirements directly with local government authorities for Shady Side to ensure full compliance before hosting.
(Source: AirROI data, 2025, based on 86% licensed listings)
Top Performing Airbnb Properties in Shady Side (2025)
Benchmark your potential! Explore examples of top-performing Airbnb properties in Shady Sidebased on Trailing Twelve Month (TTM) revenue. Analyze their characteristics, revenue, occupancy rate, and ADR to understand what drives success in this market.

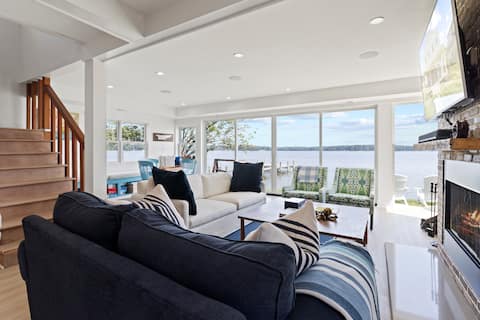
Luxe Modern Chesapeake Waterfront Oasis - 5 Star
Entire Place • 3 bedrooms
Waterfront Sanctuary only 50 Min. From DC/Balt.
Entire Place • 5 bedrooms
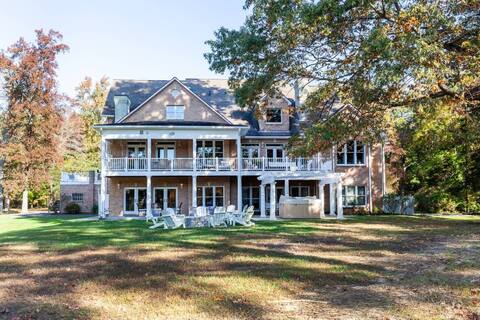
Private Estate, Hot Tub Game Room with 4 Suites
Entire Place • 6 bedrooms
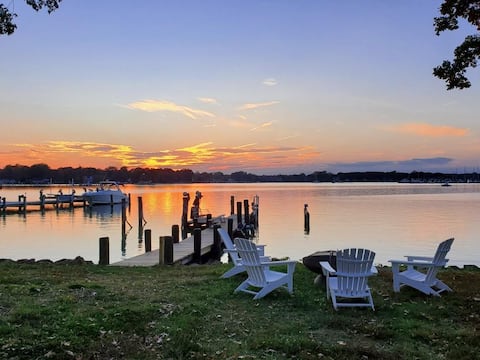
Sunset Cottage
Entire Place • 2 bedrooms

Baydream Believer -Chesapeake Bay water community
Entire Place • 3 bedrooms
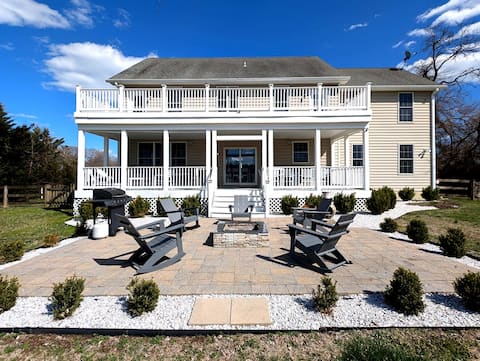
Peaceful Waterfront Getaway
Entire Place • 6 bedrooms
Note: Performance varies based on location, size, amenities, seasonality, and management quality. Data reflects the past 12 months.
Top Performing Airbnb Hosts in Shady Side (2025)
Learn from the best! This table showcases top-performing Airbnb hosts in Shady Side based on the number of properties managed and estimated total revenue over the past year. Analyze their scale and performance metrics.
| Host Name | Properties | Grossing Revenue | Stay Reviews | Avg Rating |
|---|---|---|---|---|
| Evan | 1 | $141,158 | 187 | 5.00/5.0 |
| Marc | 1 | $109,565 | 95 | 4.97/5.0 |
| Sean | 2 | $96,508 | 17 | 4.75/5.0 |
| Nicole | 1 | $89,423 | 65 | 4.98/5.0 |
| Mary & Chris | 1 | $68,839 | 44 | 4.84/5.0 |
| Matt | 1 | $63,490 | 40 | 5.00/5.0 |
| Jeff | 1 | $45,079 | 59 | 4.98/5.0 |
| Rick | 1 | $44,043 | 15 | 4.87/5.0 |
| Nikki | 1 | $37,852 | 42 | 4.98/5.0 |
| Haley | 1 | $36,372 | 59 | 4.97/5.0 |
Analyzing the strategies of top hosts, such as their property selection, pricing, and guest communication, can offer valuable lessons for optimizing your own Airbnb operations in Shady Side.
Dive Deeper: Advanced Shady Side STR Market Data (2025)
Ready to unlock more insights? AirROI provides access to advanced metrics and comprehensive Airbnb data for Shady Side. Explore detailed analytics beyond this report to refine your investment strategy, optimize pricing, and maximize your vacation rental profits.
Explore Advanced MetricsShady Side Short-Term Rental Market Composition (2025): Property & Room Types
Room Type Distribution
Property Type Distribution
Market Composition Insights for Shady Side
- The Shady Side Airbnb market composition is heavily skewed towards Entire Home/Apt listings, which make up 100% of the 21 active rentals. This indicates strong guest preference for privacy and space.
- Looking at the property type distribution in Shady Side, House properties are the most common (95.2%), reflecting the local real estate landscape.
- Houses represent a significant 95.2% portion, catering likely to families or larger groups.
- Smaller segments like others (combined 4.8%) offer potential for unique stay experiences.
Shady Side Airbnb Room Capacity Analysis (2025): Bedroom Distribution
Distribution of Listings by Number of Bedrooms
Room Capacity Insights for Shady Side
- The dominant room capacity in Shady Side is 3 bedrooms listings, making up 47.6% of the market. This suggests a strong demand for properties suitable for families or small groups.
- Together, 3 bedrooms and 4 bedrooms properties represent 66.6% of the active Airbnb listings in Shady Side, indicating a high concentration in these sizes.
- A significant 80.9% of listings offer 3+ bedrooms, catering to larger groups and families seeking more space in Shady Side.
Shady Side Vacation Rental Guest Capacity Trends (2025)
Distribution of Listings by Guest Capacity
Guest Capacity Insights for Shady Side
- The most common guest capacity trend in Shady Side vacation rentals is listings accommodating 8+ guests (47.6%). This suggests the primary traveler segment is likely larger groups.
- Properties designed for 8+ guests and 6 guests dominate the Shady Side STR market, accounting for 71.4% of listings.
- 76.2% of properties accommodate 6+ guests, serving the market segment for larger families or group travel in Shady Side.
- On average, properties in Shady Side are equipped to host 6.5 guests.
Shady Side Airbnb Booking Patterns (2025): Available vs. Booked Days
Available Days Distribution
Booked Days Distribution
Booking Pattern Insights for Shady Side
- The most common availability pattern in Shady Side falls within the 271-366 days range, representing 52.4% of listings. This suggests many properties have significant open periods on their calendars.
- Approximately 85.7% of listings show high availability (181+ days open annually), indicating potential for increased bookings or specific owner usage patterns.
- For booked days, the 91-180 days range is most frequent in Shady Side (38.1%), reflecting common guest stay durations or potential owner blocking patterns.
- A notable 14.3% of properties secure long booking periods (181+ days booked per year), highlighting successful long-term rental strategies or significant owner usage.
Shady Side Airbnb Minimum Stay Requirements Analysis
Distribution of Listings by Minimum Night Requirement
1 Night
3 listings
14.3% of total
2 Nights
6 listings
28.6% of total
3 Nights
4 listings
19% of total
30+ Nights
8 listings
38.1% of total
Key Insights
- The most prevalent minimum stay requirement in Shady Side is 30+ Nights, adopted by 38.1% of listings. This highlights the market's preference for longer commitments.
- A significant segment (38.1%) caters to monthly stays (30+ nights) in Shady Side, pointing to opportunities in the extended-stay market.
Recommendations
- Align with the market by considering a 30+ Nights minimum stay, as 38.1% of Shady Side hosts use this setting.
- If feasible, allowing 1-night stays, especially midweek or during low season, could capture last-minute bookings, as only 14.3% currently do.
- Explore offering discounts for stays of 30+ nights to attract the 38.1% of the market seeking extended stays.
- Adjust minimum nights based on seasonality – potentially shorter during low season and longer during peak demand periods in Shady Side.
Shady Side Airbnb Cancellation Policy Trends Analysis (2025)
Flexible
2 listings
9.5% of total
Moderate
5 listings
23.8% of total
Firm
9 listings
42.9% of total
Strict
5 listings
23.8% of total
Cancellation Policy Insights for Shady Side
- The prevailing Airbnb cancellation policy trend in Shady Side is Firm, used by 42.9% of listings.
- A majority (66.7%) of hosts in Shady Side utilize Firm or Strict policies, indicating a market where hosts prioritize booking security.
Recommendations for Hosts
- Consider adopting a Firm policy to align with the 42.9% market standard in Shady Side.
- Regularly review your cancellation policy against competitors and market demand shifts in Shady Side.
Shady Side STR Booking Lead Time Analysis (2025)
Average Booking Lead Time by Month
Booking Lead Time Insights for Shady Side
- The overall average booking lead time for vacation rentals in Shady Side is 44 days.
- Guests book furthest in advance for stays during June (average 72 days), likely coinciding with peak travel demand or local events.
- The shortest booking windows occur for stays in January (average 20 days), indicating more last-minute travel plans during this time.
- Seasonally, Summer (59 days avg.) sees the longest lead times, while Winter (31 days avg.) has the shortest, reflecting typical travel planning cycles.
Recommendations for Hosts
- Use the overall average lead time (44 days) as a baseline for your pricing and availability strategy in Shady Side.
- For June stays, consider implementing length-of-stay discounts or slightly higher rates for bookings made less than 72 days out to capitalize on advance planning.
- Target marketing efforts for the Summer season well in advance (at least 59 days) to capture early planners.
- Monitor your own booking lead times against these Shady Side averages to identify opportunities for dynamic pricing adjustments.
Popular & Essential Airbnb Amenities in Shady Side (2025)
Amenity Prevalence
Amenity Insights for Shady Side
- Essential amenities in Shady Side that guests expect include: Wifi, Smoke alarm, TV, Heating, Hot water, Kitchen, Free parking on premises, Air conditioning, Coffee maker, Refrigerator. Lacking these (any) could significantly impact bookings.
Recommendations for Hosts
- Ensure your listing includes all essential amenities for Shady Side: Wifi, Smoke alarm, TV, Heating, Hot water, Kitchen, Free parking on premises, Air conditioning, Coffee maker, Refrigerator.
- Prioritize adding missing essentials: Coffee maker, Refrigerator.
- Highlight unique or less common amenities you offer (e.g., hot tub, dedicated workspace, EV charger) in your listing description and photos.
- Regularly check competitor amenities in Shady Side to stay competitive.
Shady Side Airbnb Guest Demographics & Profile Analysis (2025)
Guest Profile Summary for Shady Side
- The typical guest profile for Airbnb in Shady Side consists of primarily domestic travelers (88%), often arriving from nearby Washington, typically belonging to the Post-2000s (Gen Z/Alpha) group (50%), primarily speaking English or Spanish.
- Domestic travelers account for 88.3% of guests.
- Key international markets include United States (88.3%) and DC (10.5%).
- Top languages spoken are English (72.5%) followed by Spanish (9.9%).
- A significant demographic segment is the Post-2000s (Gen Z/Alpha) group, representing 50% of guests.
Recommendations for Hosts
- Target domestic marketing efforts towards travelers from Washington and New York.
- Tailor amenities and listing descriptions to appeal to the dominant Post-2000s (Gen Z/Alpha) demographic (e.g., highlight fast WiFi, smart home features, local guides).
- Highlight unique local experiences or amenities relevant to the primary guest profile.
- Consider seasonal promotions aligned with peak travel times for key origin markets.
Nearby Short-Term Rental Market Comparison
How does the Shady Side Airbnb market stack up against its neighbors? Compare key performance metrics like average monthly revenue, ADR, and occupancy rates in surrounding areas to understand the broader regional STR landscape.
| Market | Active Properties | Monthly Revenue | Daily Rate | Avg. Occupancy |
|---|---|---|---|---|
| Centreville | 16 | $6,145 | $599.99 | 42% |
| Mayo | 14 | $5,935 | $459.51 | 47% |
| Stevensville | 78 | $5,817 | $572.74 | 40% |
| Shannondale | 48 | $5,591 | $328.04 | 56% |
| Lower Windsor Township | 14 | $5,163 | $436.59 | 47% |
| Arundel on the Bay | 31 | $5,161 | $502.88 | 39% |
| Easton | 43 | $5,117 | $665.12 | 38% |
| Mineral | 201 | $5,065 | $473.03 | 35% |
| Bumpass | 100 | $5,015 | $559.63 | 32% |
| Chester | 17 | $4,906 | $513.17 | 41% |