Potomac Airbnb Market Analysis 2026: Short Term Rental Data & Vacation Rental Statistics in Maryland, United States
Is Airbnb profitable in Potomac in 2026? Explore comprehensive Airbnb analytics for Potomac, Maryland, United States to uncover income potential. This 2026 STR market report for Potomac, based on AirROI data from February 2025 to January 2026, reveals key trends in the niche market of 21 active listings.
Whether you're considering an Airbnb investment in Potomac, optimizing your existing vacation rental, or exploring rental arbitrage opportunities, understanding the Potomac Airbnb data is crucial. Leveraging the low regulation environment is key to maximizing your short term rental income potential. Let's dive into the specifics.
Key Potomac Airbnb Performance Metrics Overview
Monthly Airbnb Revenue Variations & Income Potential in Potomac (2026)
Understanding the monthly revenue variations for Airbnb listings in Potomac is key to maximizing your short term rental income potential. Seasonality significantly impacts earnings. Our analysis, based on data from the past 12 months, shows that the peak revenue month for STRs in Potomac is typically January, while April often presents the lowest earnings, highlighting opportunities for strategic pricing adjustments during shoulder and low seasons. Explore the typical Airbnb income in Potomac across different performance tiers:
- Best-in-class properties (Top 10%) achieve $8,488+ monthly, often utilizing dynamic pricing and superior guest experiences.
- Strong performing properties (Top 25%) earn $5,047 or more, indicating effective management and desirable locations/amenities.
- Typical properties (Median) generate around $1,532 per month, representing the average market performance.
- Entry-level properties (Bottom 25%) see earnings around $688, often with potential for optimization.
Average Monthly Airbnb Earnings Trend in Potomac
Potomac Airbnb Occupancy Rate Trends (2026)
Maximize your bookings by understanding the Potomac STR occupancy trends. Seasonal demand shifts significantly influence how often properties are booked. Typically, Januarysees the highest demand (peak season occupancy), while December experiences the lowest (low season). Effective strategies, like adjusting minimum stays or offering promotions, can boost occupancy during slower periods. Here's how different property tiers perform in Potomac:
- Best-in-class properties (Top 10%) achieve 84%+ occupancy, indicating high desirability and potentially optimized availability.
- Strong performing properties (Top 25%) maintain 71% or higher occupancy, suggesting good market fit and guest satisfaction.
- Typical properties (Median) have an occupancy rate around 34%.
- Entry-level properties (Bottom 25%) average 15% occupancy, potentially facing higher vacancy.
Average Monthly Occupancy Rate Trend in Potomac
Average Daily Rate (ADR) Airbnb Trends in Potomac (2026)
Effective short term rental pricing strategy in Potomac involves understanding monthly ADR fluctuations. The Average Daily Rate (ADR) for Airbnb in Potomac typically peaks in September and dips lowest during August. Leveraging Airbnb dynamic pricing tools or strategies based on this seasonality can significantly boost revenue. Here's a look at the typical nightly rates achieved:
- Best-in-class properties (Top 10%) command rates of $843+ per night, often due to premium features or locations.
- Strong performing properties (Top 25%) achieve nightly rates of $351 or more.
- Typical properties (Median) charge around $127 per night.
- Entry-level properties (Bottom 25%) earn around $65 per night.
Average Daily Rate (ADR) Trend by Month in Potomac
Get Live Potomac Market Intelligence 👇

Explore Real-time Analytics
Airbnb Seasonality Analysis & Trends in Potomac (2026)
Peak Season (January, November, October)
- Revenue averages $4,144 per month
- Occupancy rates average 45.2%
- Daily rates average $375
Shoulder Season
- Revenue averages $3,379 per month
- Occupancy maintains around 43.0%
- Daily rates hold near $348
Low Season (April, June, July)
- Revenue drops to average $2,363 per month
- Occupancy decreases to average 37.7%
- Daily rates adjust to average $327
Seasonality Insights for Potomac
- The Airbnb seasonality in Potomac shows highly seasonal trends requiring careful strategy. While the sections above show seasonal averages, it's also insightful to look at the extremes:
- During the high season, the absolute peak month showcases Potomac's highest earning potential, with monthly revenues capable of climbing to $4,397, occupancy reaching a high of 52.7%, and ADRs peaking at $393.
- Conversely, the slowest single month of the year, typically falling within the low season, marks the market's lowest point. In this month, revenue might dip to $1,984, occupancy could drop to 32.3%, and ADRs may adjust down to $321.
- Understanding both the seasonal averages and these monthly peaks and troughs in revenue, occupancy, and ADR is crucial for maximizing your Airbnb profit potential in Potomac.
Seasonal Strategies for Maximizing Profit
- Peak Season: Maximize revenue through premium pricing and potentially longer minimum stays. Ensure high availability.
- Low Season: Offer competitive pricing, special promotions (e.g., extended stay discounts), and flexible cancellation policies. Target off-season travelers like remote workers or budget-conscious guests.
- Shoulder Seasons: Implement dynamic pricing that balances peak and low rates. Target weekend travelers or specific events. Offer slightly more flexible terms than peak season.
- Regularly analyze your own performance against these Potomac seasonality benchmarks and adjust your pricing and availability strategy accordingly.
Best Areas for Airbnb Investment in Potomac (2026)
Exploring the top neighborhoods for short-term rentals in Potomac? This section highlights key areas, outlining why they are attractive for hosts and guests, along with notable local attractions. Consider these locations based on your target guest profile and investment strategy.
| Neighborhood / Area | Why Host Here? (Target Guests & Appeal) | Key Attractions & Landmarks |
|---|---|---|
| Potomac Village | A charming locale known for its affluent residential communities and proximity to Washington D.C. It attracts visitors looking for a serene suburban experience while being close to urban amenities. | Potomac Village Shopping Center, Great Falls Park, The Glenview Mansion, River Falls Park, Billingsley Manor |
| West Montgomery County | This area offers a blend of natural beauty and suburban comfort, making it appealing for families and tourists who enjoy nature activities. | C&O Canal National Historical Park, Seneca Creek State Park, Lake Needwood, The Potomac Horse Center, Olney Theatre Center |
| Cabin John | Known for its picturesque views and access to parks, Cabin John is perfect for those seeking outdoor adventures and family-friendly activities. | Cabin John Regional Park, The Adventure Park at Sandy Spring, Cabin John Village, Potomac River, Ballantrae Park |
| Glen Echo | A historic district with an artistic vibe, Glen Echo attracts visitors interested in the arts and culture while being close to the nature of the C&O Canal. | Glen Echo Park, The Spanish Ballroom, The Puppet Co. Playhouse, Glen Echo Park Aquarium, C&O Canal Towpath |
| Mather Gorge | Offers stunning natural scenery and outdoor activities, attracting avid hikers and nature enthusiasts to the area. | Mather Gorge, Great Falls Park, C&O Canal, Billy Goat Trail, Riverbend Park |
| North Potomac | Known as a family-friendly community, it offers good schools and parks, attracting visitors for family-oriented stays. | North Potomac Park, Fallsgrove Village Center, Lakewood Country Club, Needwood Lake, Potomac Community Center |
| Darnestown | A quiet suburban area known for its spacious homes and rural atmosphere, appealing to those looking for peace and quiet near the hustle of D.C. | Darnestown Historical Society, Seneca Creek State Park, Darnestown Park, Sugarloaf Mountain, Beltway Plaza |
| Travilah | A suburban area featuring lovely homes and access to parks, drawing visitors who appreciate tranquility and nature. | Travilah Square, Lake Needwood, Rocky Hill Park, The Mall at Potomac, Sugarloaf Mountain |
Understanding Airbnb License Requirements & STR Laws in Potomac (2026)
While Potomac, Maryland, United States currently shows low STR regulations, specific Airbnb license requirements might still exist or change. Always verify the latest short term rental regulations and Airbnb license requirements directly with local government authorities for Potomac to ensure full compliance before hosting.
(Source: AirROI data, 2026, finding no licensed listings among those analyzed)
Top Performing Airbnb Properties in Potomac (2026)
Benchmark your potential! Explore examples of top-performing Airbnb properties in Potomacbased on Trailing Twelve Month (TTM) revenue. Analyze their characteristics, revenue, occupancy rate, and ADR to understand what drives success in this market.
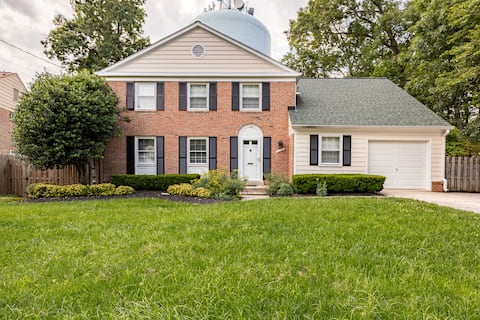
Cozy home in the Potomac MD Right off 270 exit
Entire Place • 5 bedrooms

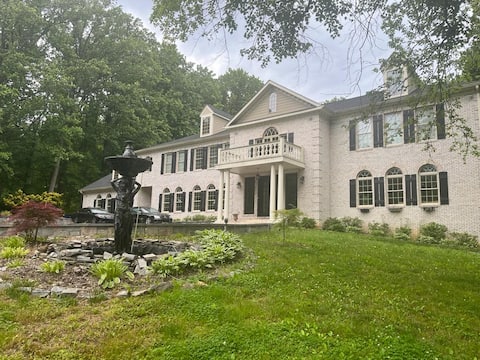
Potomac Mansion Close to Nature, Culture & DC
Entire Place • 5 bedrooms
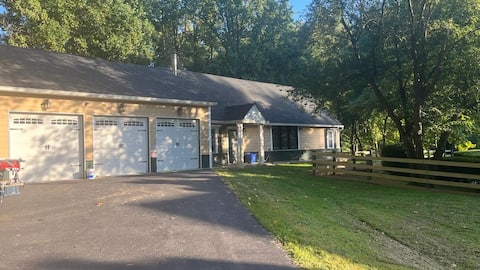
Potomac Maryland Estate 2
Entire Place • 6 bedrooms
Stunning Man Cave Potomac Maryland
Entire Place • 2 bedrooms

Vibrant Apartment in Bethesda.
Entire Place • 2 bedrooms

Elegant Georgian house in Potomac Maryland
Entire Place • 6 bedrooms
Note: Performance varies based on location, size, amenities, seasonality, and management quality. Data reflects the past 12 months.
Top Performing Airbnb Hosts in Potomac (2026)
Learn from the best! This table showcases top-performing Airbnb hosts in Potomac based on the number of properties managed and estimated total revenue over the past year. Analyze their scale and performance metrics.
| Host Name | Properties | Grossing Revenue | Stay Reviews | Avg Rating |
|---|---|---|---|---|
| Andres Muñoz | 2 | $73,870 | 5 | 5.00/5.0 |
| Arnold | 1 | $72,994 | 131 | 4.93/5.0 |
| Chelsea | 1 | $69,038 | 35 | 4.97/5.0 |
| Luz Elizabeth | 1 | $21,470 | 72 | 4.94/5.0 |
| Bijan | 1 | $16,816 | 5 | 4.60/5.0 |
| Carole | 3 | $15,941 | 272 | 4.98/5.0 |
| Barbara | 1 | $14,718 | 194 | 4.96/5.0 |
| Holli | 1 | $10,685 | 5 | 5.00/5.0 |
| Al | 1 | $7,405 | 53 | 4.62/5.0 |
| Oona | 1 | $6,213 | 8 | 5.00/5.0 |
Analyzing the strategies of top hosts, such as their property selection, pricing, and guest communication, can offer valuable lessons for optimizing your own Airbnb operations in Potomac.
Dive Deeper: Advanced Potomac STR Market Data (2026)
Ready to unlock more insights? AirROI provides access to advanced metrics and comprehensive Airbnb data for Potomac. Explore detailed analytics beyond this report to refine your investment strategy, optimize pricing, and maximize your vacation rental profits.
Explore Advanced MetricsPotomac Short-Term Rental Market Composition (2026): Property & Room Types
Room Type Distribution
Property Type Distribution
Market Composition Insights for Potomac
- The Potomac Airbnb market composition is heavily skewed towards Entire Home/Apt listings, which make up 61.9% of the 21 active rentals. This indicates strong guest preference for privacy and space.
- However, a notable 38.1% share for Private Rooms suggests opportunities for budget-conscious travelers or hosts renting out spare rooms.
- Looking at the property type distribution in Potomac, House properties are the most common (81%), reflecting the local real estate landscape.
- Houses represent a significant 81% portion, catering likely to families or larger groups.
- Smaller segments like hotel/boutique (combined 4.8%) offer potential for unique stay experiences.
Potomac Airbnb Room Capacity Analysis (2026): Bedroom Distribution
Distribution of Listings by Number of Bedrooms
Room Capacity Insights for Potomac
- The dominant room capacity in Potomac is 5+ bedrooms listings, making up 23.8% of the market. This suggests a strong demand for properties suitable for families or small groups.
- Together, 5+ bedrooms and 1 bedroom properties represent 38.1% of the active Airbnb listings in Potomac, indicating a high concentration in these sizes.
- A significant 38.1% of listings offer 3+ bedrooms, catering to larger groups and families seeking more space in Potomac.
Potomac Vacation Rental Guest Capacity Trends (2026)
Distribution of Listings by Guest Capacity
Guest Capacity Insights for Potomac
- The most common guest capacity trend in Potomac vacation rentals is listings accommodating 8+ guests (33.3%). This suggests the primary traveler segment is likely larger groups.
- Properties designed for 8+ guests and 4 guests dominate the Potomac STR market, accounting for 42.8% of listings.
- 33.3% of properties accommodate 6+ guests, serving the market segment for larger families or group travel in Potomac.
- On average, properties in Potomac are equipped to host 3.9 guests.
Potomac Airbnb Booking Patterns (2026): Available vs. Booked Days
Available Days Distribution
Booked Days Distribution
Booking Pattern Insights for Potomac
- The most common availability pattern in Potomac falls within the 271-366 days range, representing 66.7% of listings. This suggests many properties have significant open periods on their calendars.
- Approximately 90.5% of listings show high availability (181+ days open annually), indicating potential for increased bookings or specific owner usage patterns.
- For booked days, the 31-90 days range is most frequent in Potomac (33.3%), reflecting common guest stay durations or potential owner blocking patterns.
- A notable 9.6% of properties secure long booking periods (181+ days booked per year), highlighting successful long-term rental strategies or significant owner usage.
Potomac Airbnb Minimum Stay Requirements Analysis
Distribution of Listings by Minimum Night Requirement
1 Night
4 listings
19% of total
2 Nights
1 listings
4.8% of total
3 Nights
3 listings
14.3% of total
4-6 Nights
1 listings
4.8% of total
7-29 Nights
3 listings
14.3% of total
30+ Nights
9 listings
42.9% of total
Key Insights
- The most prevalent minimum stay requirement in Potomac is 30+ Nights, adopted by 42.9% of listings. This highlights the market's preference for longer commitments.
- A significant segment (42.9%) caters to monthly stays (30+ nights) in Potomac, pointing to opportunities in the extended-stay market.
Recommendations
- Align with the market by considering a 30+ Nights minimum stay, as 42.9% of Potomac hosts use this setting.
- If feasible, allowing 1-night stays, especially midweek or during low season, could capture last-minute bookings, as only 19% currently do.
- Explore offering discounts for stays of 30+ nights to attract the 42.9% of the market seeking extended stays.
- Adjust minimum nights based on seasonality – potentially shorter during low season and longer during peak demand periods in Potomac.
Potomac Airbnb Cancellation Policy Trends Analysis (2026)
Flexible
5 listings
23.8% of total
Moderate
4 listings
19% of total
Firm
11 listings
52.4% of total
Strict
1 listings
4.8% of total
Cancellation Policy Insights for Potomac
- The prevailing Airbnb cancellation policy trend in Potomac is Firm, used by 52.4% of listings.
- A majority (57.2%) of hosts in Potomac utilize Firm or Strict policies, indicating a market where hosts prioritize booking security.
- Strict cancellation policies are quite rare (4.8%), potentially making listings with this policy less competitive unless justified by high demand or property type.
Recommendations for Hosts
- Consider adopting a Firm policy to align with the 52.4% market standard in Potomac.
- Using a Strict policy might deter some guests, as only 4.8% of listings use it. Evaluate if potential revenue protection outweighs possible lower booking rates.
- Regularly review your cancellation policy against competitors and market demand shifts in Potomac.
Potomac STR Booking Lead Time Analysis (2026)
Average Booking Lead Time by Month
Booking Lead Time Insights for Potomac
- The overall average booking lead time for vacation rentals in Potomac is 35 days.
- Guests book furthest in advance for stays during July (average 71 days), likely coinciding with peak travel demand or local events.
- The shortest booking windows occur for stays in October (average 18 days), indicating more last-minute travel plans during this time.
- Seasonally, Summer (51 days avg.) sees the longest lead times, while Winter (33 days avg.) has the shortest, reflecting typical travel planning cycles.
Recommendations for Hosts
- Use the overall average lead time (35 days) as a baseline for your pricing and availability strategy in Potomac.
- For July stays, consider implementing length-of-stay discounts or slightly higher rates for bookings made less than 71 days out to capitalize on advance planning.
- Target marketing efforts for the Summer season well in advance (at least 51 days) to capture early planners.
- Monitor your own booking lead times against these Potomac averages to identify opportunities for dynamic pricing adjustments.
Popular & Essential Airbnb Amenities in Potomac (2026)
Amenity Prevalence
Amenity Insights for Potomac
- Essential amenities in Potomac that guests expect include: Wifi, Air conditioning, Smoke alarm, Kitchen. Lacking these (any) could significantly impact bookings.
- Popular amenities like Free parking on premises, Washer, TV are common but not universal. Offering these can provide a competitive edge.
Recommendations for Hosts
- Ensure your listing includes all essential amenities for Potomac: Wifi, Air conditioning, Smoke alarm, Kitchen.
- Prioritize adding missing essentials: Air conditioning, Smoke alarm, Kitchen.
- Consider adding popular differentiators like Free parking on premises or Washer to increase appeal.
- Highlight unique or less common amenities you offer (e.g., hot tub, dedicated workspace, EV charger) in your listing description and photos.
- Regularly check competitor amenities in Potomac to stay competitive.
Potomac Airbnb Guest Demographics & Profile Analysis (2026)
Guest Profile Summary for Potomac
- The typical guest profile for Airbnb in Potomac consists of primarily domestic travelers (83%), often arriving from nearby Pittsburgh, typically belonging to the Post-2000s (Gen Z/Alpha) group (50%), primarily speaking English or Spanish.
- Domestic travelers account for 82.7% of guests.
- Key international markets include United States (82.7%) and United Kingdom (5.8%).
- Top languages spoken are English (66.7%) followed by Spanish (13.3%).
- A significant demographic segment is the Post-2000s (Gen Z/Alpha) group, representing 50% of guests.
Recommendations for Hosts
- Target domestic marketing efforts towards travelers from Pittsburgh and Washington.
- Tailor amenities and listing descriptions to appeal to the dominant Post-2000s (Gen Z/Alpha) demographic (e.g., highlight fast WiFi, smart home features, local guides).
- Highlight unique local experiences or amenities relevant to the primary guest profile.
- Consider seasonal promotions aligned with peak travel times for key origin markets.
Nearby Short-Term Rental Market Comparison
How does the Potomac Airbnb market stack up against its neighbors? Compare key performance metrics like average monthly revenue, ADR, and occupancy rates in surrounding areas to understand the broader regional STR landscape.
| Market | Active Properties | Monthly Revenue | Daily Rate | Avg. Occupancy |
|---|---|---|---|---|
| Polk Township | 15 | $6,974 | $520.26 | 38% |
| Lemont | 21 | $6,940 | $873.93 | 37% |
| College Township | 83 | $6,551 | $848.63 | 36% |
| Centreville | 17 | $6,298 | $565.66 | 45% |
| McGaheysville | 83 | $6,156 | $431.72 | 45% |
| State College | 192 | $6,081 | $712.29 | 40% |
| Mayo | 13 | $5,915 | $447.58 | 51% |
| Shannondale | 45 | $5,808 | $337.30 | 54% |
| Hellam Township | 24 | $5,496 | $386.69 | 45% |
| Stevensville | 80 | $5,412 | $556.79 | 41% |