Pasadena Airbnb Market Analysis 2026: Short Term Rental Data & Vacation Rental Statistics in Maryland, United States
Is Airbnb profitable in Pasadena in 2026? Explore comprehensive Airbnb analytics for Pasadena, Maryland, United States to uncover income potential. This 2026 STR market report for Pasadena, based on AirROI data from February 2025 to January 2026, reveals key trends in the niche market of 21 active listings.
Whether you're considering an Airbnb investment in Pasadena, optimizing your existing vacation rental, or exploring rental arbitrage opportunities, understanding the Pasadena Airbnb data is crucial. Navigating the high regulation landscape is key to maximizing your short term rental income potential. Let's dive into the specifics.
Key Pasadena Airbnb Performance Metrics Overview
Monthly Airbnb Revenue Variations & Income Potential in Pasadena (2026)
Understanding the monthly revenue variations for Airbnb listings in Pasadena is key to maximizing your short term rental income potential. Seasonality significantly impacts earnings. Our analysis, based on data from the past 12 months, shows that the peak revenue month for STRs in Pasadena is typically July, while February often presents the lowest earnings, highlighting opportunities for strategic pricing adjustments during shoulder and low seasons. Explore the typical Airbnb income in Pasadena across different performance tiers:
- Best-in-class properties (Top 10%) achieve $8,685+ monthly, often utilizing dynamic pricing and superior guest experiences.
- Strong performing properties (Top 25%) earn $6,038 or more, indicating effective management and desirable locations/amenities.
- Typical properties (Median) generate around $4,010 per month, representing the average market performance.
- Entry-level properties (Bottom 25%) see earnings around $2,590, often with potential for optimization.
Average Monthly Airbnb Earnings Trend in Pasadena
Pasadena Airbnb Occupancy Rate Trends (2026)
Maximize your bookings by understanding the Pasadena STR occupancy trends. Seasonal demand shifts significantly influence how often properties are booked. Typically, Julysees the highest demand (peak season occupancy), while January experiences the lowest (low season). Effective strategies, like adjusting minimum stays or offering promotions, can boost occupancy during slower periods. Here's how different property tiers perform in Pasadena:
- Best-in-class properties (Top 10%) achieve 79%+ occupancy, indicating high desirability and potentially optimized availability.
- Strong performing properties (Top 25%) maintain 64% or higher occupancy, suggesting good market fit and guest satisfaction.
- Typical properties (Median) have an occupancy rate around 41%.
- Entry-level properties (Bottom 25%) average 28% occupancy, potentially facing higher vacancy.
Average Monthly Occupancy Rate Trend in Pasadena
Average Daily Rate (ADR) Airbnb Trends in Pasadena (2026)
Effective short term rental pricing strategy in Pasadena involves understanding monthly ADR fluctuations. The Average Daily Rate (ADR) for Airbnb in Pasadena typically peaks in September and dips lowest during February. Leveraging Airbnb dynamic pricing tools or strategies based on this seasonality can significantly boost revenue. Here's a look at the typical nightly rates achieved:
- Best-in-class properties (Top 10%) command rates of $680+ per night, often due to premium features or locations.
- Strong performing properties (Top 25%) achieve nightly rates of $471 or more.
- Typical properties (Median) charge around $319 per night.
- Entry-level properties (Bottom 25%) earn around $212 per night.
Average Daily Rate (ADR) Trend by Month in Pasadena
Get Live Pasadena Market Intelligence 👇

Explore Real-time Analytics
Airbnb Seasonality Analysis & Trends in Pasadena (2026)
Peak Season (July, August, June)
- Revenue averages $6,848 per month
- Occupancy rates average 60.6%
- Daily rates average $369
Shoulder Season
- Revenue averages $4,418 per month
- Occupancy maintains around 41.6%
- Daily rates hold near $363
Low Season (January, February, April)
- Revenue drops to average $2,821 per month
- Occupancy decreases to average 37.1%
- Daily rates adjust to average $338
Seasonality Insights for Pasadena
- The Airbnb seasonality in Pasadena shows highly seasonal trends requiring careful strategy. While the sections above show seasonal averages, it's also insightful to look at the extremes:
- During the high season, the absolute peak month showcases Pasadena's highest earning potential, with monthly revenues capable of climbing to $7,921, occupancy reaching a high of 64.5%, and ADRs peaking at $381.
- Conversely, the slowest single month of the year, typically falling within the low season, marks the market's lowest point. In this month, revenue might dip to $2,334, occupancy could drop to 30.5%, and ADRs may adjust down to $313.
- Understanding both the seasonal averages and these monthly peaks and troughs in revenue, occupancy, and ADR is crucial for maximizing your Airbnb profit potential in Pasadena.
Seasonal Strategies for Maximizing Profit
- Peak Season: Maximize revenue through premium pricing and potentially longer minimum stays. Ensure high availability.
- Low Season: Offer competitive pricing, special promotions (e.g., extended stay discounts), and flexible cancellation policies. Target off-season travelers like remote workers or budget-conscious guests.
- Shoulder Seasons: Implement dynamic pricing that balances peak and low rates. Target weekend travelers or specific events. Offer slightly more flexible terms than peak season.
- Regularly analyze your own performance against these Pasadena seasonality benchmarks and adjust your pricing and availability strategy accordingly.
Best Areas for Airbnb Investment in Pasadena (2026)
Exploring the top neighborhoods for short-term rentals in Pasadena? This section highlights key areas, outlining why they are attractive for hosts and guests, along with notable local attractions. Consider these locations based on your target guest profile and investment strategy.
| Neighborhood / Area | Why Host Here? (Target Guests & Appeal) | Key Attractions & Landmarks |
|---|---|---|
| Pasadena Park | A family-friendly neighborhood with access to parks and community events. Attracts families and tourists looking for a quieter, suburban experience while still close to attractions. | Broadneck Park, Pasadena Community Library, Lakeshore Drive Park, Pasadena Marketplace, Local restaurants and cafes |
| Magothy River | A scenic area with waterfront properties and a relaxed lifestyle. Popular for travelers who enjoy nature, kayaking, and outdoor activities. | Magothy River Park, Sandy Point State Park, Broadneck Park, Local marinas, Waterfront dining options |
| Chesapeake Conservancy | Surrounded by nature conservancies and wildlife areas, this area appeals to eco-tourists and those looking for outdoor adventures. | Chesapeake Bay Environmental Center, Bayside History Museum, Nature trails, Fishing spots, Kayaking opportunities |
| Downtown Pasadena | The heart of the city with shopping, dining, and essential services. Great for travelers looking for convenience and local culture. | Pasadena Plaza, Pasadena Farmer's Market, Local boutiques and shops, Restaurants and cafes, Nearby movie theaters |
| Lake Shore | A picturesque lakeside community perfect for guests seeking water activities and a cozy atmosphere. | Lake Shore Park, Local fishing spots, Lakeside dining, Nature trails, Community events |
| North Pasadena | An up-and-coming neighborhood that combines suburban charm with access to local amenities and parks, appealing to both families and young professionals. | North Pasadena Park, Local schools and shops, Recreational facilities, Community centers, Parks and playgrounds |
| Severna Park | A short drive from Pasadena, Severna Park is known for its excellent schools and family-friendly atmosphere, making it attractive to those with children. | Severna Park Library, Sandy Point State Park near Severna Park, Local parks, Shops and restaurants, Recreational facilities |
| South County | A charming area with a mix of suburban and rural lifestyles, popular for those looking to escape the hustle and bustle of the city while still having access to amenities. | South River Farm Park, Local wineries, Nature trails, Community farms, Historic sites |
Understanding Airbnb License Requirements & STR Laws in Pasadena (2026)
Yes, Pasadena, Maryland, United States enforces high STR regulations. Obtaining a license and ensuring compliance is almost certainly required according to current 2026 STR laws. Always verify the latest short term rental regulations and Airbnb license requirements directly with local government authorities for Pasadena to ensure full compliance before hosting.
(Source: AirROI data, 2026, based on 100% licensed listings)
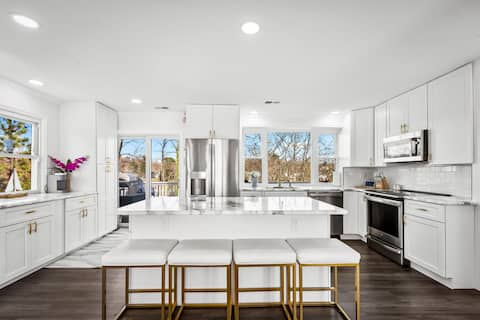
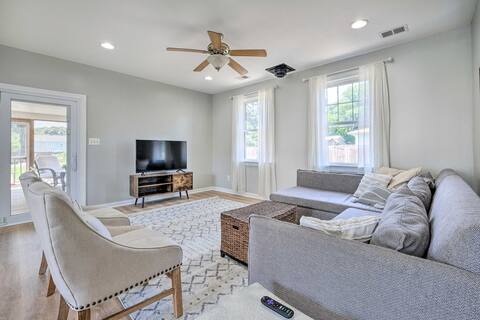
Top Performing Airbnb Properties in Pasadena (2026)
Benchmark your potential! Explore examples of top-performing Airbnb properties in Pasadenabased on Trailing Twelve Month (TTM) revenue. Analyze their characteristics, revenue, occupancy rate, and ADR to understand what drives success in this market.
Waterfront 5 Bedroom Near BWI/Annapolis/Baltimore
Entire Place • 5 bedrooms

Luxury getaway- fire pit, hot tub, waterfront
Entire Place • 4 bedrooms

Beautiful Home Near Beach and Patapsco River
Entire Place • 4 bedrooms
Idyllic Pasadena Retreat with Garden + Hot Tub!
Entire Place • 3 bedrooms
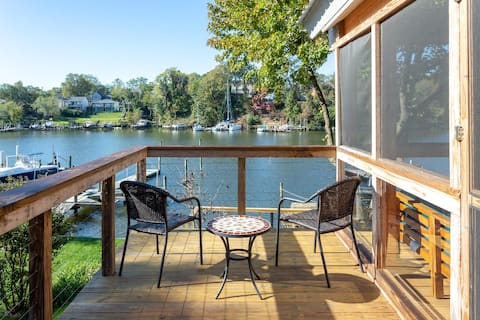
12 M to Naval Academy | Waterfront Paradise
Entire Place • 2 bedrooms

Beautiful Waterfront Home With Theater Room
Entire Place • 4 bedrooms
Note: Performance varies based on location, size, amenities, seasonality, and management quality. Data reflects the past 12 months.
Top Performing Airbnb Hosts in Pasadena (2026)
Learn from the best! This table showcases top-performing Airbnb hosts in Pasadena based on the number of properties managed and estimated total revenue over the past year. Analyze their scale and performance metrics.
| Host Name | Properties | Grossing Revenue | Stay Reviews | Avg Rating |
|---|---|---|---|---|
| Evolve | 2 | $116,300 | 133 | 4.75/5.0 |
| Patrick | 1 | $110,677 | 53 | 4.96/5.0 |
| Tammy | 1 | $80,918 | 47 | 4.96/5.0 |
| Hieu | 1 | $75,758 | 82 | 4.88/5.0 |
| Dee | 1 | $62,576 | 165 | 4.96/5.0 |
| Harold | 1 | $56,379 | 117 | 4.87/5.0 |
| Melinda | 1 | $52,970 | 89 | 4.98/5.0 |
| Gia | 1 | $52,346 | 70 | 4.81/5.0 |
| Jeanne | 1 | $50,081 | 40 | 4.98/5.0 |
| Vincente | 1 | $46,644 | 86 | 4.81/5.0 |
Analyzing the strategies of top hosts, such as their property selection, pricing, and guest communication, can offer valuable lessons for optimizing your own Airbnb operations in Pasadena.
Dive Deeper: Advanced Pasadena STR Market Data (2026)
Ready to unlock more insights? AirROI provides access to advanced metrics and comprehensive Airbnb data for Pasadena. Explore detailed analytics beyond this report to refine your investment strategy, optimize pricing, and maximize your vacation rental profits.
Explore Advanced MetricsPasadena Short-Term Rental Market Composition (2026): Property & Room Types
Room Type Distribution
Property Type Distribution
Market Composition Insights for Pasadena
- The Pasadena Airbnb market composition is heavily skewed towards Entire Home/Apt listings, which make up 95.2% of the 21 active rentals. This indicates strong guest preference for privacy and space.
- Looking at the property type distribution in Pasadena, House properties are the most common (81%), reflecting the local real estate landscape.
- Houses represent a significant 81% portion, catering likely to families or larger groups.
- Smaller segments like others, apartment/condo, outdoor/unique, hotel/boutique (combined 19.2%) offer potential for unique stay experiences.
Pasadena Airbnb Room Capacity Analysis (2026): Bedroom Distribution
Distribution of Listings by Number of Bedrooms
Room Capacity Insights for Pasadena
- The dominant room capacity in Pasadena is 4 bedrooms listings, making up 33.3% of the market. This suggests a strong demand for properties suitable for families or small groups.
- Together, 4 bedrooms and 3 bedrooms properties represent 57.1% of the active Airbnb listings in Pasadena, indicating a high concentration in these sizes.
- A significant 66.6% of listings offer 3+ bedrooms, catering to larger groups and families seeking more space in Pasadena.
Pasadena Vacation Rental Guest Capacity Trends (2026)
Distribution of Listings by Guest Capacity
Guest Capacity Insights for Pasadena
- The most common guest capacity trend in Pasadena vacation rentals is listings accommodating 8+ guests (52.4%). This suggests the primary traveler segment is likely larger groups.
- Properties designed for 8+ guests and 6 guests dominate the Pasadena STR market, accounting for 66.7% of listings.
- 66.7% of properties accommodate 6+ guests, serving the market segment for larger families or group travel in Pasadena.
- On average, properties in Pasadena are equipped to host 6.0 guests.
Pasadena Airbnb Booking Patterns (2026): Available vs. Booked Days
Available Days Distribution
Booked Days Distribution
Booking Pattern Insights for Pasadena
- The most common availability pattern in Pasadena falls within the 181-270 days range, representing 47.6% of listings. This suggests many properties have significant open periods on their calendars.
- Approximately 76.2% of listings show high availability (181+ days open annually), indicating potential for increased bookings or specific owner usage patterns.
- For booked days, the 91-180 days range is most frequent in Pasadena (52.4%), reflecting common guest stay durations or potential owner blocking patterns.
- A notable 23.8% of properties secure long booking periods (181+ days booked per year), highlighting successful long-term rental strategies or significant owner usage.
Pasadena Airbnb Minimum Stay Requirements Analysis
Distribution of Listings by Minimum Night Requirement
1 Night
3 listings
14.3% of total
2 Nights
7 listings
33.3% of total
3 Nights
1 listings
4.8% of total
30+ Nights
10 listings
47.6% of total
Key Insights
- The most prevalent minimum stay requirement in Pasadena is 30+ Nights, adopted by 47.6% of listings. This highlights the market's preference for longer commitments.
- A significant segment (47.6%) caters to monthly stays (30+ nights) in Pasadena, pointing to opportunities in the extended-stay market.
Recommendations
- Align with the market by considering a 30+ Nights minimum stay, as 47.6% of Pasadena hosts use this setting.
- If feasible, allowing 1-night stays, especially midweek or during low season, could capture last-minute bookings, as only 14.3% currently do.
- A 2-night minimum appears standard (33.3%). Consider this for weekends or peak periods.
- Explore offering discounts for stays of 30+ nights to attract the 47.6% of the market seeking extended stays.
- Adjust minimum nights based on seasonality – potentially shorter during low season and longer during peak demand periods in Pasadena.
Pasadena Airbnb Cancellation Policy Trends Analysis (2026)
Limited
1 listings
4.8% of total
Super Strict 60 Days
1 listings
4.8% of total
Flexible
4 listings
19% of total
Moderate
7 listings
33.3% of total
Firm
5 listings
23.8% of total
Strict
3 listings
14.3% of total
Cancellation Policy Insights for Pasadena
- The prevailing Airbnb cancellation policy trend in Pasadena is Moderate, used by 33.3% of listings.
- There's a relatively balanced mix between guest-friendly (52.3%) and stricter (38.1%) policies, offering choices for different guest needs.
Recommendations for Hosts
- Consider adopting a Moderate policy to align with the 33.3% market standard in Pasadena.
- Using a Strict policy might deter some guests, as only 14.3% of listings use it. Evaluate if potential revenue protection outweighs possible lower booking rates.
- Regularly review your cancellation policy against competitors and market demand shifts in Pasadena.
Pasadena STR Booking Lead Time Analysis (2026)
Average Booking Lead Time by Month
Booking Lead Time Insights for Pasadena
- The overall average booking lead time for vacation rentals in Pasadena is 51 days.
- Guests book furthest in advance for stays during May (average 83 days), likely coinciding with peak travel demand or local events.
- The shortest booking windows occur for stays in January (average 13 days), indicating more last-minute travel plans during this time.
- Seasonally, Summer (64 days avg.) sees the longest lead times, while Winter (25 days avg.) has the shortest, reflecting typical travel planning cycles.
Recommendations for Hosts
- Use the overall average lead time (51 days) as a baseline for your pricing and availability strategy in Pasadena.
- For May stays, consider implementing length-of-stay discounts or slightly higher rates for bookings made less than 83 days out to capitalize on advance planning.
- During January, focus on last-minute booking availability and promotions, as guests book with very short notice (13 days avg.).
- Target marketing efforts for the Summer season well in advance (at least 64 days) to capture early planners.
- Monitor your own booking lead times against these Pasadena averages to identify opportunities for dynamic pricing adjustments.
Popular & Essential Airbnb Amenities in Pasadena (2026)
Amenity Prevalence
Amenity Insights for Pasadena
- Essential amenities in Pasadena that guests expect include: Smoke alarm, Coffee maker, Air conditioning, Free parking on premises, TV, Wifi, Refrigerator, Hair dryer, Kitchen, Heating. Lacking these (any) could significantly impact bookings.
Recommendations for Hosts
- Ensure your listing includes all essential amenities for Pasadena: Smoke alarm, Coffee maker, Air conditioning, Free parking on premises, TV, Wifi, Refrigerator, Hair dryer, Kitchen, Heating.
- Prioritize adding missing essentials: Heating.
- Highlight unique or less common amenities you offer (e.g., hot tub, dedicated workspace, EV charger) in your listing description and photos.
- Regularly check competitor amenities in Pasadena to stay competitive.
Pasadena Airbnb Guest Demographics & Profile Analysis (2026)
Guest Profile Summary for Pasadena
- The typical guest profile for Airbnb in Pasadena consists of primarily domestic travelers (92%), often arriving from nearby Washington, typically belonging to the Post-2000s (Gen Z/Alpha) group (50%), primarily speaking English or Spanish.
- Domestic travelers account for 92.2% of guests.
- Key international markets include United States (92.2%) and DC (4.4%).
- Top languages spoken are English (73.6%) followed by Spanish (14.3%).
- A significant demographic segment is the Post-2000s (Gen Z/Alpha) group, representing 50% of guests.
Recommendations for Hosts
- Target domestic marketing efforts towards travelers from Washington and Philadelphia.
- Tailor amenities and listing descriptions to appeal to the dominant Post-2000s (Gen Z/Alpha) demographic (e.g., highlight fast WiFi, smart home features, local guides).
- Highlight unique local experiences or amenities relevant to the primary guest profile.
- Consider seasonal promotions aligned with peak travel times for key origin markets.
Nearby Short-Term Rental Market Comparison
How does the Pasadena Airbnb market stack up against its neighbors? Compare key performance metrics like average monthly revenue, ADR, and occupancy rates in surrounding areas to understand the broader regional STR landscape.
| Market | Active Properties | Monthly Revenue | Daily Rate | Avg. Occupancy |
|---|---|---|---|---|
| Polk Township | 15 | $6,974 | $520.26 | 38% |
| Lemont | 21 | $6,940 | $873.93 | 37% |
| College Township | 83 | $6,551 | $848.63 | 36% |
| Centreville | 17 | $6,298 | $565.66 | 45% |
| State College | 192 | $6,081 | $712.29 | 40% |
| Mayo | 13 | $5,915 | $447.58 | 51% |
| Shannondale | 45 | $5,808 | $337.30 | 54% |
| Hilltown Township | 11 | $5,557 | $578.96 | 40% |
| Hellam Township | 24 | $5,496 | $386.69 | 45% |
| Stevensville | 80 | $5,412 | $556.79 | 41% |