Ocean City Airbnb Market Analysis 2026: Short Term Rental Data & Vacation Rental Statistics in Maryland, United States
Is Airbnb profitable in Ocean City in 2026? Explore comprehensive Airbnb analytics for Ocean City, Maryland, United States to uncover income potential. This 2026 STR market report for Ocean City, based on AirROI data from February 2025 to January 2026, reveals key trends in the bustling market of 4,119 active listings.
Whether you're considering an Airbnb investment in Ocean City, optimizing your existing vacation rental, or exploring rental arbitrage opportunities, understanding the Ocean City Airbnb data is crucial. Navigating the high regulation landscape is key to maximizing your short term rental income potential. Let's dive into the specifics.
Key Ocean City Airbnb Performance Metrics Overview
Monthly Airbnb Revenue Variations & Income Potential in Ocean City (2026)
Understanding the monthly revenue variations for Airbnb listings in Ocean City is key to maximizing your short term rental income potential. Seasonality significantly impacts earnings. Our analysis, based on data from the past 12 months, shows that the peak revenue month for STRs in Ocean City is typically July, while February often presents the lowest earnings, highlighting opportunities for strategic pricing adjustments during shoulder and low seasons. Explore the typical Airbnb income in Ocean City across different performance tiers:
- Best-in-class properties (Top 10%) achieve $7,063+ monthly, often utilizing dynamic pricing and superior guest experiences.
- Strong performing properties (Top 25%) earn $4,563 or more, indicating effective management and desirable locations/amenities.
- Typical properties (Median) generate around $2,672 per month, representing the average market performance.
- Entry-level properties (Bottom 25%) see earnings around $1,377, often with potential for optimization.
Average Monthly Airbnb Earnings Trend in Ocean City
Ocean City Airbnb Occupancy Rate Trends (2026)
Maximize your bookings by understanding the Ocean City STR occupancy trends. Seasonal demand shifts significantly influence how often properties are booked. Typically, Julysees the highest demand (peak season occupancy), while January experiences the lowest (low season). Effective strategies, like adjusting minimum stays or offering promotions, can boost occupancy during slower periods. Here's how different property tiers perform in Ocean City:
- Best-in-class properties (Top 10%) achieve 65%+ occupancy, indicating high desirability and potentially optimized availability.
- Strong performing properties (Top 25%) maintain 46% or higher occupancy, suggesting good market fit and guest satisfaction.
- Typical properties (Median) have an occupancy rate around 29%.
- Entry-level properties (Bottom 25%) average 14% occupancy, potentially facing higher vacancy.
Average Monthly Occupancy Rate Trend in Ocean City
Average Daily Rate (ADR) Airbnb Trends in Ocean City (2026)
Effective short term rental pricing strategy in Ocean City involves understanding monthly ADR fluctuations. The Average Daily Rate (ADR) for Airbnb in Ocean City typically peaks in July and dips lowest during February. Leveraging Airbnb dynamic pricing tools or strategies based on this seasonality can significantly boost revenue. Here's a look at the typical nightly rates achieved:
- Best-in-class properties (Top 10%) command rates of $531+ per night, often due to premium features or locations.
- Strong performing properties (Top 25%) achieve nightly rates of $391 or more.
- Typical properties (Median) charge around $287 per night.
- Entry-level properties (Bottom 25%) earn around $216 per night.
Average Daily Rate (ADR) Trend by Month in Ocean City
Get Live Ocean City Market Intelligence 👇

Explore Real-time Analytics
Airbnb Seasonality Analysis & Trends in Ocean City (2026)
Peak Season (July, August, June)
- Revenue averages $7,228 per month
- Occupancy rates average 53.9%
- Daily rates average $396
Shoulder Season
- Revenue averages $2,513 per month
- Occupancy maintains around 27.6%
- Daily rates hold near $316
Low Season (January, February, March)
- Revenue drops to average $1,547 per month
- Occupancy decreases to average 22.9%
- Daily rates adjust to average $286
Seasonality Insights for Ocean City
- The Airbnb seasonality in Ocean City shows highly seasonal trends requiring careful strategy. While the sections above show seasonal averages, it's also insightful to look at the extremes:
- During the high season, the absolute peak month showcases Ocean City's highest earning potential, with monthly revenues capable of climbing to $8,241, occupancy reaching a high of 58.7%, and ADRs peaking at $406.
- Conversely, the slowest single month of the year, typically falling within the low season, marks the market's lowest point. In this month, revenue might dip to $1,460, occupancy could drop to 17.3%, and ADRs may adjust down to $271.
- Understanding both the seasonal averages and these monthly peaks and troughs in revenue, occupancy, and ADR is crucial for maximizing your Airbnb profit potential in Ocean City.
Seasonal Strategies for Maximizing Profit
- Peak Season: Maximize revenue through premium pricing and potentially longer minimum stays. Ensure high availability.
- Low Season: Offer competitive pricing, special promotions (e.g., extended stay discounts), and flexible cancellation policies. Target off-season travelers like remote workers or budget-conscious guests.
- Shoulder Seasons: Implement dynamic pricing that balances peak and low rates. Target weekend travelers or specific events. Offer slightly more flexible terms than peak season.
- Regularly analyze your own performance against these Ocean City seasonality benchmarks and adjust your pricing and availability strategy accordingly.
Best Areas for Airbnb Investment in Ocean City (2026)
Exploring the top neighborhoods for short-term rentals in Ocean City? This section highlights key areas, outlining why they are attractive for hosts and guests, along with notable local attractions. Consider these locations based on your target guest profile and investment strategy.
| Neighborhood / Area | Why Host Here? (Target Guests & Appeal) | Key Attractions & Landmarks |
|---|---|---|
| North Ocean City | A quieter area known for its family-friendly atmosphere and proximity to the beach. Great for families and travelers seeking a relaxing vacation away from the hustle. | Northside Park, Fenwick Island State Park, Ocean City Fishing Pier, Miniature Golf Courses, Local Restaurants |
| West Ocean City | This area offers a blend of convenience with access to shopping and dining, along with quick access to the beach without the high congestion of the boardwalk area. | Ocean City Square Shopping Center, Marina activities, Bayside restaurants, Ocean Downs Casino, West Ocean City Dog Park |
| Boardwalk | The historic heart of Ocean City, full of attractions, restaurants, and nightlife. Ideal for those looking to experience the classic beach boardwalk atmosphere. | Ocean City Boardwalk, Jolly Roger Amusement Park, Ripley's Believe It or Not!, Trinidad Lounge, Thrashers French Fries |
| Downtown Ocean City | Offers vibrant nightlife and close proximity to the beach. Popular among young adults and visitors looking for fun activities and events. | Mason Dixon Dog Park, Ocean City Life-Saving Station Museum, Nightclubs and bars, The Beach Market, Local Festivals |
| Midtown Ocean City | A balance of convenience and beach access, suitable for all types of travelers. Known for its less crowded beaches compared to the boardwalk. | Ocean City Beach, Seacrets Jamaica USA, Jolly Roger Amusement Park, Numerous family-friendly restaurants, Golfing options nearby |
| South Ocean City | Offers a combination of relaxation and local charm with fewer tourists. Perfect for families and longer stays. | Gorman Avenue Park, Sandy Point State Park, Local coffee shops, Fishing from the beach, Cozy diners |
| Ocean Pines | A residential community with access to nature and a quieter setting, appealing to those wanting a longer retreat with local experiences. | Ocean Pines Golf Club, Assateague Island National Seashore, Community events, Nature trails, Local arts and crafts |
| Assateague Island | Famous for its wild ponies and natural beauty. Attracts nature lovers and those looking for a unique coastal experience away from the bustling crowds. | Assateague Island National Seashore, Wild pony viewing, Nature trails, Camping opportunities, Bicycle rentals |
Understanding Airbnb License Requirements & STR Laws in Ocean City (2026)
Yes, Ocean City, Maryland, United States enforces high STR regulations. Obtaining a license and ensuring compliance is almost certainly required according to current 2026 STR laws. Always verify the latest short term rental regulations and Airbnb license requirements directly with local government authorities for Ocean City to ensure full compliance before hosting.
(Source: AirROI data, 2026, based on 94% licensed listings)
Top Performing Airbnb Properties in Ocean City (2026)
Benchmark your potential! Explore examples of top-performing Airbnb properties in Ocean Citybased on Trailing Twelve Month (TTM) revenue. Analyze their characteristics, revenue, occupancy rate, and ADR to understand what drives success in this market.
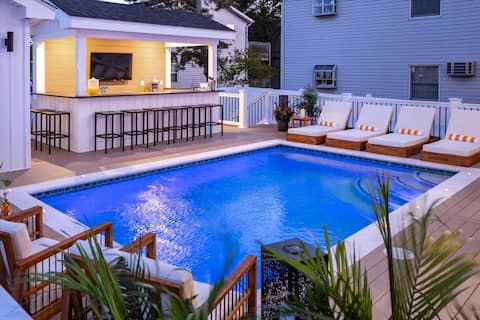
Private Pool ~ Sleeps 20 ~ Steps to the Beach
Entire Place • 6 bedrooms
Epic Luxurious Mansion Bayside Pools Tennis
Entire Place • 6 bedrooms
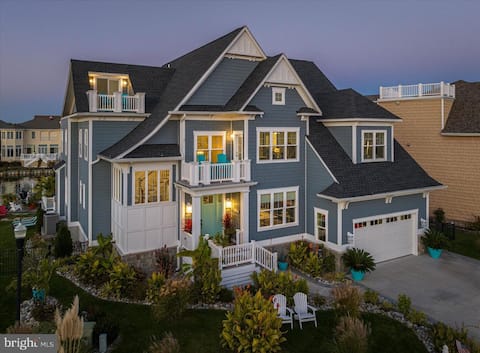
New! Direct Oceanfront Home w/Game Room/Free Bikes
Entire Place • 4 bedrooms

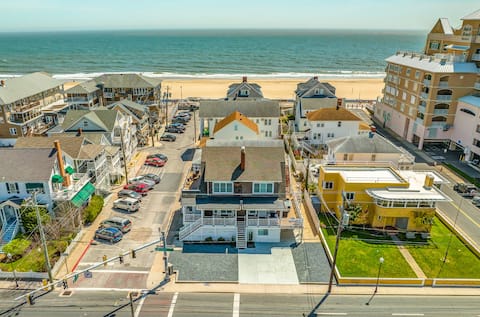
Spacious Home w/ Parking Steps to Beach Boardwalk.
Entire Place • 8 bedrooms

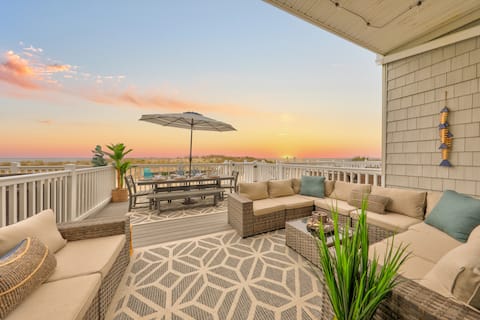
5BR OceanView O/D Space/Movies, Pool, Bikes, Gear
Entire Place • 5 bedrooms
Steps to Beach and Boardwalk (712) Sleeps 20 -
Entire Place • 6 bedrooms
Note: Performance varies based on location, size, amenities, seasonality, and management quality. Data reflects the past 12 months.
Top Performing Airbnb Hosts in Ocean City (2026)
Learn from the best! This table showcases top-performing Airbnb hosts in Ocean City based on the number of properties managed and estimated total revenue over the past year. Analyze their scale and performance metrics.
| Host Name | Properties | Grossing Revenue | Stay Reviews | Avg Rating |
|---|---|---|---|---|
| Seaside Vacations & Sales | 209 | $5,802,107 | 1376 | 4.60/5.0 |
| Oceans Edge Vacations | 104 | $5,114,434 | 2185 | 4.77/5.0 |
| Bob | 60 | $4,970,695 | 4401 | 4.78/5.0 |
| Vacasa Ocean City | 358 | $2,579,998 | 4207 | 4.41/5.0 |
| Evolve | 75 | $2,570,731 | 2346 | 4.71/5.0 |
| Coastal Life Vacations | 93 | $2,389,805 | 513 | 4.45/5.0 |
| OCMD Getaways | 89 | $2,387,005 | 982 | 4.73/5.0 |
| Kelly | 79 | $2,298,520 | 1271 | 4.69/5.0 |
| OC Beach Vacations | 48 | $2,179,064 | 3823 | 4.92/5.0 |
| Bluvista Vacation Rentals | 74 | $2,142,901 | 549 | 4.50/5.0 |
Analyzing the strategies of top hosts, such as their property selection, pricing, and guest communication, can offer valuable lessons for optimizing your own Airbnb operations in Ocean City.
Dive Deeper: Advanced Ocean City STR Market Data (2026)
Ready to unlock more insights? AirROI provides access to advanced metrics and comprehensive Airbnb data for Ocean City. Explore detailed analytics beyond this report to refine your investment strategy, optimize pricing, and maximize your vacation rental profits.
Explore Advanced MetricsOcean City Short-Term Rental Market Composition (2026): Property & Room Types
Room Type Distribution
Property Type Distribution
Market Composition Insights for Ocean City
- The Ocean City Airbnb market composition is heavily skewed towards Entire Home/Apt listings, which make up 99.5% of the 4,119 active rentals. This indicates strong guest preference for privacy and space.
- Looking at the property type distribution in Ocean City, Apartment/Condo properties are the most common (77.8%), reflecting the local real estate landscape.
- Houses represent a significant 21.8% portion, catering likely to families or larger groups.
- Smaller segments like hotel/boutique, others (combined 0.3%) offer potential for unique stay experiences.
Ocean City Airbnb Room Capacity Analysis (2026): Bedroom Distribution
Distribution of Listings by Number of Bedrooms
Room Capacity Insights for Ocean City
- The dominant room capacity in Ocean City is 2 bedrooms listings, making up 42.6% of the market. This suggests a strong demand for properties suitable for couples or solo travelers.
- Together, 2 bedrooms and 3 bedrooms properties represent 69.3% of the active Airbnb listings in Ocean City, indicating a high concentration in these sizes.
- A significant 35.2% of listings offer 3+ bedrooms, catering to larger groups and families seeking more space in Ocean City.
Ocean City Vacation Rental Guest Capacity Trends (2026)
Distribution of Listings by Guest Capacity
Guest Capacity Insights for Ocean City
- The most common guest capacity trend in Ocean City vacation rentals is listings accommodating 8+ guests (42.9%). This suggests the primary traveler segment is likely larger groups.
- Properties designed for 8+ guests and 6 guests dominate the Ocean City STR market, accounting for 72.1% of listings.
- 78.3% of properties accommodate 6+ guests, serving the market segment for larger families or group travel in Ocean City.
- On average, properties in Ocean City are equipped to host 6.5 guests.
Ocean City Airbnb Booking Patterns (2026): Available vs. Booked Days
Available Days Distribution
Booked Days Distribution
Booking Pattern Insights for Ocean City
- The most common availability pattern in Ocean City falls within the 271-366 days range, representing 65.4% of listings. This suggests many properties have significant open periods on their calendars.
- Approximately 95.7% of listings show high availability (181+ days open annually), indicating potential for increased bookings or specific owner usage patterns.
- For booked days, the 31-90 days range is most frequent in Ocean City (37.6%), reflecting common guest stay durations or potential owner blocking patterns.
- A notable 5.0% of properties secure long booking periods (181+ days booked per year), highlighting successful long-term rental strategies or significant owner usage.
Ocean City Airbnb Minimum Stay Requirements Analysis
Distribution of Listings by Minimum Night Requirement
1 Night
122 listings
3% of total
2 Nights
1064 listings
25.8% of total
3 Nights
642 listings
15.6% of total
4-6 Nights
207 listings
5% of total
7-29 Nights
91 listings
2.2% of total
30+ Nights
1993 listings
48.4% of total
Key Insights
- The most prevalent minimum stay requirement in Ocean City is 30+ Nights, adopted by 48.4% of listings. This highlights the market's preference for longer commitments.
- A significant segment (48.4%) caters to monthly stays (30+ nights) in Ocean City, pointing to opportunities in the extended-stay market.
Recommendations
- Align with the market by considering a 30+ Nights minimum stay, as 48.4% of Ocean City hosts use this setting.
- If feasible, allowing 1-night stays, especially midweek or during low season, could capture last-minute bookings, as only 3% currently do.
- Explore offering discounts for stays of 30+ nights to attract the 48.4% of the market seeking extended stays.
- Adjust minimum nights based on seasonality – potentially shorter during low season and longer during peak demand periods in Ocean City.
Ocean City Airbnb Cancellation Policy Trends Analysis (2026)
Super Strict 60 Days
512 listings
12.5% of total
Super Strict 30 Days
538 listings
13.1% of total
Limited
12 listings
0.3% of total
Flexible
109 listings
2.7% of total
Moderate
1032 listings
25.1% of total
Firm
1293 listings
31.4% of total
Strict
616 listings
15% of total
Cancellation Policy Insights for Ocean City
- The prevailing Airbnb cancellation policy trend in Ocean City is Firm, used by 31.4% of listings.
- There's a relatively balanced mix between guest-friendly (27.8%) and stricter (46.4%) policies, offering choices for different guest needs.
Recommendations for Hosts
- Consider adopting a Firm policy to align with the 31.4% market standard in Ocean City.
- Regularly review your cancellation policy against competitors and market demand shifts in Ocean City.
Ocean City STR Booking Lead Time Analysis (2026)
Average Booking Lead Time by Month
Booking Lead Time Insights for Ocean City
- The overall average booking lead time for vacation rentals in Ocean City is 70 days.
- Guests book furthest in advance for stays during September (average 94 days), likely coinciding with peak travel demand or local events.
- The shortest booking windows occur for stays in January (average 26 days), indicating more last-minute travel plans during this time.
- Seasonally, Summer (77 days avg.) sees the longest lead times, while Winter (31 days avg.) has the shortest, reflecting typical travel planning cycles.
Recommendations for Hosts
- Use the overall average lead time (70 days) as a baseline for your pricing and availability strategy in Ocean City.
- For September stays, consider implementing length-of-stay discounts or slightly higher rates for bookings made less than 94 days out to capitalize on advance planning.
- Target marketing efforts for the Summer season well in advance (at least 77 days) to capture early planners.
- Monitor your own booking lead times against these Ocean City averages to identify opportunities for dynamic pricing adjustments.
Popular & Essential Airbnb Amenities in Ocean City (2026)
Amenity Prevalence
Amenity Insights for Ocean City
- Essential amenities in Ocean City that guests expect include: Air conditioning, Smoke alarm, Kitchen, TV, Wifi. Lacking these (any) could significantly impact bookings.
- Popular amenities like Refrigerator, Microwave, Coffee maker are common but not universal. Offering these can provide a competitive edge.
Recommendations for Hosts
- Ensure your listing includes all essential amenities for Ocean City: Air conditioning, Smoke alarm, Kitchen, TV, Wifi.
- Prioritize adding missing essentials: Air conditioning, Smoke alarm, Kitchen, TV, Wifi.
- Consider adding popular differentiators like Refrigerator or Microwave to increase appeal.
- Highlight unique or less common amenities you offer (e.g., hot tub, dedicated workspace, EV charger) in your listing description and photos.
- Regularly check competitor amenities in Ocean City to stay competitive.
Ocean City Airbnb Guest Demographics & Profile Analysis (2026)
Guest Profile Summary for Ocean City
- The typical guest profile for Airbnb in Ocean City consists of primarily domestic travelers (96%), often arriving from nearby Baltimore, typically belonging to the Post-2000s (Gen Z/Alpha) group (50%), primarily speaking English or Spanish.
- Domestic travelers account for 95.5% of guests.
- Key international markets include United States (95.5%) and DC (3.4%).
- Top languages spoken are English (77.3%) followed by Spanish (10.5%).
- A significant demographic segment is the Post-2000s (Gen Z/Alpha) group, representing 50% of guests.
Recommendations for Hosts
- Target domestic marketing efforts towards travelers from Baltimore and Washington.
- Tailor amenities and listing descriptions to appeal to the dominant Post-2000s (Gen Z/Alpha) demographic (e.g., highlight fast WiFi, smart home features, local guides).
- Highlight unique local experiences or amenities relevant to the primary guest profile.
- Consider seasonal promotions aligned with peak travel times for key origin markets.
Nearby Short-Term Rental Market Comparison
How does the Ocean City Airbnb market stack up against its neighbors? Compare key performance metrics like average monthly revenue, ADR, and occupancy rates in surrounding areas to understand the broader regional STR landscape.
| Market | Active Properties | Monthly Revenue | Daily Rate | Avg. Occupancy |
|---|---|---|---|---|
| Centreville | 17 | $6,298 | $565.66 | 45% |
| Mayo | 13 | $5,915 | $447.58 | 51% |
| Cape May Point | 23 | $5,479 | $542.19 | 46% |
| Stone Harbor | 42 | $5,467 | $785.22 | 39% |
| Stevensville | 80 | $5,412 | $556.79 | 41% |
| Weems | 11 | $5,077 | $417.22 | 47% |
| Lower Windsor Township | 14 | $5,062 | $428.71 | 45% |
| Arundel on the Bay | 29 | $5,043 | $486.96 | 40% |
| Cape May | 334 | $5,029 | $553.79 | 42% |
| Surf City | 47 | $5,004 | $715.29 | 44% |