Oakland Airbnb Market Analysis 2026: Short Term Rental Data & Vacation Rental Statistics in Maryland, United States
Is Airbnb profitable in Oakland in 2026? Explore comprehensive Airbnb analytics for Oakland, Maryland, United States to uncover income potential. This 2026 STR market report for Oakland, based on AirROI data from February 2025 to January 2026, reveals key trends in the market of 537 active listings.
Whether you're considering an Airbnb investment in Oakland, optimizing your existing vacation rental, or exploring rental arbitrage opportunities, understanding the Oakland Airbnb data is crucial. Leveraging the low regulation environment is key to maximizing your short term rental income potential. Let's dive into the specifics.
Key Oakland Airbnb Performance Metrics Overview
Monthly Airbnb Revenue Variations & Income Potential in Oakland (2026)
Understanding the monthly revenue variations for Airbnb listings in Oakland is key to maximizing your short term rental income potential. Seasonality significantly impacts earnings. Our analysis, based on data from the past 12 months, shows that the peak revenue month for STRs in Oakland is typically July, while March often presents the lowest earnings, highlighting opportunities for strategic pricing adjustments during shoulder and low seasons. Explore the typical Airbnb income in Oakland across different performance tiers:
- Best-in-class properties (Top 10%) achieve $9,992+ monthly, often utilizing dynamic pricing and superior guest experiences.
- Strong performing properties (Top 25%) earn $5,990 or more, indicating effective management and desirable locations/amenities.
- Typical properties (Median) generate around $3,334 per month, representing the average market performance.
- Entry-level properties (Bottom 25%) see earnings around $1,677, often with potential for optimization.
Average Monthly Airbnb Earnings Trend in Oakland
Oakland Airbnb Occupancy Rate Trends (2026)
Maximize your bookings by understanding the Oakland STR occupancy trends. Seasonal demand shifts significantly influence how often properties are booked. Typically, Julysees the highest demand (peak season occupancy), while January experiences the lowest (low season). Effective strategies, like adjusting minimum stays or offering promotions, can boost occupancy during slower periods. Here's how different property tiers perform in Oakland:
- Best-in-class properties (Top 10%) achieve 61%+ occupancy, indicating high desirability and potentially optimized availability.
- Strong performing properties (Top 25%) maintain 44% or higher occupancy, suggesting good market fit and guest satisfaction.
- Typical properties (Median) have an occupancy rate around 27%.
- Entry-level properties (Bottom 25%) average 15% occupancy, potentially facing higher vacancy.
Average Monthly Occupancy Rate Trend in Oakland
Average Daily Rate (ADR) Airbnb Trends in Oakland (2026)
Effective short term rental pricing strategy in Oakland involves understanding monthly ADR fluctuations. The Average Daily Rate (ADR) for Airbnb in Oakland typically peaks in December and dips lowest during April. Leveraging Airbnb dynamic pricing tools or strategies based on this seasonality can significantly boost revenue. Here's a look at the typical nightly rates achieved:
- Best-in-class properties (Top 10%) command rates of $864+ per night, often due to premium features or locations.
- Strong performing properties (Top 25%) achieve nightly rates of $621 or more.
- Typical properties (Median) charge around $443 per night.
- Entry-level properties (Bottom 25%) earn around $266 per night.
Average Daily Rate (ADR) Trend by Month in Oakland
Get Live Oakland Market Intelligence 👇

Explore Real-time Analytics
Airbnb Seasonality Analysis & Trends in Oakland (2026)
Peak Season (July, August, June)
- Revenue averages $6,422 per month
- Occupancy rates average 41.9%
- Daily rates average $492
Shoulder Season
- Revenue averages $4,298 per month
- Occupancy maintains around 28.7%
- Daily rates hold near $504
Low Season (January, March, April)
- Revenue drops to average $3,451 per month
- Occupancy decreases to average 24.5%
- Daily rates adjust to average $480
Seasonality Insights for Oakland
- The Airbnb seasonality in Oakland shows highly seasonal trends requiring careful strategy. While the sections above show seasonal averages, it's also insightful to look at the extremes:
- During the high season, the absolute peak month showcases Oakland's highest earning potential, with monthly revenues capable of climbing to $7,579, occupancy reaching a high of 48.8%, and ADRs peaking at $538.
- Conversely, the slowest single month of the year, typically falling within the low season, marks the market's lowest point. In this month, revenue might dip to $3,074, occupancy could drop to 22.7%, and ADRs may adjust down to $452.
- Understanding both the seasonal averages and these monthly peaks and troughs in revenue, occupancy, and ADR is crucial for maximizing your Airbnb profit potential in Oakland.
Seasonal Strategies for Maximizing Profit
- Peak Season: Maximize revenue through premium pricing and potentially longer minimum stays. Ensure high availability.
- Low Season: Offer competitive pricing, special promotions (e.g., extended stay discounts), and flexible cancellation policies. Target off-season travelers like remote workers or budget-conscious guests.
- Shoulder Seasons: Implement dynamic pricing that balances peak and low rates. Target weekend travelers or specific events. Offer slightly more flexible terms than peak season.
- Regularly analyze your own performance against these Oakland seasonality benchmarks and adjust your pricing and availability strategy accordingly.
Best Areas for Airbnb Investment in Oakland (2026)
Exploring the top neighborhoods for short-term rentals in Oakland? This section highlights key areas, outlining why they are attractive for hosts and guests, along with notable local attractions. Consider these locations based on your target guest profile and investment strategy.
| Neighborhood / Area | Why Host Here? (Target Guests & Appeal) | Key Attractions & Landmarks |
|---|---|---|
| Deep Creek Lake | A popular vacation destination known for its beautiful lake views and outdoor activities. Ideal for visitors looking for a peaceful retreat with boating, fishing, and hiking opportunities. | Deep Creek Lake State Park, Swallow Falls State Park, Wisp Resort, Adventure Sports Center International, Deep Creek Marina |
| Oakland Historic District | Rich in history and charming architecture, this area attracts those interested in heritage and community events. Ideal for guests looking to explore local culture and history. | Oakland B&O Museum, The Opera House, The Historic Ice Cream Shop, Local art galleries, Annual festivals and events |
| Accident | A small town close to Deep Creek Lake, popular for its quiet atmosphere and nature activities. Great for travelers seeking a rural experience with the convenience of nearby attractions. | The Casselman Inn, The Accident Park, Local antique shops, Nearby hiking trails, Frostburg State University nearby |
| McHenry | Located near the lake, McHenry offers beautiful waterfront properties and access to recreation. Perfect for families and groups seeking fun activities year-round. | Wisp Resort skiing and snowboarding, Deep Creek Lake adventures, Kayaking and paddleboarding, Local restaurants and cafes, Horseback riding at local stables |
| Terra Alta | A charming town with a family-friendly vibe, great for those who want a quieter stay with access to natural beauty and outdoor pursuits. | Terra Alta Lake, Walking and hiking trails, Local farmer's market, Community events, Scenic overlooks |
| Burlington | A quaint rural area known for its natural beauty, ideal for hiking and outdoor enthusiasts looking for a peaceful escape. | Potomac River, Local parks, Fishing opportunities, Camping sites, Scenic drives in the countryside |
| Friendsville | Known for its outdoor recreational activities connecting with nature, this area is perfect for adventure seekers and nature lovers. | Bear Creek State Park, Nearby hiking trails, Fishing spots, Biking routes, Local artisanal shops |
| Gormania | A small, peaceful community ideal for those looking to unwind and experience rural Maryland, suitable for travelers seeking a quiet getaway. | Local farms, Bird watching spots, Hiking trails nearby, Cultural festivals, Community gatherings |
Understanding Airbnb License Requirements & STR Laws in Oakland (2026)
While Oakland, Maryland, United States currently shows low STR regulations, specific Airbnb license requirements might still exist or change. Always verify the latest short term rental regulations and Airbnb license requirements directly with local government authorities for Oakland to ensure full compliance before hosting.
(Source: AirROI data, 2026, finding no licensed listings among those analyzed)
Top Performing Airbnb Properties in Oakland (2026)
Benchmark your potential! Explore examples of top-performing Airbnb properties in Oaklandbased on Trailing Twelve Month (TTM) revenue. Analyze their characteristics, revenue, occupancy rate, and ADR to understand what drives success in this market.
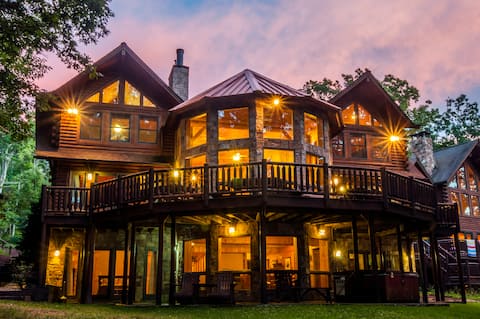
Grand Chestnut Lodge | Lakefront + Game Room!
Entire Place • 9 bedrooms
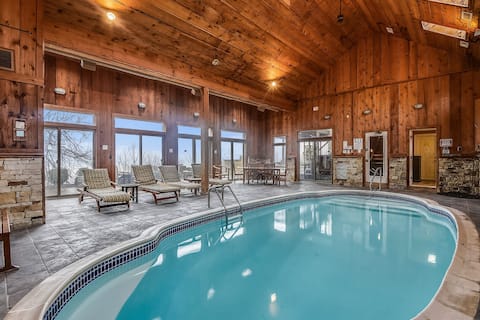
Indoor Pool, Huge Home, Best View of the Lake!
Entire Place • 8 bedrooms
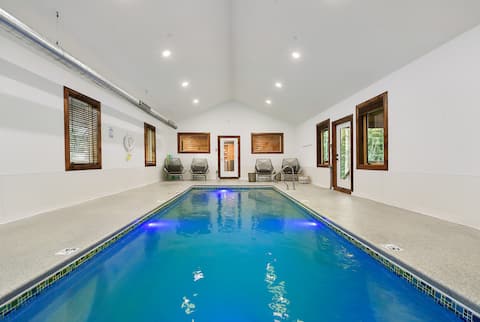
Pool, HotTub, FirePit, EVCharger, & Great Location
Entire Place • 6 bedrooms

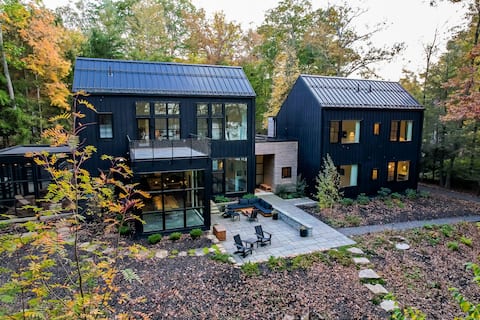
Dog Friendly Luxury Estate w/ Fire Pit, Hot Tubs
Entire Place • 9 bedrooms
The Birch Bower: Luxury Lakefront Home
Entire Place • 5 bedrooms

Valhalla | Amazing Lakes Views, Hot Tub, Sauna!
Entire Place • 5 bedrooms
Note: Performance varies based on location, size, amenities, seasonality, and management quality. Data reflects the past 12 months.
Top Performing Airbnb Hosts in Oakland (2026)
Learn from the best! This table showcases top-performing Airbnb hosts in Oakland based on the number of properties managed and estimated total revenue over the past year. Analyze their scale and performance metrics.
| Host Name | Properties | Grossing Revenue | Stay Reviews | Avg Rating |
|---|---|---|---|---|
| Railey Vacations | 144 | $6,082,298 | 1150 | 4.63/5.0 |
| Taylor-Made Deep Creek Vacatio | 117 | $5,071,444 | 914 | 4.48/5.0 |
| Lori | 18 | $1,484,424 | 251 | 4.84/5.0 |
| Timber Rock Village | 9 | $1,126,628 | 315 | 5.00/5.0 |
| Will O The Wisp | 34 | $685,536 | 291 | 4.60/5.0 |
| Suites At Silver Tree | 40 | $494,451 | 169 | 4.69/5.0 |
| Tina & Robert | 9 | $275,634 | 696 | 4.73/5.0 |
| Rick | 3 | $222,922 | 172 | 4.96/5.0 |
| Kayla | 1 | $221,842 | 106 | 4.98/5.0 |
| RoughCutLodge | 1 | $172,113 | 38 | 4.92/5.0 |
Analyzing the strategies of top hosts, such as their property selection, pricing, and guest communication, can offer valuable lessons for optimizing your own Airbnb operations in Oakland.
Dive Deeper: Advanced Oakland STR Market Data (2026)
Ready to unlock more insights? AirROI provides access to advanced metrics and comprehensive Airbnb data for Oakland. Explore detailed analytics beyond this report to refine your investment strategy, optimize pricing, and maximize your vacation rental profits.
Explore Advanced MetricsOakland Short-Term Rental Market Composition (2026): Property & Room Types
Room Type Distribution
Property Type Distribution
Market Composition Insights for Oakland
- The Oakland Airbnb market composition is heavily skewed towards Entire Home/Apt listings, which make up 99.4% of the 537 active rentals. This indicates strong guest preference for privacy and space.
- Looking at the property type distribution in Oakland, House properties are the most common (71.5%), reflecting the local real estate landscape.
- Houses represent a significant 71.5% portion, catering likely to families or larger groups.
- Smaller segments like unique stays, hotel/boutique (combined 0.6%) offer potential for unique stay experiences.
Oakland Airbnb Room Capacity Analysis (2026): Bedroom Distribution
Distribution of Listings by Number of Bedrooms
Room Capacity Insights for Oakland
- The dominant room capacity in Oakland is 5+ bedrooms listings, making up 28.9% of the market. This suggests a strong demand for properties suitable for families or small groups.
- Together, 5+ bedrooms and 4 bedrooms properties represent 52.7% of the active Airbnb listings in Oakland, indicating a high concentration in these sizes.
- A significant 72.8% of listings offer 3+ bedrooms, catering to larger groups and families seeking more space in Oakland.
Oakland Vacation Rental Guest Capacity Trends (2026)
Distribution of Listings by Guest Capacity
Guest Capacity Insights for Oakland
- The most common guest capacity trend in Oakland vacation rentals is listings accommodating 8+ guests (69.1%). This suggests the primary traveler segment is likely larger groups.
- Properties designed for 8+ guests and 4 guests dominate the Oakland STR market, accounting for 80.6% of listings.
- 81.8% of properties accommodate 6+ guests, serving the market segment for larger families or group travel in Oakland.
- On average, properties in Oakland are equipped to host 7.0 guests.
Oakland Airbnb Booking Patterns (2026): Available vs. Booked Days
Available Days Distribution
Booked Days Distribution
Booking Pattern Insights for Oakland
- The most common availability pattern in Oakland falls within the 271-366 days range, representing 67.6% of listings. This suggests many properties have significant open periods on their calendars.
- Approximately 91.1% of listings show high availability (181+ days open annually), indicating potential for increased bookings or specific owner usage patterns.
- For booked days, the 31-90 days range is most frequent in Oakland (47.9%), reflecting common guest stay durations or potential owner blocking patterns.
- A notable 9.3% of properties secure long booking periods (181+ days booked per year), highlighting successful long-term rental strategies or significant owner usage.
Oakland Airbnb Minimum Stay Requirements Analysis
Distribution of Listings by Minimum Night Requirement
1 Night
63 listings
11.7% of total
2 Nights
143 listings
26.6% of total
3 Nights
12 listings
2.2% of total
4-6 Nights
5 listings
0.9% of total
7-29 Nights
1 listings
0.2% of total
30+ Nights
313 listings
58.3% of total
Key Insights
- The most prevalent minimum stay requirement in Oakland is 30+ Nights, adopted by 58.3% of listings. This highlights the market's preference for longer commitments.
- A significant segment (58.3%) caters to monthly stays (30+ nights) in Oakland, pointing to opportunities in the extended-stay market.
Recommendations
- Align with the market by considering a 30+ Nights minimum stay, as 58.3% of Oakland hosts use this setting.
- If feasible, allowing 1-night stays, especially midweek or during low season, could capture last-minute bookings, as only 11.7% currently do.
- Explore offering discounts for stays of 30+ nights to attract the 58.3% of the market seeking extended stays.
- Adjust minimum nights based on seasonality – potentially shorter during low season and longer during peak demand periods in Oakland.
Oakland Airbnb Cancellation Policy Trends Analysis (2026)
Super Strict 60 Days
16 listings
3% of total
Super Strict 30 Days
32 listings
6% of total
Limited
2 listings
0.4% of total
Flexible
13 listings
2.4% of total
Moderate
121 listings
22.5% of total
Firm
339 listings
63.1% of total
Strict
14 listings
2.6% of total
Cancellation Policy Insights for Oakland
- The prevailing Airbnb cancellation policy trend in Oakland is Firm, used by 63.1% of listings.
- A majority (65.7%) of hosts in Oakland utilize Firm or Strict policies, indicating a market where hosts prioritize booking security.
- Strict cancellation policies are quite rare (2.6%), potentially making listings with this policy less competitive unless justified by high demand or property type.
Recommendations for Hosts
- Consider adopting a Firm policy to align with the 63.1% market standard in Oakland.
- Using a Strict policy might deter some guests, as only 2.6% of listings use it. Evaluate if potential revenue protection outweighs possible lower booking rates.
- Regularly review your cancellation policy against competitors and market demand shifts in Oakland.
Oakland STR Booking Lead Time Analysis (2026)
Average Booking Lead Time by Month
Booking Lead Time Insights for Oakland
- The overall average booking lead time for vacation rentals in Oakland is 70 days.
- Guests book furthest in advance for stays during August (average 86 days), likely coinciding with peak travel demand or local events.
- The shortest booking windows occur for stays in March (average 40 days), indicating more last-minute travel plans during this time.
- Seasonally, Fall (83 days avg.) sees the longest lead times, while Winter (55 days avg.) has the shortest, reflecting typical travel planning cycles.
Recommendations for Hosts
- Use the overall average lead time (70 days) as a baseline for your pricing and availability strategy in Oakland.
- For August stays, consider implementing length-of-stay discounts or slightly higher rates for bookings made less than 86 days out to capitalize on advance planning.
- Target marketing efforts for the Fall season well in advance (at least 83 days) to capture early planners.
- Monitor your own booking lead times against these Oakland averages to identify opportunities for dynamic pricing adjustments.
Popular & Essential Airbnb Amenities in Oakland (2026)
Amenity Prevalence
Amenity Insights for Oakland
- Essential amenities in Oakland that guests expect include: Hot water, Dishes and silverware, Coffee maker, Heating, Free parking on premises, Fire extinguisher, Bed linens, Wifi, Kitchen, TV. Lacking these (any) could significantly impact bookings.
Recommendations for Hosts
- Ensure your listing includes all essential amenities for Oakland: Hot water, Dishes and silverware, Coffee maker, Heating, Free parking on premises, Fire extinguisher, Bed linens, Wifi, Kitchen, TV.
- Prioritize adding missing essentials: Hot water, Dishes and silverware, Coffee maker, Heating, Free parking on premises, Fire extinguisher, Bed linens, Wifi, Kitchen, TV.
- Highlight unique or less common amenities you offer (e.g., hot tub, dedicated workspace, EV charger) in your listing description and photos.
- Regularly check competitor amenities in Oakland to stay competitive.
Oakland Airbnb Guest Demographics & Profile Analysis (2026)
Guest Profile Summary for Oakland
- The typical guest profile for Airbnb in Oakland consists of primarily domestic travelers (95%), often arriving from nearby Pittsburgh, typically belonging to the Post-2000s (Gen Z/Alpha) group (50%), primarily speaking English or Spanish.
- Domestic travelers account for 94.6% of guests.
- Key international markets include United States (94.6%) and DC (4.2%).
- Top languages spoken are English (78.4%) followed by Spanish (9.3%).
- A significant demographic segment is the Post-2000s (Gen Z/Alpha) group, representing 50% of guests.
Recommendations for Hosts
- Target domestic marketing efforts towards travelers from Pittsburgh and Baltimore.
- Tailor amenities and listing descriptions to appeal to the dominant Post-2000s (Gen Z/Alpha) demographic (e.g., highlight fast WiFi, smart home features, local guides).
- Highlight unique local experiences or amenities relevant to the primary guest profile.
- Consider seasonal promotions aligned with peak travel times for key origin markets.
Nearby Short-Term Rental Market Comparison
How does the Oakland Airbnb market stack up against its neighbors? Compare key performance metrics like average monthly revenue, ADR, and occupancy rates in surrounding areas to understand the broader regional STR landscape.
| Market | Active Properties | Monthly Revenue | Daily Rate | Avg. Occupancy |
|---|---|---|---|---|
| McGaheysville | 83 | $6,156 | $431.72 | 45% |
| Bentonville | 23 | $5,372 | $420.82 | 51% |
| Bumpass | 120 | $4,851 | $553.01 | 33% |
| Shenandoah | 104 | $4,778 | $354.44 | 47% |
| Skyland Estates | 14 | $4,649 | $280.30 | 55% |
| Castleton | 11 | $4,646 | $528.43 | 30% |
| Stanley | 103 | $4,550 | $324.33 | 48% |
| Wardensville | 33 | $4,485 | $267.00 | 54% |
| Rileyville | 66 | $4,225 | $294.93 | 48% |
| Shenandoah Shores | 15 | $4,219 | $421.31 | 38% |