National Harbor Airbnb Market Analysis 2026: Short Term Rental Data & Vacation Rental Statistics in Maryland, United States
Is Airbnb profitable in National Harbor in 2026? Explore comprehensive Airbnb analytics for National Harbor, Maryland, United States to uncover income potential. This 2026 STR market report for National Harbor, based on AirROI data from February 2025 to January 2026, reveals key trends in the market of 277 active listings.
Whether you're considering an Airbnb investment in National Harbor, optimizing your existing vacation rental, or exploring rental arbitrage opportunities, understanding the National Harbor Airbnb data is crucial. Navigating the high regulation landscape is key to maximizing your short term rental income potential. Let's dive into the specifics.
Key National Harbor Airbnb Performance Metrics Overview
Monthly Airbnb Revenue Variations & Income Potential in National Harbor (2026)
Understanding the monthly revenue variations for Airbnb listings in National Harbor is key to maximizing your short term rental income potential. Seasonality significantly impacts earnings. Our analysis, based on data from the past 12 months, shows that the peak revenue month for STRs in National Harbor is typically June, while January often presents the lowest earnings, highlighting opportunities for strategic pricing adjustments during shoulder and low seasons. Explore the typical Airbnb income in National Harbor across different performance tiers:
- Best-in-class properties (Top 10%) achieve $7,337+ monthly, often utilizing dynamic pricing and superior guest experiences.
- Strong performing properties (Top 25%) earn $4,657 or more, indicating effective management and desirable locations/amenities.
- Typical properties (Median) generate around $2,557 per month, representing the average market performance.
- Entry-level properties (Bottom 25%) see earnings around $1,287, often with potential for optimization.
Average Monthly Airbnb Earnings Trend in National Harbor
National Harbor Airbnb Occupancy Rate Trends (2026)
Maximize your bookings by understanding the National Harbor STR occupancy trends. Seasonal demand shifts significantly influence how often properties are booked. Typically, Aprilsees the highest demand (peak season occupancy), while January experiences the lowest (low season). Effective strategies, like adjusting minimum stays or offering promotions, can boost occupancy during slower periods. Here's how different property tiers perform in National Harbor:
- Best-in-class properties (Top 10%) achieve 74%+ occupancy, indicating high desirability and potentially optimized availability.
- Strong performing properties (Top 25%) maintain 54% or higher occupancy, suggesting good market fit and guest satisfaction.
- Typical properties (Median) have an occupancy rate around 31%.
- Entry-level properties (Bottom 25%) average 16% occupancy, potentially facing higher vacancy.
Average Monthly Occupancy Rate Trend in National Harbor
Average Daily Rate (ADR) Airbnb Trends in National Harbor (2026)
Effective short term rental pricing strategy in National Harbor involves understanding monthly ADR fluctuations. The Average Daily Rate (ADR) for Airbnb in National Harbor typically peaks in June and dips lowest during February. Leveraging Airbnb dynamic pricing tools or strategies based on this seasonality can significantly boost revenue. Here's a look at the typical nightly rates achieved:
- Best-in-class properties (Top 10%) command rates of $530+ per night, often due to premium features or locations.
- Strong performing properties (Top 25%) achieve nightly rates of $377 or more.
- Typical properties (Median) charge around $299 per night.
- Entry-level properties (Bottom 25%) earn around $222 per night.
Average Daily Rate (ADR) Trend by Month in National Harbor
Get Live National Harbor Market Intelligence 👇

Explore Real-time Analytics
Airbnb Seasonality Analysis & Trends in National Harbor (2026)
Peak Season (June, April, July)
- Revenue averages $4,355 per month
- Occupancy rates average 45.3%
- Daily rates average $333
Shoulder Season
- Revenue averages $3,455 per month
- Occupancy maintains around 37.8%
- Daily rates hold near $321
Low Season (January, November, December)
- Revenue drops to average $2,413 per month
- Occupancy decreases to average 26.8%
- Daily rates adjust to average $328
Seasonality Insights for National Harbor
- The Airbnb seasonality in National Harbor shows highly seasonal trends requiring careful strategy. While the sections above show seasonal averages, it's also insightful to look at the extremes:
- During the high season, the absolute peak month showcases National Harbor's highest earning potential, with monthly revenues capable of climbing to $4,405, occupancy reaching a high of 46.5%, and ADRs peaking at $346.
- Conversely, the slowest single month of the year, typically falling within the low season, marks the market's lowest point. In this month, revenue might dip to $2,006, occupancy could drop to 19.6%, and ADRs may adjust down to $307.
- Understanding both the seasonal averages and these monthly peaks and troughs in revenue, occupancy, and ADR is crucial for maximizing your Airbnb profit potential in National Harbor.
Seasonal Strategies for Maximizing Profit
- Peak Season: Maximize revenue through premium pricing and potentially longer minimum stays. Ensure high availability.
- Low Season: Offer competitive pricing, special promotions (e.g., extended stay discounts), and flexible cancellation policies. Target off-season travelers like remote workers or budget-conscious guests.
- Shoulder Seasons: Implement dynamic pricing that balances peak and low rates. Target weekend travelers or specific events. Offer slightly more flexible terms than peak season.
- Regularly analyze your own performance against these National Harbor seasonality benchmarks and adjust your pricing and availability strategy accordingly.
Best Areas for Airbnb Investment in National Harbor (2026)
Exploring the top neighborhoods for short-term rentals in National Harbor? This section highlights key areas, outlining why they are attractive for hosts and guests, along with notable local attractions. Consider these locations based on your target guest profile and investment strategy.
| Neighborhood / Area | Why Host Here? (Target Guests & Appeal) | Key Attractions & Landmarks |
|---|---|---|
| National Harbor Waterfront | The vibrant waterfront area is packed with dining, shopping, and entertainment options. It's a prime location for tourists visiting the area, providing easy access to the Potomac River and numerous attractions. | The Awakening Sculpture, National Harbor Marina, The Capital Wheel, Waterfront Park, MGM National Harbor Casino |
| Oxon Hill | Adjacent to National Harbor, Oxon Hill offers a quieter setting with its residential neighborhoods and proximity to parks, making it ideal for families visiting the DC area. | Oxon Hill Manor, Mount Vernon Trail, Fort Washington Park, Woodland Riverfront Park |
| Gaylord National Resort | This area is a major destination for conferences and events. The hotel attracts many visitors, making it a great spot for short-term rentals. | Gaylord National Resort & Convention Center, Indoor Garden, Various restaurants and shops |
| Old Town Alexandria | Just a short drive from National Harbor, Old Town Alexandria features historic charm, waterfront views, and an array of dining and shopping options. A popular destination for tourists. | King Street, Torpedo Factory Art Center, Carlyle House, Old Town Waterfront, George Washington Masonic National Memorial |
| Washington, D.C. | The nation's capital is a major draw for tourists and business travelers. Staying near National Harbor allows easy access to all the monuments, museums, and attractions D.C. has to offer. | The White House, Smithsonian Museums, Lincoln Memorial, National Mall |
| Suitland | Suitland offers a more suburban experience, with easy access to the metro and local attractions. It's suitable for families and longer stays. | Suitland Parkway, Suitland National Park |
| Forest Heights | A residential area with a community feel, great for families looking to enjoy a longer stay while exploring the D.C. area. | Forest Heights Park, Access to public transport |
| Capitol Heights | Located slightly to the east of DC, this area is growing in popularity due to its affordability and potential for new developments. It's gaining attention as a location for visitors. | Capitol Heights Metro Station, Local parks, Nearby shopping areas |
Understanding Airbnb License Requirements & STR Laws in National Harbor (2026)
Yes, National Harbor, Maryland, United States enforces high STR regulations. Obtaining a license and ensuring compliance is almost certainly required according to current 2026 STR laws. Always verify the latest short term rental regulations and Airbnb license requirements directly with local government authorities for National Harbor to ensure full compliance before hosting.
(Source: AirROI data, 2026, based on 98% licensed listings)
Top Performing Airbnb Properties in National Harbor (2026)
Benchmark your potential! Explore examples of top-performing Airbnb properties in National Harborbased on Trailing Twelve Month (TTM) revenue. Analyze their characteristics, revenue, occupancy rate, and ADR to understand what drives success in this market.
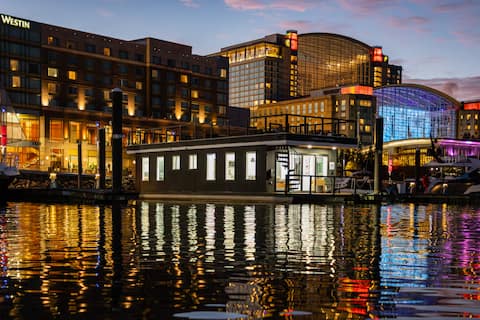
Flohom 4 | Majestic Sunsets with 360° Views
Entire Place • 1 bedroom
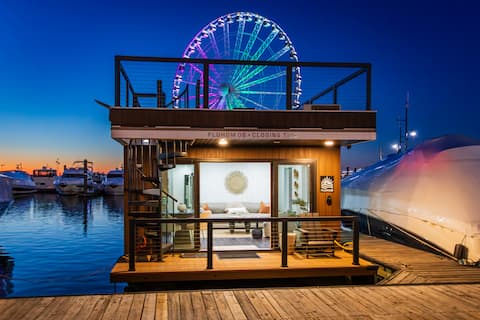
Flohom 6 | Unmatched 360° Waterfront Views
Entire Place • 2 bedrooms
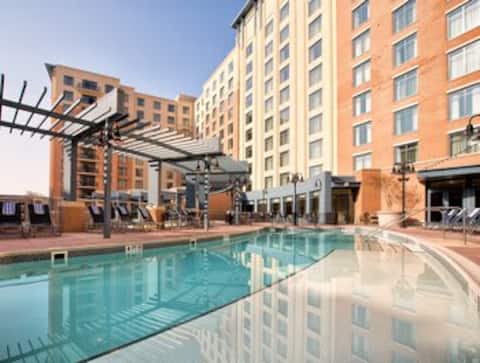
Wyndham National Harbor | 3BR/2BA King Bed Suite
Entire Place • 3 bedrooms
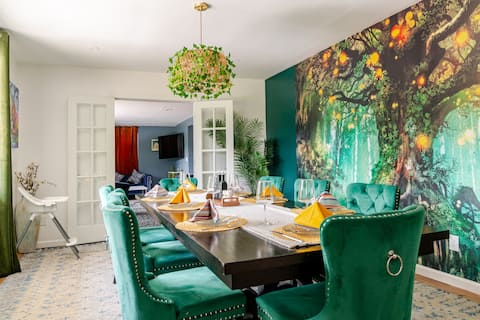
7BD Amazonia Duplex-style home
Entire Place • 7 bedrooms

National Harbor Resort - 2 Bedroom Mobility
Private Room • 2 bedrooms

2 BEDROOM DELUXE - Wyndham National Harbor Resort
Entire Place • 2 bedrooms
Note: Performance varies based on location, size, amenities, seasonality, and management quality. Data reflects the past 12 months.
Top Performing Airbnb Hosts in National Harbor (2026)
Learn from the best! This table showcases top-performing Airbnb hosts in National Harbor based on the number of properties managed and estimated total revenue over the past year. Analyze their scale and performance metrics.
| Host Name | Properties | Grossing Revenue | Stay Reviews | Avg Rating |
|---|---|---|---|---|
| Elijah | 43 | $1,261,584 | 428 | 4.85/5.0 |
| Brad And Sarah | 13 | $655,236 | 270 | 4.82/5.0 |
| Brooke | 16 | $483,656 | 164 | 4.89/5.0 |
| Live Suite | 20 | $455,327 | 114 | 4.84/5.0 |
| Chris | 16 | $385,439 | 187 | 4.98/5.0 |
| Flohom | 2 | $373,379 | 50 | 4.99/5.0 |
| David | 14 | $370,528 | 136 | 4.84/5.0 |
| Resort | 6 | $347,507 | 278 | 4.83/5.0 |
| Todd | 8 | $309,001 | 144 | 4.99/5.0 |
| Resort Stay | 9 | $185,937 | 80 | 4.79/5.0 |
Analyzing the strategies of top hosts, such as their property selection, pricing, and guest communication, can offer valuable lessons for optimizing your own Airbnb operations in National Harbor.
Dive Deeper: Advanced National Harbor STR Market Data (2026)
Ready to unlock more insights? AirROI provides access to advanced metrics and comprehensive Airbnb data for National Harbor. Explore detailed analytics beyond this report to refine your investment strategy, optimize pricing, and maximize your vacation rental profits.
Explore Advanced MetricsNational Harbor Short-Term Rental Market Composition (2026): Property & Room Types
Room Type Distribution
Property Type Distribution
Market Composition Insights for National Harbor
- The National Harbor Airbnb market composition is heavily skewed towards Entire Home/Apt listings, which make up 71.8% of the 277 active rentals. This indicates strong guest preference for privacy and space.
- Looking at the property type distribution in National Harbor, Apartment/Condo properties are the most common (57.8%), reflecting the local real estate landscape.
- Houses represent a significant 16.2% portion, catering likely to families or larger groups.
- The presence of 21.7% Hotel/Boutique listings indicates integration with traditional hospitality.
- Smaller segments like others, outdoor/unique (combined 4.3%) offer potential for unique stay experiences.
National Harbor Airbnb Room Capacity Analysis (2026): Bedroom Distribution
Distribution of Listings by Number of Bedrooms
Room Capacity Insights for National Harbor
- The dominant room capacity in National Harbor is 2 bedrooms listings, making up 45.1% of the market. This suggests a strong demand for properties suitable for couples or solo travelers.
- Together, 2 bedrooms and 1 bedroom properties represent 69.6% of the active Airbnb listings in National Harbor, indicating a high concentration in these sizes.
- A significant 23.5% of listings offer 3+ bedrooms, catering to larger groups and families seeking more space in National Harbor.
National Harbor Vacation Rental Guest Capacity Trends (2026)
Distribution of Listings by Guest Capacity
Guest Capacity Insights for National Harbor
- The most common guest capacity trend in National Harbor vacation rentals is listings accommodating 8+ guests (54.9%). This suggests the primary traveler segment is likely larger groups.
- Properties designed for 8+ guests and 4 guests dominate the National Harbor STR market, accounting for 78.4% of listings.
- 64.7% of properties accommodate 6+ guests, serving the market segment for larger families or group travel in National Harbor.
- On average, properties in National Harbor are equipped to host 6.1 guests.
National Harbor Airbnb Booking Patterns (2026): Available vs. Booked Days
Available Days Distribution
Booked Days Distribution
Booking Pattern Insights for National Harbor
- The most common availability pattern in National Harbor falls within the 271-366 days range, representing 59.9% of listings. This suggests many properties have significant open periods on their calendars.
- Approximately 87.0% of listings show high availability (181+ days open annually), indicating potential for increased bookings or specific owner usage patterns.
- For booked days, the 31-90 days range is most frequent in National Harbor (37.9%), reflecting common guest stay durations or potential owner blocking patterns.
- A notable 13.4% of properties secure long booking periods (181+ days booked per year), highlighting successful long-term rental strategies or significant owner usage.
National Harbor Airbnb Minimum Stay Requirements Analysis
Distribution of Listings by Minimum Night Requirement
1 Night
20 listings
7.2% of total
2 Nights
152 listings
54.9% of total
3 Nights
35 listings
12.6% of total
4-6 Nights
6 listings
2.2% of total
7-29 Nights
3 listings
1.1% of total
30+ Nights
61 listings
22% of total
Key Insights
- The most prevalent minimum stay requirement in National Harbor is 2 Nights, adopted by 54.9% of listings. This highlights the market's preference for shorter, flexible bookings.
- A strong majority (62.1%) of the National Harbor Airbnb data shows acceptance of very short stays (1-2 nights), indicating a dynamic, high-turnover market.
- A significant segment (22%) caters to monthly stays (30+ nights) in National Harbor, pointing to opportunities in the extended-stay market.
Recommendations
- Align with the market by considering a 2 Nights minimum stay, as 54.9% of National Harbor hosts use this setting.
- If feasible, allowing 1-night stays, especially midweek or during low season, could capture last-minute bookings, as only 7.2% currently do.
- A 2-night minimum appears standard (54.9%). Consider this for weekends or peak periods.
- Explore offering discounts for stays of 30+ nights to attract the 22% of the market seeking extended stays.
- Adjust minimum nights based on seasonality – potentially shorter during low season and longer during peak demand periods in National Harbor.
National Harbor Airbnb Cancellation Policy Trends Analysis (2026)
Super Strict 60 Days
2 listings
0.7% of total
Super Strict 30 Days
3 listings
1.1% of total
Flexible
13 listings
4.7% of total
Moderate
21 listings
7.6% of total
Firm
86 listings
31% of total
Strict
152 listings
54.9% of total
Cancellation Policy Insights for National Harbor
- The prevailing Airbnb cancellation policy trend in National Harbor is Strict, used by 54.9% of listings.
- A majority (85.9%) of hosts in National Harbor utilize Firm or Strict policies, indicating a market where hosts prioritize booking security.
Recommendations for Hosts
- Consider adopting a Strict policy to align with the 54.9% market standard in National Harbor.
- With 54.9% using Strict terms, this is a viable option in National Harbor, particularly for high-value properties or during peak demand periods.
- Regularly review your cancellation policy against competitors and market demand shifts in National Harbor.
National Harbor STR Booking Lead Time Analysis (2026)
Average Booking Lead Time by Month
Booking Lead Time Insights for National Harbor
- The overall average booking lead time for vacation rentals in National Harbor is 44 days.
- Guests book furthest in advance for stays during January (average 87 days), likely coinciding with peak travel demand or local events.
- The shortest booking windows occur for stays in September (average 29 days), indicating more last-minute travel plans during this time.
- Seasonally, Winter (61 days avg.) sees the longest lead times, while Fall (33 days avg.) has the shortest, reflecting typical travel planning cycles.
Recommendations for Hosts
- Use the overall average lead time (44 days) as a baseline for your pricing and availability strategy in National Harbor.
- For January stays, consider implementing length-of-stay discounts or slightly higher rates for bookings made less than 87 days out to capitalize on advance planning.
- Target marketing efforts for the Winter season well in advance (at least 61 days) to capture early planners.
- Monitor your own booking lead times against these National Harbor averages to identify opportunities for dynamic pricing adjustments.
Popular & Essential Airbnb Amenities in National Harbor (2026)
Amenity Prevalence
Amenity Insights for National Harbor
- Essential amenities in National Harbor that guests expect include: Air conditioning, Wifi, Smoke alarm, Kitchen, TV. Lacking these (any) could significantly impact bookings.
- Popular amenities like Fire extinguisher, Heating, Hair dryer are common but not universal. Offering these can provide a competitive edge.
Recommendations for Hosts
- Ensure your listing includes all essential amenities for National Harbor: Air conditioning, Wifi, Smoke alarm, Kitchen, TV.
- Prioritize adding missing essentials: Air conditioning, Wifi, Smoke alarm, Kitchen, TV.
- Consider adding popular differentiators like Fire extinguisher or Heating to increase appeal.
- Highlight unique or less common amenities you offer (e.g., hot tub, dedicated workspace, EV charger) in your listing description and photos.
- Regularly check competitor amenities in National Harbor to stay competitive.
National Harbor Airbnb Guest Demographics & Profile Analysis (2026)
Guest Profile Summary for National Harbor
- The typical guest profile for Airbnb in National Harbor consists of primarily domestic travelers (83%), often arriving from nearby Washington, typically belonging to the Post-2000s (Gen Z/Alpha) group (50%), primarily speaking English or Spanish.
- Domestic travelers account for 83.3% of guests.
- Key international markets include United States (83.3%) and DC (3.5%).
- Top languages spoken are English (66.3%) followed by Spanish (11.2%).
- A significant demographic segment is the Post-2000s (Gen Z/Alpha) group, representing 50% of guests.
Recommendations for Hosts
- Target domestic marketing efforts towards travelers from Washington and New York.
- Tailor amenities and listing descriptions to appeal to the dominant Post-2000s (Gen Z/Alpha) demographic (e.g., highlight fast WiFi, smart home features, local guides).
- Highlight unique local experiences or amenities relevant to the primary guest profile.
- Consider seasonal promotions aligned with peak travel times for key origin markets.
Nearby Short-Term Rental Market Comparison
How does the National Harbor Airbnb market stack up against its neighbors? Compare key performance metrics like average monthly revenue, ADR, and occupancy rates in surrounding areas to understand the broader regional STR landscape.
| Market | Active Properties | Monthly Revenue | Daily Rate | Avg. Occupancy |
|---|---|---|---|---|
| Centreville | 17 | $6,298 | $565.66 | 45% |
| McGaheysville | 83 | $6,156 | $431.72 | 45% |
| Mayo | 13 | $5,915 | $447.58 | 51% |
| Shannondale | 45 | $5,808 | $337.30 | 54% |
| Stevensville | 80 | $5,412 | $556.79 | 41% |
| Bentonville | 23 | $5,372 | $420.82 | 51% |
| Nellysford | 62 | $5,276 | $426.33 | 39% |
| Weems | 11 | $5,077 | $417.22 | 47% |
| Lower Windsor Township | 14 | $5,062 | $428.71 | 45% |
| Arundel on the Bay | 29 | $5,043 | $486.96 | 40% |