Laurel Airbnb Market Analysis 2026: Short Term Rental Data & Vacation Rental Statistics in Maryland, United States
Is Airbnb profitable in Laurel in 2026? Explore comprehensive Airbnb analytics for Laurel, Maryland, United States to uncover income potential. This 2026 STR market report for Laurel, based on AirROI data from February 2025 to January 2026, reveals key trends in the niche market of 48 active listings.
Whether you're considering an Airbnb investment in Laurel, optimizing your existing vacation rental, or exploring rental arbitrage opportunities, understanding the Laurel Airbnb data is crucial. Navigating the high regulation landscape is key to maximizing your short term rental income potential. Let's dive into the specifics.
Key Laurel Airbnb Performance Metrics Overview
Monthly Airbnb Revenue Variations & Income Potential in Laurel (2026)
Understanding the monthly revenue variations for Airbnb listings in Laurel is key to maximizing your short term rental income potential. Seasonality significantly impacts earnings. Our analysis, based on data from the past 12 months, shows that the peak revenue month for STRs in Laurel is typically October, while January often presents the lowest earnings, highlighting opportunities for strategic pricing adjustments during shoulder and low seasons. Explore the typical Airbnb income in Laurel across different performance tiers:
- Best-in-class properties (Top 10%) achieve $3,601+ monthly, often utilizing dynamic pricing and superior guest experiences.
- Strong performing properties (Top 25%) earn $2,091 or more, indicating effective management and desirable locations/amenities.
- Typical properties (Median) generate around $1,088 per month, representing the average market performance.
- Entry-level properties (Bottom 25%) see earnings around $428, often with potential for optimization.
Average Monthly Airbnb Earnings Trend in Laurel
Laurel Airbnb Occupancy Rate Trends (2026)
Maximize your bookings by understanding the Laurel STR occupancy trends. Seasonal demand shifts significantly influence how often properties are booked. Typically, Augustsees the highest demand (peak season occupancy), while January experiences the lowest (low season). Effective strategies, like adjusting minimum stays or offering promotions, can boost occupancy during slower periods. Here's how different property tiers perform in Laurel:
- Best-in-class properties (Top 10%) achieve 74%+ occupancy, indicating high desirability and potentially optimized availability.
- Strong performing properties (Top 25%) maintain 56% or higher occupancy, suggesting good market fit and guest satisfaction.
- Typical properties (Median) have an occupancy rate around 31%.
- Entry-level properties (Bottom 25%) average 16% occupancy, potentially facing higher vacancy.
Average Monthly Occupancy Rate Trend in Laurel
Average Daily Rate (ADR) Airbnb Trends in Laurel (2026)
Effective short term rental pricing strategy in Laurel involves understanding monthly ADR fluctuations. The Average Daily Rate (ADR) for Airbnb in Laurel typically peaks in November and dips lowest during February. Leveraging Airbnb dynamic pricing tools or strategies based on this seasonality can significantly boost revenue. Here's a look at the typical nightly rates achieved:
- Best-in-class properties (Top 10%) command rates of $210+ per night, often due to premium features or locations.
- Strong performing properties (Top 25%) achieve nightly rates of $122 or more.
- Typical properties (Median) charge around $77 per night.
- Entry-level properties (Bottom 25%) earn around $57 per night.
Average Daily Rate (ADR) Trend by Month in Laurel
Get Live Laurel Market Intelligence 👇

Explore Real-time Analytics
Airbnb Seasonality Analysis & Trends in Laurel (2026)
Peak Season (October, May, July)
- Revenue averages $1,880 per month
- Occupancy rates average 41.6%
- Daily rates average $117
Shoulder Season
- Revenue averages $1,534 per month
- Occupancy maintains around 38.8%
- Daily rates hold near $115
Low Season (January, February, September)
- Revenue drops to average $1,184 per month
- Occupancy decreases to average 28.3%
- Daily rates adjust to average $118
Seasonality Insights for Laurel
- The Airbnb seasonality in Laurel shows moderate seasonality with distinct peak and low periods. While the sections above show seasonal averages, it's also insightful to look at the extremes:
- During the high season, the absolute peak month showcases Laurel's highest earning potential, with monthly revenues capable of climbing to $1,996, occupancy reaching a high of 45.6%, and ADRs peaking at $127.
- Conversely, the slowest single month of the year, typically falling within the low season, marks the market's lowest point. In this month, revenue might dip to $1,042, occupancy could drop to 23.7%, and ADRs may adjust down to $106.
- Understanding both the seasonal averages and these monthly peaks and troughs in revenue, occupancy, and ADR is crucial for maximizing your Airbnb profit potential in Laurel.
Seasonal Strategies for Maximizing Profit
- Peak Season: Maximize revenue through premium pricing and potentially longer minimum stays. Ensure high availability.
- Low Season: Offer competitive pricing, special promotions (e.g., extended stay discounts), and flexible cancellation policies. Target off-season travelers like remote workers or budget-conscious guests.
- Shoulder Seasons: Implement dynamic pricing that balances peak and low rates. Target weekend travelers or specific events. Offer slightly more flexible terms than peak season.
- Regularly analyze your own performance against these Laurel seasonality benchmarks and adjust your pricing and availability strategy accordingly.
Best Areas for Airbnb Investment in Laurel (2026)
Exploring the top neighborhoods for short-term rentals in Laurel? This section highlights key areas, outlining why they are attractive for hosts and guests, along with notable local attractions. Consider these locations based on your target guest profile and investment strategy.
| Neighborhood / Area | Why Host Here? (Target Guests & Appeal) | Key Attractions & Landmarks |
|---|---|---|
| Downtown Laurel | The heart of Laurel, offering easy access to local shops, restaurants, and public transportation. Ideal for guests looking for convenience and proximity to urban amenities. | Laurel Park Racetrack, Montpelier Mansion, Main Street Laurel, Laurel Library, Laurel College Center |
| Savage Mill | Historic district with a charming vibe, featuring unique shops and restaurants. Attracts visitors looking for a quaint atmosphere and cultural experiences. | Savage Mill Historic District, The Mill Restaurant and Brewery, Old Town Savage, Little Savage Park |
| Laurel Lakes | Residential area with beautiful lakes and parks, great for families and outdoor enthusiasts. Attracts guests who appreciate nature and community. | Laurel Lakes, Granville Gude Park, Cedarville State Forest, Laurel Golf Club |
| Russett | A planned community that offers a mix of residential and commercial spaces, appealing for those seeking suburban comfort with nearby amenities. | Russett Green Community, Ronald Reagan Washington National Airport, Shopping centers nearby |
| Montpelier | A picturesque area known for its historic sites and outdoor recreation, making it attractive to history lovers and nature seekers alike. | Montpelier Mansion, Montpelier Park, The Patuxent River |
| Cedarhurst | A quiet suburban neighborhood that offers a peaceful retreat while being close to metropolitan amenities, ideal for families and travelers seeking tranquility. | Cedarhurst Park, Local shops and restaurants, Community events |
| Bowie | Nearby city with a variety of attractions and amenities, appealing to guests looking for a vibrant urban experience close to Laurel. | Bowie Town Center, Bowie State University, National Capital Radio & Television Museum |
| Belair | Historic neighborhood with beautiful homes and parks, attracting visitors interested in heritage and community events. | Belair Mansion, Belair Stable Museum, Locust Park |
Understanding Airbnb License Requirements & STR Laws in Laurel (2026)
Yes, Laurel, Maryland, United States enforces high STR regulations. Obtaining a license and ensuring compliance is almost certainly required according to current 2026 STR laws. Always verify the latest short term rental regulations and Airbnb license requirements directly with local government authorities for Laurel to ensure full compliance before hosting.
(Source: AirROI data, 2026, based on 92% licensed listings)
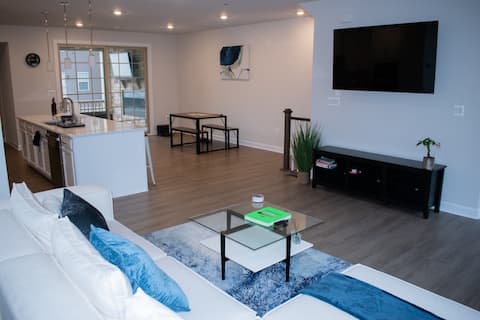
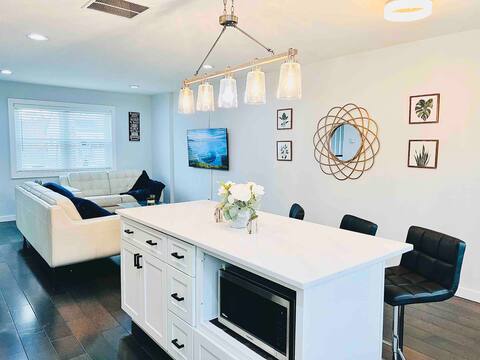
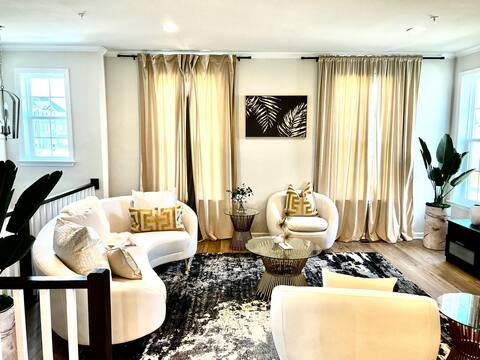
Top Performing Airbnb Properties in Laurel (2026)
Benchmark your potential! Explore examples of top-performing Airbnb properties in Laurelbased on Trailing Twelve Month (TTM) revenue. Analyze their characteristics, revenue, occupancy rate, and ADR to understand what drives success in this market.
Luxurious Townhome near Washington DC
Entire Place • 4 bedrooms
MODERN SLEEK 4-BEDS 2-BATH
Entire Place • 4 bedrooms

1BRUpscale, Cozy, Luxury Unit.
Entire Place • 1 bedroom
Cozy New Townhome in Laurel, MD
Entire Place • 3 bedrooms
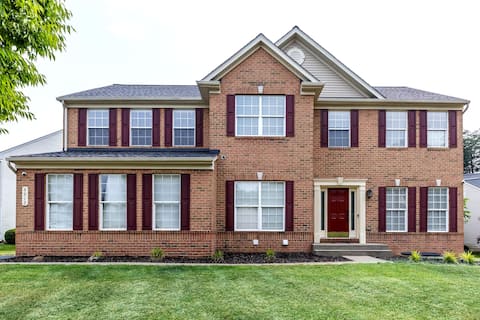
Laurel Family Home in Balt/DC!
Entire Place • 7 bedrooms
Contee House
Entire Place • 4 bedrooms
Note: Performance varies based on location, size, amenities, seasonality, and management quality. Data reflects the past 12 months.
Top Performing Airbnb Hosts in Laurel (2026)
Learn from the best! This table showcases top-performing Airbnb hosts in Laurel based on the number of properties managed and estimated total revenue over the past year. Analyze their scale and performance metrics.
| Host Name | Properties | Grossing Revenue | Stay Reviews | Avg Rating |
|---|---|---|---|---|
| Reina | 5 | $65,170 | 92 | 4.83/5.0 |
| Folarin | 1 | $55,062 | 87 | 4.93/5.0 |
| Tigi | 1 | $43,264 | 77 | 4.77/5.0 |
| Collins | 1 | $34,092 | 25 | 4.76/5.0 |
| Dominic | 1 | $30,566 | 86 | 4.87/5.0 |
| Evelyn | 1 | $25,267 | 24 | 4.75/5.0 |
| Sam | 5 | $25,164 | 45 | 4.77/5.0 |
| Geeta | 1 | $23,376 | 19 | 4.89/5.0 |
| Shirley | 4 | $21,677 | 14 | 4.79/5.0 |
| Lydia | 1 | $19,282 | 102 | 4.94/5.0 |
Analyzing the strategies of top hosts, such as their property selection, pricing, and guest communication, can offer valuable lessons for optimizing your own Airbnb operations in Laurel.
Dive Deeper: Advanced Laurel STR Market Data (2026)
Ready to unlock more insights? AirROI provides access to advanced metrics and comprehensive Airbnb data for Laurel. Explore detailed analytics beyond this report to refine your investment strategy, optimize pricing, and maximize your vacation rental profits.
Explore Advanced MetricsLaurel Short-Term Rental Market Composition (2026): Property & Room Types
Room Type Distribution
Property Type Distribution
Market Composition Insights for Laurel
- The Laurel Airbnb market composition is heavily skewed towards Private Room listings, which make up 58.3% of the 48 active rentals. This indicates strong guest preference for privacy and space.
- Looking at the property type distribution in Laurel, House properties are the most common (72.9%), reflecting the local real estate landscape.
- Houses represent a significant 72.9% portion, catering likely to families or larger groups.
- Smaller segments like hotel/boutique, outdoor/unique (combined 6.3%) offer potential for unique stay experiences.
Laurel Airbnb Room Capacity Analysis (2026): Bedroom Distribution
Distribution of Listings by Number of Bedrooms
Room Capacity Insights for Laurel
- The dominant room capacity in Laurel is 1 bedroom listings, making up 22.9% of the market. This suggests a strong demand for properties suitable for couples or solo travelers.
- Together, 1 bedroom and 3 bedrooms properties represent 33.3% of the active Airbnb listings in Laurel, indicating a high concentration in these sizes.
- A significant 20.8% of listings offer 3+ bedrooms, catering to larger groups and families seeking more space in Laurel.
Laurel Vacation Rental Guest Capacity Trends (2026)
Distribution of Listings by Guest Capacity
Guest Capacity Insights for Laurel
- The most common guest capacity trend in Laurel vacation rentals is listings accommodating 2 guests (10.4%). This suggests the primary traveler segment is likely couples or solo travelers.
- Properties designed for 2 guests and 8+ guests dominate the Laurel STR market, accounting for 20.8% of listings.
- 18.8% of properties accommodate 6+ guests, serving the market segment for larger families or group travel in Laurel.
- On average, properties in Laurel are equipped to host 2.0 guests.
Laurel Airbnb Booking Patterns (2026): Available vs. Booked Days
Available Days Distribution
Booked Days Distribution
Booking Pattern Insights for Laurel
- The most common availability pattern in Laurel falls within the 271-366 days range, representing 66.7% of listings. This suggests many properties have significant open periods on their calendars.
- Approximately 91.7% of listings show high availability (181+ days open annually), indicating potential for increased bookings or specific owner usage patterns.
- For booked days, the 31-90 days range is most frequent in Laurel (39.6%), reflecting common guest stay durations or potential owner blocking patterns.
- A notable 12.5% of properties secure long booking periods (181+ days booked per year), highlighting successful long-term rental strategies or significant owner usage.
Laurel Airbnb Minimum Stay Requirements Analysis
Distribution of Listings by Minimum Night Requirement
1 Night
7 listings
14.6% of total
2 Nights
7 listings
14.6% of total
3 Nights
5 listings
10.4% of total
4-6 Nights
3 listings
6.3% of total
7-29 Nights
10 listings
20.8% of total
30+ Nights
16 listings
33.3% of total
Key Insights
- The most prevalent minimum stay requirement in Laurel is 30+ Nights, adopted by 33.3% of listings. This highlights the market's preference for longer commitments.
- A significant segment (33.3%) caters to monthly stays (30+ nights) in Laurel, pointing to opportunities in the extended-stay market.
Recommendations
- Align with the market by considering a 30+ Nights minimum stay, as 33.3% of Laurel hosts use this setting.
- If feasible, allowing 1-night stays, especially midweek or during low season, could capture last-minute bookings, as only 14.6% currently do.
- Explore offering discounts for stays of 30+ nights to attract the 33.3% of the market seeking extended stays.
- Adjust minimum nights based on seasonality – potentially shorter during low season and longer during peak demand periods in Laurel.
Laurel Airbnb Cancellation Policy Trends Analysis (2026)
Flexible
17 listings
36.2% of total
Moderate
12 listings
25.5% of total
Firm
11 listings
23.4% of total
Strict
7 listings
14.9% of total
Cancellation Policy Insights for Laurel
- The prevailing Airbnb cancellation policy trend in Laurel is Flexible, used by 36.2% of listings.
- There's a relatively balanced mix between guest-friendly (61.7%) and stricter (38.3%) policies, offering choices for different guest needs.
Recommendations for Hosts
- Consider adopting a Flexible policy to align with the 36.2% market standard in Laurel.
- Using a Strict policy might deter some guests, as only 14.9% of listings use it. Evaluate if potential revenue protection outweighs possible lower booking rates.
- Regularly review your cancellation policy against competitors and market demand shifts in Laurel.
Laurel STR Booking Lead Time Analysis (2026)
Average Booking Lead Time by Month
Booking Lead Time Insights for Laurel
- The overall average booking lead time for vacation rentals in Laurel is 29 days.
- Guests book furthest in advance for stays during November (average 88 days), likely coinciding with peak travel demand or local events.
- The shortest booking windows occur for stays in March (average 9 days), indicating more last-minute travel plans during this time.
- Seasonally, Fall (53 days avg.) sees the longest lead times, while Winter (15 days avg.) has the shortest, reflecting typical travel planning cycles.
Recommendations for Hosts
- Use the overall average lead time (29 days) as a baseline for your pricing and availability strategy in Laurel.
- For November stays, consider implementing length-of-stay discounts or slightly higher rates for bookings made less than 88 days out to capitalize on advance planning.
- During March, focus on last-minute booking availability and promotions, as guests book with very short notice (9 days avg.).
- Target marketing efforts for the Fall season well in advance (at least 53 days) to capture early planners.
- Monitor your own booking lead times against these Laurel averages to identify opportunities for dynamic pricing adjustments.
Popular & Essential Airbnb Amenities in Laurel (2026)
Amenity Prevalence
Amenity Insights for Laurel
- Essential amenities in Laurel that guests expect include: Air conditioning, Wifi, TV. Lacking these (any) could significantly impact bookings.
- Popular amenities like Smoke alarm, Heating, Carbon monoxide alarm are common but not universal. Offering these can provide a competitive edge.
Recommendations for Hosts
- Ensure your listing includes all essential amenities for Laurel: Air conditioning, Wifi, TV.
- Prioritize adding missing essentials: Wifi, TV.
- Consider adding popular differentiators like Smoke alarm or Heating to increase appeal.
- Highlight unique or less common amenities you offer (e.g., hot tub, dedicated workspace, EV charger) in your listing description and photos.
- Regularly check competitor amenities in Laurel to stay competitive.
Laurel Airbnb Guest Demographics & Profile Analysis (2026)
Guest Profile Summary for Laurel
- The typical guest profile for Airbnb in Laurel consists of primarily domestic travelers (92%), often arriving from nearby New York, typically belonging to the Post-2000s (Gen Z/Alpha) group (50%), primarily speaking English or Spanish.
- Domestic travelers account for 91.5% of guests.
- Key international markets include United States (91.5%) and DC (3.9%).
- Top languages spoken are English (66%) followed by Spanish (12%).
- A significant demographic segment is the Post-2000s (Gen Z/Alpha) group, representing 50% of guests.
Recommendations for Hosts
- Target domestic marketing efforts towards travelers from New York and Washington.
- Tailor amenities and listing descriptions to appeal to the dominant Post-2000s (Gen Z/Alpha) demographic (e.g., highlight fast WiFi, smart home features, local guides).
- Highlight unique local experiences or amenities relevant to the primary guest profile.
- Consider seasonal promotions aligned with peak travel times for key origin markets.
Nearby Short-Term Rental Market Comparison
How does the Laurel Airbnb market stack up against its neighbors? Compare key performance metrics like average monthly revenue, ADR, and occupancy rates in surrounding areas to understand the broader regional STR landscape.
| Market | Active Properties | Monthly Revenue | Daily Rate | Avg. Occupancy |
|---|---|---|---|---|
| Polk Township | 15 | $6,974 | $520.26 | 38% |
| Lemont | 21 | $6,940 | $873.93 | 37% |
| College Township | 83 | $6,551 | $848.63 | 36% |
| Centreville | 17 | $6,298 | $565.66 | 45% |
| State College | 192 | $6,081 | $712.29 | 40% |
| Mayo | 13 | $5,915 | $447.58 | 51% |
| Shannondale | 45 | $5,808 | $337.30 | 54% |
| Hilltown Township | 11 | $5,557 | $578.96 | 40% |
| Hellam Township | 24 | $5,496 | $386.69 | 45% |
| Stevensville | 80 | $5,412 | $556.79 | 41% |