Knoxville Airbnb Market Analysis 2026: Short Term Rental Data & Vacation Rental Statistics in Maryland, United States
Is Airbnb profitable in Knoxville in 2026? Explore comprehensive Airbnb analytics for Knoxville, Maryland, United States to uncover income potential. This 2026 STR market report for Knoxville, based on AirROI data from February 2025 to January 2026, reveals key trends in the niche market of 21 active listings.
Whether you're considering an Airbnb investment in Knoxville, optimizing your existing vacation rental, or exploring rental arbitrage opportunities, understanding the Knoxville Airbnb data is crucial. Leveraging the low regulation environment is key to maximizing your short term rental income potential. Let's dive into the specifics.
Key Knoxville Airbnb Performance Metrics Overview
Monthly Airbnb Revenue Variations & Income Potential in Knoxville (2026)
Understanding the monthly revenue variations for Airbnb listings in Knoxville is key to maximizing your short term rental income potential. Seasonality significantly impacts earnings. Our analysis, based on data from the past 12 months, shows that the peak revenue month for STRs in Knoxville is typically August, while February often presents the lowest earnings, highlighting opportunities for strategic pricing adjustments during shoulder and low seasons. Explore the typical Airbnb income in Knoxville across different performance tiers:
- Best-in-class properties (Top 10%) achieve $9,473+ monthly, often utilizing dynamic pricing and superior guest experiences.
- Strong performing properties (Top 25%) earn $6,465 or more, indicating effective management and desirable locations/amenities.
- Typical properties (Median) generate around $2,980 per month, representing the average market performance.
- Entry-level properties (Bottom 25%) see earnings around $1,505, often with potential for optimization.
Average Monthly Airbnb Earnings Trend in Knoxville
Knoxville Airbnb Occupancy Rate Trends (2026)
Maximize your bookings by understanding the Knoxville STR occupancy trends. Seasonal demand shifts significantly influence how often properties are booked. Typically, Augustsees the highest demand (peak season occupancy), while December experiences the lowest (low season). Effective strategies, like adjusting minimum stays or offering promotions, can boost occupancy during slower periods. Here's how different property tiers perform in Knoxville:
- Best-in-class properties (Top 10%) achieve 77%+ occupancy, indicating high desirability and potentially optimized availability.
- Strong performing properties (Top 25%) maintain 60% or higher occupancy, suggesting good market fit and guest satisfaction.
- Typical properties (Median) have an occupancy rate around 41%.
- Entry-level properties (Bottom 25%) average 25% occupancy, potentially facing higher vacancy.
Average Monthly Occupancy Rate Trend in Knoxville
Average Daily Rate (ADR) Airbnb Trends in Knoxville (2026)
Effective short term rental pricing strategy in Knoxville involves understanding monthly ADR fluctuations. The Average Daily Rate (ADR) for Airbnb in Knoxville typically peaks in October and dips lowest during February. Leveraging Airbnb dynamic pricing tools or strategies based on this seasonality can significantly boost revenue. Here's a look at the typical nightly rates achieved:
- Best-in-class properties (Top 10%) command rates of $459+ per night, often due to premium features or locations.
- Strong performing properties (Top 25%) achieve nightly rates of $327 or more.
- Typical properties (Median) charge around $215 per night.
- Entry-level properties (Bottom 25%) earn around $132 per night.
Average Daily Rate (ADR) Trend by Month in Knoxville
Get Live Knoxville Market Intelligence 👇

Explore Real-time Analytics
Airbnb Seasonality Analysis & Trends in Knoxville (2026)
Peak Season (August, July, October)
- Revenue averages $5,595 per month
- Occupancy rates average 53.1%
- Daily rates average $264
Shoulder Season
- Revenue averages $4,271 per month
- Occupancy maintains around 41.7%
- Daily rates hold near $267
Low Season (February, March, April)
- Revenue drops to average $2,976 per month
- Occupancy decreases to average 37.8%
- Daily rates adjust to average $224
Seasonality Insights for Knoxville
- The Airbnb seasonality in Knoxville shows highly seasonal trends requiring careful strategy. While the sections above show seasonal averages, it's also insightful to look at the extremes:
- During the high season, the absolute peak month showcases Knoxville's highest earning potential, with monthly revenues capable of climbing to $6,124, occupancy reaching a high of 58.7%, and ADRs peaking at $280.
- Conversely, the slowest single month of the year, typically falling within the low season, marks the market's lowest point. In this month, revenue might dip to $2,580, occupancy could drop to 35.5%, and ADRs may adjust down to $219.
- Understanding both the seasonal averages and these monthly peaks and troughs in revenue, occupancy, and ADR is crucial for maximizing your Airbnb profit potential in Knoxville.
Seasonal Strategies for Maximizing Profit
- Peak Season: Maximize revenue through premium pricing and potentially longer minimum stays. Ensure high availability.
- Low Season: Offer competitive pricing, special promotions (e.g., extended stay discounts), and flexible cancellation policies. Target off-season travelers like remote workers or budget-conscious guests.
- Shoulder Seasons: Implement dynamic pricing that balances peak and low rates. Target weekend travelers or specific events. Offer slightly more flexible terms than peak season.
- Regularly analyze your own performance against these Knoxville seasonality benchmarks and adjust your pricing and availability strategy accordingly.
Best Areas for Airbnb Investment in Knoxville (2026)
Exploring the top neighborhoods for short-term rentals in Knoxville? This section highlights key areas, outlining why they are attractive for hosts and guests, along with notable local attractions. Consider these locations based on your target guest profile and investment strategy.
| Neighborhood / Area | Why Host Here? (Target Guests & Appeal) | Key Attractions & Landmarks |
|---|---|---|
| Downtown Knoxville | The heart of the city, offering a vibrant downtown experience with shops, restaurants, and nightlife. A prime location for visitors looking to explore the cultural and historical aspects of Knoxville. | Knoxville Museum of Art, Tennessee Theatre, World's Fair Park, Market Square, Ijams Nature Center |
| Old City | A historic district known for its eclectic atmosphere, art galleries, and nightlife. It attracts visitors looking for a lively scene with unique bars and local events. | Old City District, The International, Pilot Light, JK's Bar & Grill, The Square Room |
| North Knoxville | An up-and-coming area with a mix of residential and commercial spaces. Known for its community feel and accessibility to parks and outdoor activities. | Knoxville Zoo, Burlington Park, Caswell Park, Peyton Manning Pass |
| West Knoxville | A suburban area known for its shopping centers and family-friendly environment. Ideal for travelers seeking convenience and comfort, close to attractions like the mall and parks. | West Town Mall, Turkey Creek, Great Smoky Mountains National Park, Blount Mansion |
| South Knoxville | Offers a more relaxed vibe with easy access to nature and the Great Smoky Mountains. Great for those who enjoy outdoor activities and scenic views. | Ijams Nature Center, Urban Wilderness, Knoxville Botanical Garden, McClung Museum |
| East Knoxville | A diverse community with a rich history and cultural experiences. Attractive to visitors interested in exploring local heritage and community events. | East Tennessee Historical Society, Knoxville's Old Gray Cemetery, James White Fort, Willow Creek Golf Club |
| Sequoyah Hills | Residential area with a quiet atmosphere, known for its historic homes and proximity to the river. Appeals to guests looking for tranquility with urban accessibility. | Sequoyah Park, Knoxville Riverwalk, Bearden Beer Market |
| Fountain City | A charming neighborhood known for its parks and family-oriented activities, attracting families and those looking for a slower pace. | Fountain City Park, Dogwood Arts Festival, Theatre in the Park |
Understanding Airbnb License Requirements & STR Laws in Knoxville (2026)
While Knoxville, Maryland, United States currently shows low STR regulations, specific Airbnb license requirements might still exist or change. Always verify the latest short term rental regulations and Airbnb license requirements directly with local government authorities for Knoxville to ensure full compliance before hosting.
(Source: AirROI data, 2026, finding no licensed listings among those analyzed)
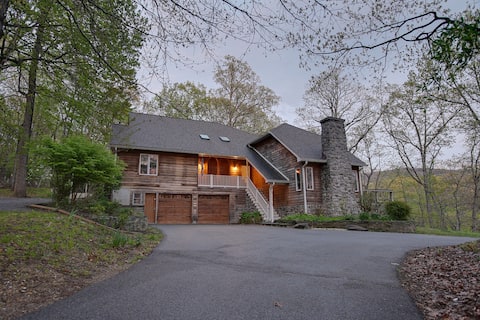
Top Performing Airbnb Properties in Knoxville (2026)
Benchmark your potential! Explore examples of top-performing Airbnb properties in Knoxvillebased on Trailing Twelve Month (TTM) revenue. Analyze their characteristics, revenue, occupancy rate, and ADR to understand what drives success in this market.
Happy Harbor | Riverside w/ Water Hole + Game Room
Entire Place • 5 bedrooms

4 King Suites | Hot Tub | FirePit | Arcade | Games
Entire Place • 4 bedrooms

Modern Cabin | Kid Playhouse | 5 acres | FirePit
Entire Place • 3 bedrooms
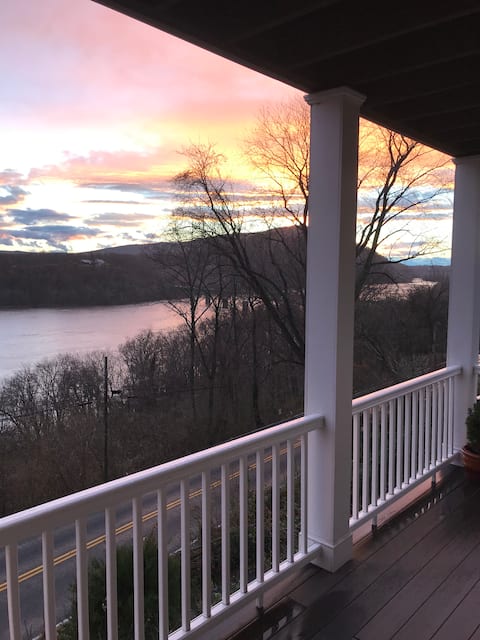
Harpers Ferry River View
Entire Place • 5 bedrooms

An Escape Bordering National Park land 1 mi to C&O
Entire Place • 4 bedrooms

WATER VIEW River Home for Rent 1 hour from Dc
Entire Place • 5 bedrooms
Note: Performance varies based on location, size, amenities, seasonality, and management quality. Data reflects the past 12 months.
Top Performing Airbnb Hosts in Knoxville (2026)
Learn from the best! This table showcases top-performing Airbnb hosts in Knoxville based on the number of properties managed and estimated total revenue over the past year. Analyze their scale and performance metrics.
| Host Name | Properties | Grossing Revenue | Stay Reviews | Avg Rating |
|---|---|---|---|---|
| Landon | 1 | $111,910 | 102 | 4.86/5.0 |
| Jairo | 4 | $110,731 | 295 | 4.86/5.0 |
| Blair | 1 | $106,925 | 86 | 5.00/5.0 |
| Jen | 1 | $97,311 | 87 | 5.00/5.0 |
| Michael | 1 | $90,630 | 293 | 4.98/5.0 |
| Nicole | 1 | $85,125 | 100 | 5.00/5.0 |
| Jocelyn | 1 | $59,665 | 86 | 4.93/5.0 |
| Cindy | 1 | $57,106 | 169 | 4.99/5.0 |
| Stacey | 1 | $44,072 | 9 | 5.00/5.0 |
| Joe | 3 | $31,701 | 255 | 4.71/5.0 |
Analyzing the strategies of top hosts, such as their property selection, pricing, and guest communication, can offer valuable lessons for optimizing your own Airbnb operations in Knoxville.
Dive Deeper: Advanced Knoxville STR Market Data (2026)
Ready to unlock more insights? AirROI provides access to advanced metrics and comprehensive Airbnb data for Knoxville. Explore detailed analytics beyond this report to refine your investment strategy, optimize pricing, and maximize your vacation rental profits.
Explore Advanced MetricsKnoxville Short-Term Rental Market Composition (2026): Property & Room Types
Room Type Distribution
Property Type Distribution
Market Composition Insights for Knoxville
- The Knoxville Airbnb market composition is heavily skewed towards Entire Home/Apt listings, which make up 100% of the 21 active rentals. This indicates strong guest preference for privacy and space.
- Looking at the property type distribution in Knoxville, House properties are the most common (71.4%), reflecting the local real estate landscape.
- Houses represent a significant 71.4% portion, catering likely to families or larger groups.
Knoxville Airbnb Room Capacity Analysis (2026): Bedroom Distribution
Distribution of Listings by Number of Bedrooms
Room Capacity Insights for Knoxville
- The dominant room capacity in Knoxville is 3 bedrooms listings, making up 23.8% of the market. This suggests a strong demand for properties suitable for families or small groups.
- Together, 3 bedrooms and 4 bedrooms properties represent 42.8% of the active Airbnb listings in Knoxville, indicating a high concentration in these sizes.
- A significant 61.8% of listings offer 3+ bedrooms, catering to larger groups and families seeking more space in Knoxville.
Knoxville Vacation Rental Guest Capacity Trends (2026)
Distribution of Listings by Guest Capacity
Guest Capacity Insights for Knoxville
- The most common guest capacity trend in Knoxville vacation rentals is listings accommodating 8+ guests (57.1%). This suggests the primary traveler segment is likely larger groups.
- Properties designed for 8+ guests and 4 guests dominate the Knoxville STR market, accounting for 76.1% of listings.
- 66.6% of properties accommodate 6+ guests, serving the market segment for larger families or group travel in Knoxville.
- On average, properties in Knoxville are equipped to host 6.3 guests.
Knoxville Airbnb Booking Patterns (2026): Available vs. Booked Days
Available Days Distribution
Booked Days Distribution
Booking Pattern Insights for Knoxville
- The most common availability pattern in Knoxville falls within the 181-270 days range, representing 52.4% of listings. This suggests many properties have significant open periods on their calendars.
- Approximately 81.0% of listings show high availability (181+ days open annually), indicating potential for increased bookings or specific owner usage patterns.
- For booked days, the 91-180 days range is most frequent in Knoxville (57.1%), reflecting common guest stay durations or potential owner blocking patterns.
- A notable 19.1% of properties secure long booking periods (181+ days booked per year), highlighting successful long-term rental strategies or significant owner usage.
Knoxville Airbnb Minimum Stay Requirements Analysis
Distribution of Listings by Minimum Night Requirement
1 Night
4 listings
19% of total
2 Nights
11 listings
52.4% of total
30+ Nights
6 listings
28.6% of total
Key Insights
- The most prevalent minimum stay requirement in Knoxville is 2 Nights, adopted by 52.4% of listings. This highlights the market's preference for shorter, flexible bookings.
- A strong majority (71.4%) of the Knoxville Airbnb data shows acceptance of very short stays (1-2 nights), indicating a dynamic, high-turnover market.
- A significant segment (28.6%) caters to monthly stays (30+ nights) in Knoxville, pointing to opportunities in the extended-stay market.
Recommendations
- Align with the market by considering a 2 Nights minimum stay, as 52.4% of Knoxville hosts use this setting.
- If feasible, allowing 1-night stays, especially midweek or during low season, could capture last-minute bookings, as only 19% currently do.
- A 2-night minimum appears standard (52.4%). Consider this for weekends or peak periods.
- Explore offering discounts for stays of 30+ nights to attract the 28.6% of the market seeking extended stays.
- Adjust minimum nights based on seasonality – potentially shorter during low season and longer during peak demand periods in Knoxville.
Knoxville Airbnb Cancellation Policy Trends Analysis (2026)
Limited
3 listings
14.3% of total
Flexible
3 listings
14.3% of total
Moderate
9 listings
42.9% of total
Firm
5 listings
23.8% of total
Strict
1 listings
4.8% of total
Cancellation Policy Insights for Knoxville
- The prevailing Airbnb cancellation policy trend in Knoxville is Moderate, used by 42.9% of listings.
- There's a relatively balanced mix between guest-friendly (57.2%) and stricter (28.6%) policies, offering choices for different guest needs.
- Strict cancellation policies are quite rare (4.8%), potentially making listings with this policy less competitive unless justified by high demand or property type.
Recommendations for Hosts
- Consider adopting a Moderate policy to align with the 42.9% market standard in Knoxville.
- Using a Strict policy might deter some guests, as only 4.8% of listings use it. Evaluate if potential revenue protection outweighs possible lower booking rates.
- Regularly review your cancellation policy against competitors and market demand shifts in Knoxville.
Knoxville STR Booking Lead Time Analysis (2026)
Average Booking Lead Time by Month
Booking Lead Time Insights for Knoxville
- The overall average booking lead time for vacation rentals in Knoxville is 59 days.
- Guests book furthest in advance for stays during September (average 88 days), likely coinciding with peak travel demand or local events.
- The shortest booking windows occur for stays in January (average 34 days), indicating more last-minute travel plans during this time.
- Seasonally, Summer (74 days avg.) sees the longest lead times, while Winter (50 days avg.) has the shortest, reflecting typical travel planning cycles.
Recommendations for Hosts
- Use the overall average lead time (59 days) as a baseline for your pricing and availability strategy in Knoxville.
- For September stays, consider implementing length-of-stay discounts or slightly higher rates for bookings made less than 88 days out to capitalize on advance planning.
- Target marketing efforts for the Summer season well in advance (at least 74 days) to capture early planners.
- Monitor your own booking lead times against these Knoxville averages to identify opportunities for dynamic pricing adjustments.
Popular & Essential Airbnb Amenities in Knoxville (2026)
Amenity Prevalence
Amenity Insights for Knoxville
- Essential amenities in Knoxville that guests expect include: Dishes and silverware, Smoke alarm, Free parking on premises, Backyard, Coffee maker, Air conditioning, Heating, Refrigerator, Cooking basics, Essentials. Lacking these (any) could significantly impact bookings.
Recommendations for Hosts
- Ensure your listing includes all essential amenities for Knoxville: Dishes and silverware, Smoke alarm, Free parking on premises, Backyard, Coffee maker, Air conditioning, Heating, Refrigerator, Cooking basics, Essentials.
- Prioritize adding missing essentials: Cooking basics, Essentials.
- Highlight unique or less common amenities you offer (e.g., hot tub, dedicated workspace, EV charger) in your listing description and photos.
- Regularly check competitor amenities in Knoxville to stay competitive.
Knoxville Airbnb Guest Demographics & Profile Analysis (2026)
Guest Profile Summary for Knoxville
- The typical guest profile for Airbnb in Knoxville consists of primarily domestic travelers (87%), often arriving from nearby Washington, typically belonging to the Post-2000s (Gen Z/Alpha) group (50%), primarily speaking English or French.
- Domestic travelers account for 86.7% of guests.
- Key international markets include United States (86.7%) and DC (11.8%).
- Top languages spoken are English (66.3%) followed by French (10.5%).
- A significant demographic segment is the Post-2000s (Gen Z/Alpha) group, representing 50% of guests.
Recommendations for Hosts
- Target domestic marketing efforts towards travelers from Washington and Baltimore.
- Tailor amenities and listing descriptions to appeal to the dominant Post-2000s (Gen Z/Alpha) demographic (e.g., highlight fast WiFi, smart home features, local guides).
- Highlight unique local experiences or amenities relevant to the primary guest profile.
- Consider seasonal promotions aligned with peak travel times for key origin markets.
Nearby Short-Term Rental Market Comparison
How does the Knoxville Airbnb market stack up against its neighbors? Compare key performance metrics like average monthly revenue, ADR, and occupancy rates in surrounding areas to understand the broader regional STR landscape.
| Market | Active Properties | Monthly Revenue | Daily Rate | Avg. Occupancy |
|---|---|---|---|---|
| Polk Township | 15 | $6,974 | $520.26 | 38% |
| Lemont | 21 | $6,940 | $873.93 | 37% |
| College Township | 83 | $6,551 | $848.63 | 36% |
| Centreville | 17 | $6,298 | $565.66 | 45% |
| McGaheysville | 83 | $6,156 | $431.72 | 45% |
| State College | 192 | $6,081 | $712.29 | 40% |
| Mayo | 13 | $5,915 | $447.58 | 51% |
| Shannondale | 45 | $5,808 | $337.30 | 54% |
| Hellam Township | 24 | $5,496 | $386.69 | 45% |
| Stevensville | 80 | $5,412 | $556.79 | 41% |