Gaithersburg Airbnb Market Analysis 2026: Short Term Rental Data & Vacation Rental Statistics in Maryland, United States
Is Airbnb profitable in Gaithersburg in 2026? Explore comprehensive Airbnb analytics for Gaithersburg, Maryland, United States to uncover income potential. This 2026 STR market report for Gaithersburg, based on AirROI data from February 2025 to January 2026, reveals key trends in the niche market of 80 active listings.
Whether you're considering an Airbnb investment in Gaithersburg, optimizing your existing vacation rental, or exploring rental arbitrage opportunities, understanding the Gaithersburg Airbnb data is crucial. Leveraging the low regulation environment is key to maximizing your short term rental income potential. Let's dive into the specifics.
Key Gaithersburg Airbnb Performance Metrics Overview
Monthly Airbnb Revenue Variations & Income Potential in Gaithersburg (2026)
Understanding the monthly revenue variations for Airbnb listings in Gaithersburg is key to maximizing your short term rental income potential. Seasonality significantly impacts earnings. Our analysis, based on data from the past 12 months, shows that the peak revenue month for STRs in Gaithersburg is typically October, while January often presents the lowest earnings, highlighting opportunities for strategic pricing adjustments during shoulder and low seasons. Explore the typical Airbnb income in Gaithersburg across different performance tiers:
- Best-in-class properties (Top 10%) achieve $3,992+ monthly, often utilizing dynamic pricing and superior guest experiences.
- Strong performing properties (Top 25%) earn $2,120 or more, indicating effective management and desirable locations/amenities.
- Typical properties (Median) generate around $1,143 per month, representing the average market performance.
- Entry-level properties (Bottom 25%) see earnings around $509, often with potential for optimization.
Average Monthly Airbnb Earnings Trend in Gaithersburg
Gaithersburg Airbnb Occupancy Rate Trends (2026)
Maximize your bookings by understanding the Gaithersburg STR occupancy trends. Seasonal demand shifts significantly influence how often properties are booked. Typically, Aprilsees the highest demand (peak season occupancy), while January experiences the lowest (low season). Effective strategies, like adjusting minimum stays or offering promotions, can boost occupancy during slower periods. Here's how different property tiers perform in Gaithersburg:
- Best-in-class properties (Top 10%) achieve 87%+ occupancy, indicating high desirability and potentially optimized availability.
- Strong performing properties (Top 25%) maintain 72% or higher occupancy, suggesting good market fit and guest satisfaction.
- Typical properties (Median) have an occupancy rate around 43%.
- Entry-level properties (Bottom 25%) average 23% occupancy, potentially facing higher vacancy.
Average Monthly Occupancy Rate Trend in Gaithersburg
Average Daily Rate (ADR) Airbnb Trends in Gaithersburg (2026)
Effective short term rental pricing strategy in Gaithersburg involves understanding monthly ADR fluctuations. The Average Daily Rate (ADR) for Airbnb in Gaithersburg typically peaks in December and dips lowest during March. Leveraging Airbnb dynamic pricing tools or strategies based on this seasonality can significantly boost revenue. Here's a look at the typical nightly rates achieved:
- Best-in-class properties (Top 10%) command rates of $210+ per night, often due to premium features or locations.
- Strong performing properties (Top 25%) achieve nightly rates of $117 or more.
- Typical properties (Median) charge around $76 per night.
- Entry-level properties (Bottom 25%) earn around $48 per night.
Average Daily Rate (ADR) Trend by Month in Gaithersburg
Get Live Gaithersburg Market Intelligence 👇

Explore Real-time Analytics
Airbnb Seasonality Analysis & Trends in Gaithersburg (2026)
Peak Season (October, June, July)
- Revenue averages $1,949 per month
- Occupancy rates average 49.7%
- Daily rates average $104
Shoulder Season
- Revenue averages $1,659 per month
- Occupancy maintains around 50.5%
- Daily rates hold near $100
Low Season (January, February, December)
- Revenue drops to average $1,362 per month
- Occupancy decreases to average 38.2%
- Daily rates adjust to average $108
Seasonality Insights for Gaithersburg
- The Airbnb seasonality in Gaithersburg shows moderate seasonality with distinct peak and low periods. While the sections above show seasonal averages, it's also insightful to look at the extremes:
- During the high season, the absolute peak month showcases Gaithersburg's highest earning potential, with monthly revenues capable of climbing to $1,985, occupancy reaching a high of 57.6%, and ADRs peaking at $115.
- Conversely, the slowest single month of the year, typically falling within the low season, marks the market's lowest point. In this month, revenue might dip to $1,146, occupancy could drop to 31.8%, and ADRs may adjust down to $93.
- Understanding both the seasonal averages and these monthly peaks and troughs in revenue, occupancy, and ADR is crucial for maximizing your Airbnb profit potential in Gaithersburg.
Seasonal Strategies for Maximizing Profit
- Peak Season: Maximize revenue through premium pricing and potentially longer minimum stays. Ensure high availability.
- Low Season: Offer competitive pricing, special promotions (e.g., extended stay discounts), and flexible cancellation policies. Target off-season travelers like remote workers or budget-conscious guests.
- Shoulder Seasons: Implement dynamic pricing that balances peak and low rates. Target weekend travelers or specific events. Offer slightly more flexible terms than peak season.
- Regularly analyze your own performance against these Gaithersburg seasonality benchmarks and adjust your pricing and availability strategy accordingly.
Best Areas for Airbnb Investment in Gaithersburg (2026)
Exploring the top neighborhoods for short-term rentals in Gaithersburg? This section highlights key areas, outlining why they are attractive for hosts and guests, along with notable local attractions. Consider these locations based on your target guest profile and investment strategy.
| Neighborhood / Area | Why Host Here? (Target Guests & Appeal) | Key Attractions & Landmarks |
|---|---|---|
| Downtown Gaithersburg | The bustling heart of Gaithersburg with a variety of shops, restaurants, and cultural venues. Ideal for tourists looking for convenience and accessibility to local attractions. | Gaithersburg City Hall, Kentlands Market Square, The Gaithersburg Arts Barn, Lakeforest Mall, Washingtonian Center |
| Kentlands | A newly developed community designed to mimic traditional town-planning, with park-like settings and recreational opportunities. Attractive to families and those seeking a suburban feel with urban conveniences. | Kentlands Plaza, The Shops at Kentlands, Lake Kentlands, Gaithersburg Library, Kentlands Mansion |
| Old Towne | Historic district with charming architecture and a variety of restaurants and shops. Popular for its scenic views and local culture, attracting visitors interested in history and community. | Gaithersburg Historic District, Old Towne Plaza, Gaithersburg Community Museum, Crown Farm, Swan Point Park |
| Washingtonian Center | A shopping, dining, and entertainment destination that attracts both locals and tourists. Its proximity to water and green spaces makes it a desirable spot for short-term rentals. | Rio Washingtonian Center, The Water Fountain, Cinemark Theaters, Urban Bar-B-Que, Copper Canyon Grill |
| Lakeforest | Home to one of the largest shopping malls in the area, it offers various amenities and attractions that appeal to both families and visitors. | Lakeforest Mall, Walmart Supercenter, Montgomery County Agricultural Fairgrounds, Montgomery College - Germantown Campus, Sandy Spring Museum |
| Quince Orchard | Suburban area known for its excellent schools and family-friendly environments. Great for longer-stay rentals catering to families relocating to the area. | Quince Orchard Park, Ridgeview Park, Locust Grove Park, Shady Grove Hospital, Gaithersburg High School |
| Darnestown | Residential area offering a rural feel while being close to urban amenities. Attractive for those looking for a peaceful retreat near the city. | Darnestown Park, Simpson Park, Mason's Mill Park, Black Hill Regional Park, Lake Needwood |
| Montgomery Village | Family-oriented community featuring parks and recreational activities. Popular with visitors looking for a suburban stay while being close to the attractions of Gaithersburg. | Montgomery Village Golf Club, Lake Frank, Montgomery Village Center, The Church of Jesus Christ of Latter-day Saints, Northwest Golf Course |
Understanding Airbnb License Requirements & STR Laws in Gaithersburg (2026)
While Gaithersburg, Maryland, United States currently shows low STR regulations, specific Airbnb license requirements might still exist or change. Always verify the latest short term rental regulations and Airbnb license requirements directly with local government authorities for Gaithersburg to ensure full compliance before hosting.
(Source: AirROI data, 2026, finding no licensed listings among those analyzed)
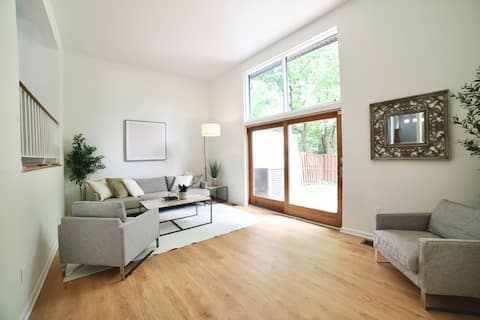
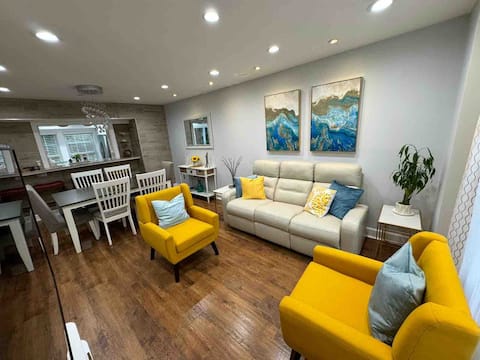
Top Performing Airbnb Properties in Gaithersburg (2026)
Benchmark your potential! Explore examples of top-performing Airbnb properties in Gaithersburgbased on Trailing Twelve Month (TTM) revenue. Analyze their characteristics, revenue, occupancy rate, and ADR to understand what drives success in this market.
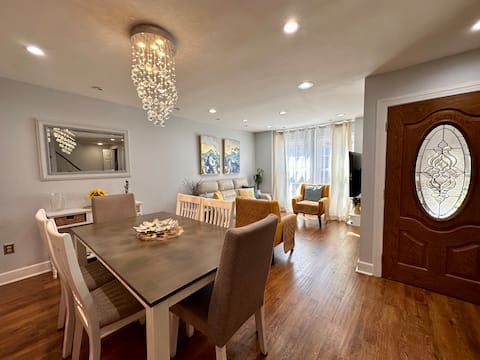
Cozy and Modern 5 Bedrooms 3 levels house 3.5 Bath
Entire Place • 5 bedrooms
Great location! Walk to Crown. Near rio, metro
Entire Place • 3 bedrooms

3LVL Townhome in Amazing Location
Entire Place • 3 bedrooms

Peaceful & Private Oasis Retreat
Entire Place • 6 bedrooms
Cozy and modern 3 bedrooms 2.5 Bath 2 levels
Entire Place • 3 bedrooms

Cozy Boho 3b3b | Playground
Entire Place • 3 bedrooms
Note: Performance varies based on location, size, amenities, seasonality, and management quality. Data reflects the past 12 months.
Top Performing Airbnb Hosts in Gaithersburg (2026)
Learn from the best! This table showcases top-performing Airbnb hosts in Gaithersburg based on the number of properties managed and estimated total revenue over the past year. Analyze their scale and performance metrics.
| Host Name | Properties | Grossing Revenue | Stay Reviews | Avg Rating |
|---|---|---|---|---|
| Luigi | 3 | $114,263 | 331 | 4.88/5.0 |
| Dp | 3 | $64,637 | 98 | 4.84/5.0 |
| My | 1 | $61,263 | 58 | 4.88/5.0 |
| Residence Inn Gaithersburg | 3 | $55,958 | 69 | 4.56/5.0 |
| Colleen | 1 | $46,065 | 59 | 4.97/5.0 |
| Adom | 1 | $42,535 | 16 | 4.63/5.0 |
| Titik | 2 | $37,837 | 15 | 4.85/5.0 |
| Mia | 2 | $35,674 | 12 | 5.00/5.0 |
| Ben | 1 | $32,596 | 37 | 4.62/5.0 |
| Jane | 1 | $29,195 | 46 | 4.83/5.0 |
Analyzing the strategies of top hosts, such as their property selection, pricing, and guest communication, can offer valuable lessons for optimizing your own Airbnb operations in Gaithersburg.
Dive Deeper: Advanced Gaithersburg STR Market Data (2026)
Ready to unlock more insights? AirROI provides access to advanced metrics and comprehensive Airbnb data for Gaithersburg. Explore detailed analytics beyond this report to refine your investment strategy, optimize pricing, and maximize your vacation rental profits.
Explore Advanced MetricsGaithersburg Short-Term Rental Market Composition (2026): Property & Room Types
Room Type Distribution
Property Type Distribution
Market Composition Insights for Gaithersburg
- The Gaithersburg Airbnb market composition is heavily skewed towards Private Room listings, which make up 60% of the 80 active rentals. This indicates strong guest preference for privacy and space.
- Looking at the property type distribution in Gaithersburg, House properties are the most common (63.7%), reflecting the local real estate landscape.
- Houses represent a significant 63.7% portion, catering likely to families or larger groups.
- The presence of 10% Hotel/Boutique listings indicates integration with traditional hospitality.
Gaithersburg Airbnb Room Capacity Analysis (2026): Bedroom Distribution
Distribution of Listings by Number of Bedrooms
Room Capacity Insights for Gaithersburg
- The dominant room capacity in Gaithersburg is 1 bedroom listings, making up 27.5% of the market. This suggests a strong demand for properties suitable for couples or solo travelers.
- Together, 1 bedroom and 3 bedrooms properties represent 38.8% of the active Airbnb listings in Gaithersburg, indicating a high concentration in these sizes.
- A significant 20.1% of listings offer 3+ bedrooms, catering to larger groups and families seeking more space in Gaithersburg.
Gaithersburg Vacation Rental Guest Capacity Trends (2026)
Distribution of Listings by Guest Capacity
Guest Capacity Insights for Gaithersburg
- The most common guest capacity trend in Gaithersburg vacation rentals is listings accommodating 4 guests (13.8%). This suggests the primary traveler segment is likely small families or groups.
- Properties designed for 4 guests and 8+ guests dominate the Gaithersburg STR market, accounting for 21.3% of listings.
- 15.0% of properties accommodate 6+ guests, serving the market segment for larger families or group travel in Gaithersburg.
- On average, properties in Gaithersburg are equipped to host 2.0 guests.
Gaithersburg Airbnb Booking Patterns (2026): Available vs. Booked Days
Available Days Distribution
Booked Days Distribution
Booking Pattern Insights for Gaithersburg
- The most common availability pattern in Gaithersburg falls within the 271-366 days range, representing 56.3% of listings. This suggests many properties have significant open periods on their calendars.
- Approximately 80.1% of listings show high availability (181+ days open annually), indicating potential for increased bookings or specific owner usage patterns.
- For booked days, the 31-90 days range is most frequent in Gaithersburg (27.5%), reflecting common guest stay durations or potential owner blocking patterns.
- A notable 22.6% of properties secure long booking periods (181+ days booked per year), highlighting successful long-term rental strategies or significant owner usage.
Gaithersburg Airbnb Minimum Stay Requirements Analysis
Distribution of Listings by Minimum Night Requirement
1 Night
13 listings
16.3% of total
2 Nights
13 listings
16.3% of total
3 Nights
5 listings
6.3% of total
4-6 Nights
9 listings
11.3% of total
7-29 Nights
18 listings
22.5% of total
30+ Nights
22 listings
27.5% of total
Key Insights
- The most prevalent minimum stay requirement in Gaithersburg is 30+ Nights, adopted by 27.5% of listings. This highlights the market's preference for longer commitments.
- A significant segment (27.5%) caters to monthly stays (30+ nights) in Gaithersburg, pointing to opportunities in the extended-stay market.
Recommendations
- Align with the market by considering a 30+ Nights minimum stay, as 27.5% of Gaithersburg hosts use this setting.
- If feasible, allowing 1-night stays, especially midweek or during low season, could capture last-minute bookings, as only 16.3% currently do.
- Explore offering discounts for stays of 30+ nights to attract the 27.5% of the market seeking extended stays.
- Adjust minimum nights based on seasonality – potentially shorter during low season and longer during peak demand periods in Gaithersburg.
Gaithersburg Airbnb Cancellation Policy Trends Analysis (2026)
Flexible
25 listings
31.3% of total
Moderate
21 listings
26.3% of total
Firm
24 listings
30% of total
Strict
10 listings
12.5% of total
Cancellation Policy Insights for Gaithersburg
- The prevailing Airbnb cancellation policy trend in Gaithersburg is Flexible, used by 31.3% of listings.
- There's a relatively balanced mix between guest-friendly (57.6%) and stricter (42.5%) policies, offering choices for different guest needs.
Recommendations for Hosts
- Consider adopting a Flexible policy to align with the 31.3% market standard in Gaithersburg.
- Using a Strict policy might deter some guests, as only 12.5% of listings use it. Evaluate if potential revenue protection outweighs possible lower booking rates.
- Regularly review your cancellation policy against competitors and market demand shifts in Gaithersburg.
Gaithersburg STR Booking Lead Time Analysis (2026)
Average Booking Lead Time by Month
Booking Lead Time Insights for Gaithersburg
- The overall average booking lead time for vacation rentals in Gaithersburg is 34 days.
- Guests book furthest in advance for stays during November (average 56 days), likely coinciding with peak travel demand or local events.
- The shortest booking windows occur for stays in February (average 22 days), indicating more last-minute travel plans during this time.
- Seasonally, Fall (42 days avg.) sees the longest lead times, while Winter (28 days avg.) has the shortest, reflecting typical travel planning cycles.
Recommendations for Hosts
- Use the overall average lead time (34 days) as a baseline for your pricing and availability strategy in Gaithersburg.
- For November stays, consider implementing length-of-stay discounts or slightly higher rates for bookings made less than 56 days out to capitalize on advance planning.
- Target marketing efforts for the Fall season well in advance (at least 42 days) to capture early planners.
- Monitor your own booking lead times against these Gaithersburg averages to identify opportunities for dynamic pricing adjustments.
Popular & Essential Airbnb Amenities in Gaithersburg (2026)
Amenity Prevalence
Amenity Insights for Gaithersburg
- Essential amenities in Gaithersburg that guests expect include: Wifi, Smoke alarm, Air conditioning. Lacking these (any) could significantly impact bookings.
- Popular amenities like Kitchen, Heating, Hot water are common but not universal. Offering these can provide a competitive edge.
Recommendations for Hosts
- Ensure your listing includes all essential amenities for Gaithersburg: Wifi, Smoke alarm, Air conditioning.
- Prioritize adding missing essentials: Smoke alarm, Air conditioning.
- Consider adding popular differentiators like Kitchen or Heating to increase appeal.
- Highlight unique or less common amenities you offer (e.g., hot tub, dedicated workspace, EV charger) in your listing description and photos.
- Regularly check competitor amenities in Gaithersburg to stay competitive.
Gaithersburg Airbnb Guest Demographics & Profile Analysis (2026)
Guest Profile Summary for Gaithersburg
- The typical guest profile for Airbnb in Gaithersburg consists of primarily domestic travelers (88%), often arriving from nearby Washington, typically belonging to the Post-2000s (Gen Z/Alpha) group (50%), primarily speaking English or Spanish.
- Domestic travelers account for 87.5% of guests.
- Key international markets include United States (87.5%) and DC (4%).
- Top languages spoken are English (59.1%) followed by Spanish (12.1%).
- A significant demographic segment is the Post-2000s (Gen Z/Alpha) group, representing 50% of guests.
Recommendations for Hosts
- Target domestic marketing efforts towards travelers from Washington and New York.
- Tailor amenities and listing descriptions to appeal to the dominant Post-2000s (Gen Z/Alpha) demographic (e.g., highlight fast WiFi, smart home features, local guides).
- Highlight unique local experiences or amenities relevant to the primary guest profile.
- Consider seasonal promotions aligned with peak travel times for key origin markets.
Nearby Short-Term Rental Market Comparison
How does the Gaithersburg Airbnb market stack up against its neighbors? Compare key performance metrics like average monthly revenue, ADR, and occupancy rates in surrounding areas to understand the broader regional STR landscape.
| Market | Active Properties | Monthly Revenue | Daily Rate | Avg. Occupancy |
|---|---|---|---|---|
| Polk Township | 15 | $6,974 | $520.26 | 38% |
| Lemont | 21 | $6,940 | $873.93 | 37% |
| College Township | 83 | $6,551 | $848.63 | 36% |
| Centreville | 17 | $6,298 | $565.66 | 45% |
| McGaheysville | 83 | $6,156 | $431.72 | 45% |
| State College | 192 | $6,081 | $712.29 | 40% |
| Mayo | 13 | $5,915 | $447.58 | 51% |
| Shannondale | 45 | $5,808 | $337.30 | 54% |
| Hellam Township | 24 | $5,496 | $386.69 | 45% |
| Stevensville | 80 | $5,412 | $556.79 | 41% |