Fairland Airbnb Market Analysis 2026: Short Term Rental Data & Vacation Rental Statistics in Maryland, United States
Is Airbnb profitable in Fairland in 2026? Explore comprehensive Airbnb analytics for Fairland, Maryland, United States to uncover income potential. This 2026 STR market report for Fairland, based on AirROI data from February 2025 to January 2026, reveals key trends in the niche market of 31 active listings.
Whether you're considering an Airbnb investment in Fairland, optimizing your existing vacation rental, or exploring rental arbitrage opportunities, understanding the Fairland Airbnb data is crucial. Leveraging the low regulation environment is key to maximizing your short term rental income potential. Let's dive into the specifics.
Key Fairland Airbnb Performance Metrics Overview
Monthly Airbnb Revenue Variations & Income Potential in Fairland (2026)
Understanding the monthly revenue variations for Airbnb listings in Fairland is key to maximizing your short term rental income potential. Seasonality significantly impacts earnings. Our analysis, based on data from the past 12 months, shows that the peak revenue month for STRs in Fairland is typically July, while September often presents the lowest earnings, highlighting opportunities for strategic pricing adjustments during shoulder and low seasons. Explore the typical Airbnb income in Fairland across different performance tiers:
- Best-in-class properties (Top 10%) achieve $4,331+ monthly, often utilizing dynamic pricing and superior guest experiences.
- Strong performing properties (Top 25%) earn $2,702 or more, indicating effective management and desirable locations/amenities.
- Typical properties (Median) generate around $1,177 per month, representing the average market performance.
- Entry-level properties (Bottom 25%) see earnings around $417, often with potential for optimization.
Average Monthly Airbnb Earnings Trend in Fairland
Fairland Airbnb Occupancy Rate Trends (2026)
Maximize your bookings by understanding the Fairland STR occupancy trends. Seasonal demand shifts significantly influence how often properties are booked. Typically, Julysees the highest demand (peak season occupancy), while November experiences the lowest (low season). Effective strategies, like adjusting minimum stays or offering promotions, can boost occupancy during slower periods. Here's how different property tiers perform in Fairland:
- Best-in-class properties (Top 10%) achieve 76%+ occupancy, indicating high desirability and potentially optimized availability.
- Strong performing properties (Top 25%) maintain 56% or higher occupancy, suggesting good market fit and guest satisfaction.
- Typical properties (Median) have an occupancy rate around 36%.
- Entry-level properties (Bottom 25%) average 19% occupancy, potentially facing higher vacancy.
Average Monthly Occupancy Rate Trend in Fairland
Average Daily Rate (ADR) Airbnb Trends in Fairland (2026)
Effective short term rental pricing strategy in Fairland involves understanding monthly ADR fluctuations. The Average Daily Rate (ADR) for Airbnb in Fairland typically peaks in December and dips lowest during February. Leveraging Airbnb dynamic pricing tools or strategies based on this seasonality can significantly boost revenue. Here's a look at the typical nightly rates achieved:
- Best-in-class properties (Top 10%) command rates of $308+ per night, often due to premium features or locations.
- Strong performing properties (Top 25%) achieve nightly rates of $151 or more.
- Typical properties (Median) charge around $72 per night.
- Entry-level properties (Bottom 25%) earn around $51 per night.
Average Daily Rate (ADR) Trend by Month in Fairland
Get Live Fairland Market Intelligence 👇

Explore Real-time Analytics
Airbnb Seasonality Analysis & Trends in Fairland (2026)
Peak Season (July, October, June)
- Revenue averages $2,567 per month
- Occupancy rates average 48.0%
- Daily rates average $138
Shoulder Season
- Revenue averages $1,705 per month
- Occupancy maintains around 39.5%
- Daily rates hold near $136
Low Season (January, February, September)
- Revenue drops to average $1,202 per month
- Occupancy decreases to average 32.7%
- Daily rates adjust to average $136
Seasonality Insights for Fairland
- The Airbnb seasonality in Fairland shows highly seasonal trends requiring careful strategy. While the sections above show seasonal averages, it's also insightful to look at the extremes:
- During the high season, the absolute peak month showcases Fairland's highest earning potential, with monthly revenues capable of climbing to $3,036, occupancy reaching a high of 51.2%, and ADRs peaking at $151.
- Conversely, the slowest single month of the year, typically falling within the low season, marks the market's lowest point. In this month, revenue might dip to $1,107, occupancy could drop to 29.6%, and ADRs may adjust down to $121.
- Understanding both the seasonal averages and these monthly peaks and troughs in revenue, occupancy, and ADR is crucial for maximizing your Airbnb profit potential in Fairland.
Seasonal Strategies for Maximizing Profit
- Peak Season: Maximize revenue through premium pricing and potentially longer minimum stays. Ensure high availability.
- Low Season: Offer competitive pricing, special promotions (e.g., extended stay discounts), and flexible cancellation policies. Target off-season travelers like remote workers or budget-conscious guests.
- Shoulder Seasons: Implement dynamic pricing that balances peak and low rates. Target weekend travelers or specific events. Offer slightly more flexible terms than peak season.
- Regularly analyze your own performance against these Fairland seasonality benchmarks and adjust your pricing and availability strategy accordingly.
Best Areas for Airbnb Investment in Fairland (2026)
Exploring the top neighborhoods for short-term rentals in Fairland? This section highlights key areas, outlining why they are attractive for hosts and guests, along with notable local attractions. Consider these locations based on your target guest profile and investment strategy.
| Neighborhood / Area | Why Host Here? (Target Guests & Appeal) | Key Attractions & Landmarks |
|---|---|---|
| Downtown Silver Spring | Vibrant urban area with a mix of residential and commercial spaces. Close to public transportation and popular dining and entertainment spots, making it a great choice for both tourists and business travelers. | Silver Spring Civic Center, AFI Silver Theatre, Ellsworth Place, Piney Branch Stream Valley Park, Downtown Farmers Market |
| Takoma Park | Charming and historic neighborhood known for its community vibe and eclectic shops. Attractive to visitors looking for a laid-back atmosphere with easy access to nature and cultural events. | Takoma Park Farmers Market, Piney Branch Park, Historic Takoma, Takoma Park Community Center, Kemp Mill Park |
| Colesville | Residential area that is peaceful yet close to attractions. Suitable for families and those attending events in surrounding areas, offering a suburban feel. | Colesville Library, Woodmoor Shopping Center, Rock Creek Park, Beltway Plaza, Sligo Creek Park |
| University Park | Home to the University of Maryland, this area attracts students and visitors year-round for various events and activities, making it an excellent spot for Airbnb hosting. | University of Maryland, Hyattsville Arts District, Lake Artemesia, The Clarice Smith Performing Arts Center, Greenbelt Park |
| Langley Park | Diverse community offering a multicultural experience. Great for hosting international travelers looking for a taste of different cultures and cuisines. | Prince George's Plaza, Langley Park Shopping Center, Greenbelt Metro Station, Sligo Creek Parkway, Lake Artemesia Natural Area |
| North Silver Spring | A quieter, residential alternative with parks and local shopping. Attracts families and those seeking a peaceful getaway while still being close to urban activities. | Brookside Gardens, White Oak Shopping Center, Forest Glen Park, Northwest Branch Trail, Sligo Creek Park |
| Sligo Park | Natural beauty with ample trails for outdoor enthusiasts, this area is perfect for those looking to host guests who enjoy hiking and nature. | Sligo Creek Park, Hiking Trails, Biking Routes, Nature Centers, Picnic Areas |
| Four Corners | A suburban community with a mix of residential and commercial areas. Suitable for families and business travelers alike, with access to necessary amenities. | Four Corners Shopping Center, Montgomery County Public Libraries, Local Parks, Restaurants, Close to Public Transport |
Understanding Airbnb License Requirements & STR Laws in Fairland (2026)
While Fairland, Maryland, United States currently shows low STR regulations, specific Airbnb license requirements might still exist or change. Always verify the latest short term rental regulations and Airbnb license requirements directly with local government authorities for Fairland to ensure full compliance before hosting.
(Source: AirROI data, 2026, finding no licensed listings among those analyzed)
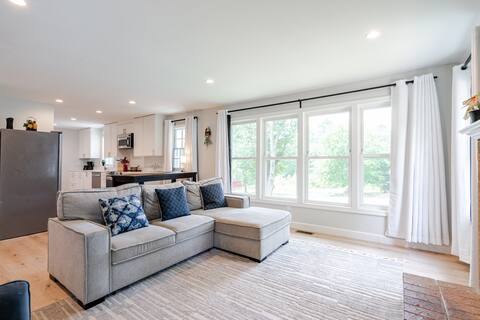
Top Performing Airbnb Properties in Fairland (2026)
Benchmark your potential! Explore examples of top-performing Airbnb properties in Fairlandbased on Trailing Twelve Month (TTM) revenue. Analyze their characteristics, revenue, occupancy rate, and ADR to understand what drives success in this market.
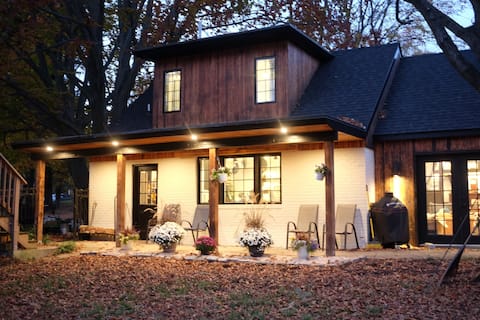
cottage in a meadow - 7 acre urban oasis
Entire Place • 2 bedrooms

Your Silver Spring Escape
Entire Place • 3 bedrooms
Serenity: Lush 2BR Gem, on 1 acre Silver Spring
Entire Place • 2 bedrooms

Silver Spring Serene 2BR/2BA, Nature And Access
Entire Place • 2 bedrooms

8 or 12 Bedrooms large Home w Movie Theater & Gym!
Entire Place • 12 bedrooms

Private guest suite in a newly remodeled home
Entire Place • 1 bedroom
Note: Performance varies based on location, size, amenities, seasonality, and management quality. Data reflects the past 12 months.
Top Performing Airbnb Hosts in Fairland (2026)
Learn from the best! This table showcases top-performing Airbnb hosts in Fairland based on the number of properties managed and estimated total revenue over the past year. Analyze their scale and performance metrics.
| Host Name | Properties | Grossing Revenue | Stay Reviews | Avg Rating |
|---|---|---|---|---|
| Roger | 4 | $111,857 | 187 | 4.56/5.0 |
| Kyle | 1 | $58,942 | 148 | 4.98/5.0 |
| Timm | 1 | $42,818 | 58 | 4.88/5.0 |
| Wande | 1 | $31,339 | 44 | 4.48/5.0 |
| Jessica | 5 | $28,824 | 174 | 4.97/5.0 |
| Edward | 1 | $26,702 | 282 | 4.92/5.0 |
| Hassan | 6 | $21,995 | 41 | 4.85/5.0 |
| Abaad | 1 | $18,541 | 253 | 4.94/5.0 |
| Hilina | 1 | $17,267 | 47 | 4.36/5.0 |
| Ana Maria | 5 | $17,006 | 230 | 4.94/5.0 |
Analyzing the strategies of top hosts, such as their property selection, pricing, and guest communication, can offer valuable lessons for optimizing your own Airbnb operations in Fairland.
Dive Deeper: Advanced Fairland STR Market Data (2026)
Ready to unlock more insights? AirROI provides access to advanced metrics and comprehensive Airbnb data for Fairland. Explore detailed analytics beyond this report to refine your investment strategy, optimize pricing, and maximize your vacation rental profits.
Explore Advanced MetricsFairland Short-Term Rental Market Composition (2026): Property & Room Types
Room Type Distribution
Property Type Distribution
Market Composition Insights for Fairland
- The Fairland Airbnb market composition is heavily skewed towards Entire Home/Apt listings, which make up 54.8% of the 31 active rentals. This indicates strong guest preference for privacy and space.
- However, a notable 45.2% share for Private Rooms suggests opportunities for budget-conscious travelers or hosts renting out spare rooms.
- Looking at the property type distribution in Fairland, House properties are the most common (74.2%), reflecting the local real estate landscape.
- Houses represent a significant 74.2% portion, catering likely to families or larger groups.
Fairland Airbnb Room Capacity Analysis (2026): Bedroom Distribution
Distribution of Listings by Number of Bedrooms
Room Capacity Insights for Fairland
- The dominant room capacity in Fairland is 2 bedrooms listings, making up 25.8% of the market. This suggests a strong demand for properties suitable for couples or solo travelers.
- Together, 2 bedrooms and 5+ bedrooms properties represent 35.5% of the active Airbnb listings in Fairland, indicating a high concentration in these sizes.
- A significant 22.7% of listings offer 3+ bedrooms, catering to larger groups and families seeking more space in Fairland.
Fairland Vacation Rental Guest Capacity Trends (2026)
Distribution of Listings by Guest Capacity
Guest Capacity Insights for Fairland
- The most common guest capacity trend in Fairland vacation rentals is listings accommodating 8+ guests (16.1%). This suggests the primary traveler segment is likely larger groups.
- Properties designed for 8+ guests and 6 guests dominate the Fairland STR market, accounting for 29.0% of listings.
- 29.0% of properties accommodate 6+ guests, serving the market segment for larger families or group travel in Fairland.
- On average, properties in Fairland are equipped to host 3.1 guests.
Fairland Airbnb Booking Patterns (2026): Available vs. Booked Days
Available Days Distribution
Booked Days Distribution
Booking Pattern Insights for Fairland
- The most common availability pattern in Fairland falls within the 271-366 days range, representing 64.5% of listings. This suggests many properties have significant open periods on their calendars.
- Approximately 83.9% of listings show high availability (181+ days open annually), indicating potential for increased bookings or specific owner usage patterns.
- For booked days, the 31-90 days range is most frequent in Fairland (45.2%), reflecting common guest stay durations or potential owner blocking patterns.
- A notable 16.1% of properties secure long booking periods (181+ days booked per year), highlighting successful long-term rental strategies or significant owner usage.
Fairland Airbnb Minimum Stay Requirements Analysis
Distribution of Listings by Minimum Night Requirement
1 Night
6 listings
19.4% of total
2 Nights
5 listings
16.1% of total
3 Nights
4 listings
12.9% of total
4-6 Nights
3 listings
9.7% of total
7-29 Nights
1 listings
3.2% of total
30+ Nights
12 listings
38.7% of total
Key Insights
- The most prevalent minimum stay requirement in Fairland is 30+ Nights, adopted by 38.7% of listings. This highlights the market's preference for longer commitments.
- A significant segment (38.7%) caters to monthly stays (30+ nights) in Fairland, pointing to opportunities in the extended-stay market.
Recommendations
- Align with the market by considering a 30+ Nights minimum stay, as 38.7% of Fairland hosts use this setting.
- If feasible, allowing 1-night stays, especially midweek or during low season, could capture last-minute bookings, as only 19.4% currently do.
- Explore offering discounts for stays of 30+ nights to attract the 38.7% of the market seeking extended stays.
- Adjust minimum nights based on seasonality – potentially shorter during low season and longer during peak demand periods in Fairland.
Fairland Airbnb Cancellation Policy Trends Analysis (2026)
Flexible
4 listings
12.9% of total
Moderate
5 listings
16.1% of total
Firm
20 listings
64.5% of total
Strict
2 listings
6.5% of total
Cancellation Policy Insights for Fairland
- The prevailing Airbnb cancellation policy trend in Fairland is Firm, used by 64.5% of listings.
- A majority (71.0%) of hosts in Fairland utilize Firm or Strict policies, indicating a market where hosts prioritize booking security.
- Strict cancellation policies are quite rare (6.5%), potentially making listings with this policy less competitive unless justified by high demand or property type.
Recommendations for Hosts
- Consider adopting a Firm policy to align with the 64.5% market standard in Fairland.
- Using a Strict policy might deter some guests, as only 6.5% of listings use it. Evaluate if potential revenue protection outweighs possible lower booking rates.
- Regularly review your cancellation policy against competitors and market demand shifts in Fairland.
Fairland STR Booking Lead Time Analysis (2026)
Average Booking Lead Time by Month
Booking Lead Time Insights for Fairland
- The overall average booking lead time for vacation rentals in Fairland is 22 days.
- Guests book furthest in advance for stays during May (average 40 days), likely coinciding with peak travel demand or local events.
- The shortest booking windows occur for stays in December (average 10 days), indicating more last-minute travel plans during this time.
- Seasonally, Spring (29 days avg.) sees the longest lead times, while Winter (13 days avg.) has the shortest, reflecting typical travel planning cycles.
Recommendations for Hosts
- Use the overall average lead time (22 days) as a baseline for your pricing and availability strategy in Fairland.
- For May stays, consider implementing length-of-stay discounts or slightly higher rates for bookings made less than 40 days out to capitalize on advance planning.
- During December, focus on last-minute booking availability and promotions, as guests book with very short notice (10 days avg.).
- Target marketing efforts for the Spring season well in advance (at least 29 days) to capture early planners.
- Monitor your own booking lead times against these Fairland averages to identify opportunities for dynamic pricing adjustments.
Popular & Essential Airbnb Amenities in Fairland (2026)
Amenity Prevalence
Amenity Insights for Fairland
- Essential amenities in Fairland that guests expect include: Free parking on premises, Wifi, Air conditioning, TV, Hot water, Heating. Lacking these (any) could significantly impact bookings.
- Popular amenities like Smoke alarm, Kitchen, Washer are common but not universal. Offering these can provide a competitive edge.
Recommendations for Hosts
- Ensure your listing includes all essential amenities for Fairland: Free parking on premises, Wifi, Air conditioning, TV, Hot water, Heating.
- Prioritize adding missing essentials: TV, Hot water, Heating.
- Consider adding popular differentiators like Smoke alarm or Kitchen to increase appeal.
- Highlight unique or less common amenities you offer (e.g., hot tub, dedicated workspace, EV charger) in your listing description and photos.
- Regularly check competitor amenities in Fairland to stay competitive.
Fairland Airbnb Guest Demographics & Profile Analysis (2026)
Guest Profile Summary for Fairland
- The typical guest profile for Airbnb in Fairland consists of primarily domestic travelers (92%), often arriving from nearby Allentown, typically belonging to the Post-2000s (Gen Z/Alpha) group (50%), primarily speaking English or Spanish.
- Domestic travelers account for 92.3% of guests.
- Key international markets include United States (92.3%) and Canada (2.8%).
- Top languages spoken are English (61.4%) followed by Spanish (18.9%).
- A significant demographic segment is the Post-2000s (Gen Z/Alpha) group, representing 50% of guests.
Recommendations for Hosts
- Target domestic marketing efforts towards travelers from Allentown and New York.
- Tailor amenities and listing descriptions to appeal to the dominant Post-2000s (Gen Z/Alpha) demographic (e.g., highlight fast WiFi, smart home features, local guides).
- Highlight unique local experiences or amenities relevant to the primary guest profile.
- Consider seasonal promotions aligned with peak travel times for key origin markets.
Nearby Short-Term Rental Market Comparison
How does the Fairland Airbnb market stack up against its neighbors? Compare key performance metrics like average monthly revenue, ADR, and occupancy rates in surrounding areas to understand the broader regional STR landscape.
| Market | Active Properties | Monthly Revenue | Daily Rate | Avg. Occupancy |
|---|---|---|---|---|
| Polk Township | 15 | $6,974 | $520.26 | 38% |
| Lemont | 21 | $6,940 | $873.93 | 37% |
| College Township | 83 | $6,551 | $848.63 | 36% |
| Centreville | 17 | $6,298 | $565.66 | 45% |
| State College | 192 | $6,081 | $712.29 | 40% |
| Mayo | 13 | $5,915 | $447.58 | 51% |
| Shannondale | 45 | $5,808 | $337.30 | 54% |
| Hilltown Township | 11 | $5,557 | $578.96 | 40% |
| Hellam Township | 24 | $5,496 | $386.69 | 45% |
| Stevensville | 80 | $5,412 | $556.79 | 41% |