Colesville Airbnb Market Analysis 2026: Short Term Rental Data & Vacation Rental Statistics in Maryland, United States
Is Airbnb profitable in Colesville in 2026? Explore comprehensive Airbnb analytics for Colesville, Maryland, United States to uncover income potential. This 2026 STR market report for Colesville, based on AirROI data from February 2025 to January 2026, reveals key trends in the niche market of 46 active listings.
Whether you're considering an Airbnb investment in Colesville, optimizing your existing vacation rental, or exploring rental arbitrage opportunities, understanding the Colesville Airbnb data is crucial. Leveraging the low regulation environment is key to maximizing your short term rental income potential. Let's dive into the specifics.
Key Colesville Airbnb Performance Metrics Overview
Monthly Airbnb Revenue Variations & Income Potential in Colesville (2026)
Understanding the monthly revenue variations for Airbnb listings in Colesville is key to maximizing your short term rental income potential. Seasonality significantly impacts earnings. Our analysis, based on data from the past 12 months, shows that the peak revenue month for STRs in Colesville is typically July, while February often presents the lowest earnings, highlighting opportunities for strategic pricing adjustments during shoulder and low seasons. Explore the typical Airbnb income in Colesville across different performance tiers:
- Best-in-class properties (Top 10%) achieve $7,124+ monthly, often utilizing dynamic pricing and superior guest experiences.
- Strong performing properties (Top 25%) earn $3,194 or more, indicating effective management and desirable locations/amenities.
- Typical properties (Median) generate around $1,326 per month, representing the average market performance.
- Entry-level properties (Bottom 25%) see earnings around $590, often with potential for optimization.
Average Monthly Airbnb Earnings Trend in Colesville
Colesville Airbnb Occupancy Rate Trends (2026)
Maximize your bookings by understanding the Colesville STR occupancy trends. Seasonal demand shifts significantly influence how often properties are booked. Typically, Julysees the highest demand (peak season occupancy), while January experiences the lowest (low season). Effective strategies, like adjusting minimum stays or offering promotions, can boost occupancy during slower periods. Here's how different property tiers perform in Colesville:
- Best-in-class properties (Top 10%) achieve 75%+ occupancy, indicating high desirability and potentially optimized availability.
- Strong performing properties (Top 25%) maintain 55% or higher occupancy, suggesting good market fit and guest satisfaction.
- Typical properties (Median) have an occupancy rate around 36%.
- Entry-level properties (Bottom 25%) average 18% occupancy, potentially facing higher vacancy.
Average Monthly Occupancy Rate Trend in Colesville
Average Daily Rate (ADR) Airbnb Trends in Colesville (2026)
Effective short term rental pricing strategy in Colesville involves understanding monthly ADR fluctuations. The Average Daily Rate (ADR) for Airbnb in Colesville typically peaks in October and dips lowest during February. Leveraging Airbnb dynamic pricing tools or strategies based on this seasonality can significantly boost revenue. Here's a look at the typical nightly rates achieved:
- Best-in-class properties (Top 10%) command rates of $289+ per night, often due to premium features or locations.
- Strong performing properties (Top 25%) achieve nightly rates of $161 or more.
- Typical properties (Median) charge around $88 per night.
- Entry-level properties (Bottom 25%) earn around $52 per night.
Average Daily Rate (ADR) Trend by Month in Colesville
Get Live Colesville Market Intelligence 👇

Explore Real-time Analytics
Airbnb Seasonality Analysis & Trends in Colesville (2026)
Peak Season (July, December, October)
- Revenue averages $3,040 per month
- Occupancy rates average 40.4%
- Daily rates average $144
Shoulder Season
- Revenue averages $2,486 per month
- Occupancy maintains around 42.0%
- Daily rates hold near $132
Low Season (January, February, November)
- Revenue drops to average $1,787 per month
- Occupancy decreases to average 31.9%
- Daily rates adjust to average $138
Seasonality Insights for Colesville
- The Airbnb seasonality in Colesville shows highly seasonal trends requiring careful strategy. While the sections above show seasonal averages, it's also insightful to look at the extremes:
- During the high season, the absolute peak month showcases Colesville's highest earning potential, with monthly revenues capable of climbing to $3,133, occupancy reaching a high of 51.0%, and ADRs peaking at $150.
- Conversely, the slowest single month of the year, typically falling within the low season, marks the market's lowest point. In this month, revenue might dip to $1,395, occupancy could drop to 22.0%, and ADRs may adjust down to $119.
- Understanding both the seasonal averages and these monthly peaks and troughs in revenue, occupancy, and ADR is crucial for maximizing your Airbnb profit potential in Colesville.
Seasonal Strategies for Maximizing Profit
- Peak Season: Maximize revenue through premium pricing and potentially longer minimum stays. Ensure high availability.
- Low Season: Offer competitive pricing, special promotions (e.g., extended stay discounts), and flexible cancellation policies. Target off-season travelers like remote workers or budget-conscious guests.
- Shoulder Seasons: Implement dynamic pricing that balances peak and low rates. Target weekend travelers or specific events. Offer slightly more flexible terms than peak season.
- Regularly analyze your own performance against these Colesville seasonality benchmarks and adjust your pricing and availability strategy accordingly.
Best Areas for Airbnb Investment in Colesville (2026)
Exploring the top neighborhoods for short-term rentals in Colesville? This section highlights key areas, outlining why they are attractive for hosts and guests, along with notable local attractions. Consider these locations based on your target guest profile and investment strategy.
| Neighborhood / Area | Why Host Here? (Target Guests & Appeal) | Key Attractions & Landmarks |
|---|---|---|
| Colesville Village | A quaint suburban area that offers peaceful living with convenience to shops and dining options. Attracts families and travelers seeking a relaxing stay while being close to urban amenities. | Colesville Park, Four Corners Main Street, Local coffee shops, Biking trails, Nearby parks |
| White Oak | A vibrant neighborhood known for its diverse community and accessibility to public transportation. Popular among visitors who want to explore the greater Silver Spring area easily. | White Oak Shopping Center, White Oak Recreation Center, Nearby parks, Public libraries, Restaurants |
| Northwood | A charming residential area featuring a mix of older homes and modern amenities. Ideal for visitors looking for a quiet retreat with quick access to city attractions. | Northwood Park, Public art installations, Local eateries, Community events, Nearby schools |
| Beltway Plaza | A bustling area with shopping and entertainment options, making it a great place for Airbnb hosting. Attracts visitors looking for convenience and a lively atmosphere. | Beltway Plaza Mall, Movie theaters, Restaurants, Fitness centers, Community events |
| Fallsgrove | An upscale community offering luxury living and a serene environment. Appeals to affluent travelers looking for a high-end rental experience. | Fallsgrove Village Center, Upscale dining options, Wellness centers, Parks, Proximity to major highways |
| Hillandale | A suburban area that provides a tranquil environment for vacationers. Great for families and groups seeking comfort away from the hustle of the city. | Hillandale Park, Grocery stores, Community centers, Walking trails, Basketball courts |
| Kemp Mill | A family-friendly neighborhood known for its close-knit community and local amenities. Perfect for Airbnb guests looking for a homely environment. | Kemp Mill Park, Local shops, Community activities, Nearby schools, Local eateries |
| Montgomery Blair High School area | A vibrant area known for its community involvement and wide array of recreational facilities. Attracts both families and young visitors interested in cultural experiences. | Montgomery Blair High School, Nearby parks, Cultural centers, Shopping areas, Community events |
Understanding Airbnb License Requirements & STR Laws in Colesville (2026)
While Colesville, Maryland, United States currently shows low STR regulations, specific Airbnb license requirements might still exist or change. Always verify the latest short term rental regulations and Airbnb license requirements directly with local government authorities for Colesville to ensure full compliance before hosting.
(Source: AirROI data, 2026, finding no licensed listings among those analyzed)
Top Performing Airbnb Properties in Colesville (2026)
Benchmark your potential! Explore examples of top-performing Airbnb properties in Colesvillebased on Trailing Twelve Month (TTM) revenue. Analyze their characteristics, revenue, occupancy rate, and ADR to understand what drives success in this market.
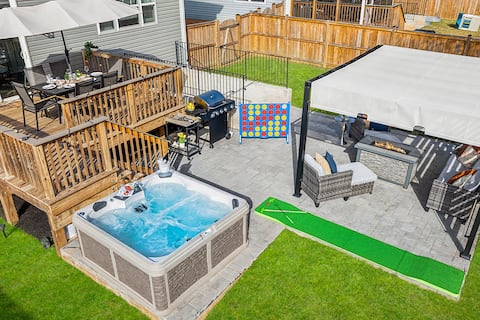
Modern 3-Level Stay| Hot Tub | Game Room | Parking
Entire Place • 5 bedrooms

Family Retreat, Fire Pit+ BBQ+ games + amenities.
Entire Place • 5 bedrooms

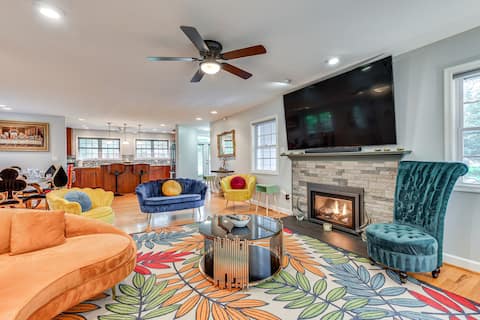
Lux Family Xcape with HotTub, Fireplace, Deck, BBQ
Entire Place • 5 bedrooms
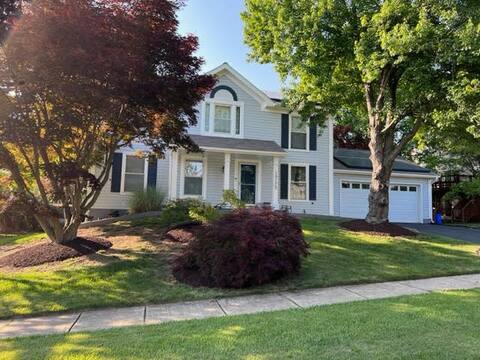
Upgraded, beautiful 4 BD Colonial in Silver Spring
Entire Place • 4 bedrooms
14 Mi to DC: Retreat w/ Patio & Sunroom!
Entire Place • 3 bedrooms

Beautiful Family Getaway 5bds/3ba
Entire Place • 5 bedrooms
Note: Performance varies based on location, size, amenities, seasonality, and management quality. Data reflects the past 12 months.
Top Performing Airbnb Hosts in Colesville (2026)
Learn from the best! This table showcases top-performing Airbnb hosts in Colesville based on the number of properties managed and estimated total revenue over the past year. Analyze their scale and performance metrics.
| Host Name | Properties | Grossing Revenue | Stay Reviews | Avg Rating |
|---|---|---|---|---|
| Melissa | 2 | $179,127 | 222 | 4.96/5.0 |
| Eric | 1 | $111,167 | 278 | 4.99/5.0 |
| Aleme | 2 | $53,195 | 28 | 4.79/5.0 |
| Evolve | 2 | $49,305 | 10 | 4.33/5.0 |
| David | 1 | $47,854 | 62 | 4.89/5.0 |
| Etsegenet | 1 | $34,083 | 17 | 4.53/5.0 |
| Hassan | 10 | $31,114 | 76 | 4.66/5.0 |
| Aberash | 2 | $31,088 | 26 | 4.88/5.0 |
| Kristi | 1 | $28,863 | 98 | 4.96/5.0 |
| Natalie | 2 | $26,257 | 545 | 4.87/5.0 |
Analyzing the strategies of top hosts, such as their property selection, pricing, and guest communication, can offer valuable lessons for optimizing your own Airbnb operations in Colesville.
Dive Deeper: Advanced Colesville STR Market Data (2026)
Ready to unlock more insights? AirROI provides access to advanced metrics and comprehensive Airbnb data for Colesville. Explore detailed analytics beyond this report to refine your investment strategy, optimize pricing, and maximize your vacation rental profits.
Explore Advanced MetricsColesville Short-Term Rental Market Composition (2026): Property & Room Types
Room Type Distribution
Property Type Distribution
Market Composition Insights for Colesville
- The Colesville Airbnb market composition is heavily skewed towards Entire Home/Apt listings, which make up 63% of the 46 active rentals. This indicates strong guest preference for privacy and space.
- However, a notable 37% share for Private Rooms suggests opportunities for budget-conscious travelers or hosts renting out spare rooms.
- Looking at the property type distribution in Colesville, House properties are the most common (82.6%), reflecting the local real estate landscape.
- Houses represent a significant 82.6% portion, catering likely to families or larger groups.
- Smaller segments like apartment/condo (combined 2.2%) offer potential for unique stay experiences.
Colesville Airbnb Room Capacity Analysis (2026): Bedroom Distribution
Distribution of Listings by Number of Bedrooms
Room Capacity Insights for Colesville
- The dominant room capacity in Colesville is 1 bedroom listings, making up 21.7% of the market. This suggests a strong demand for properties suitable for couples or solo travelers.
- Together, 1 bedroom and 5+ bedrooms properties represent 34.7% of the active Airbnb listings in Colesville, indicating a high concentration in these sizes.
- A significant 30.4% of listings offer 3+ bedrooms, catering to larger groups and families seeking more space in Colesville.
Colesville Vacation Rental Guest Capacity Trends (2026)
Distribution of Listings by Guest Capacity
Guest Capacity Insights for Colesville
- The most common guest capacity trend in Colesville vacation rentals is listings accommodating 8+ guests (15.2%). This suggests the primary traveler segment is likely larger groups.
- Properties designed for 8+ guests and 2 guests dominate the Colesville STR market, accounting for 28.2% of listings.
- 28.2% of properties accommodate 6+ guests, serving the market segment for larger families or group travel in Colesville.
- On average, properties in Colesville are equipped to host 2.9 guests.
Colesville Airbnb Booking Patterns (2026): Available vs. Booked Days
Available Days Distribution
Booked Days Distribution
Booking Pattern Insights for Colesville
- The most common availability pattern in Colesville falls within the 271-366 days range, representing 58.7% of listings. This suggests many properties have significant open periods on their calendars.
- Approximately 89.1% of listings show high availability (181+ days open annually), indicating potential for increased bookings or specific owner usage patterns.
- For booked days, the 1-30 days range is most frequent in Colesville (32.6%), reflecting common guest stay durations or potential owner blocking patterns.
- A notable 10.9% of properties secure long booking periods (181+ days booked per year), highlighting successful long-term rental strategies or significant owner usage.
Colesville Airbnb Minimum Stay Requirements Analysis
Distribution of Listings by Minimum Night Requirement
1 Night
7 listings
15.2% of total
2 Nights
9 listings
19.6% of total
3 Nights
6 listings
13% of total
4-6 Nights
5 listings
10.9% of total
7-29 Nights
4 listings
8.7% of total
30+ Nights
15 listings
32.6% of total
Key Insights
- The most prevalent minimum stay requirement in Colesville is 30+ Nights, adopted by 32.6% of listings. This highlights the market's preference for longer commitments.
- A significant segment (32.6%) caters to monthly stays (30+ nights) in Colesville, pointing to opportunities in the extended-stay market.
Recommendations
- Align with the market by considering a 30+ Nights minimum stay, as 32.6% of Colesville hosts use this setting.
- If feasible, allowing 1-night stays, especially midweek or during low season, could capture last-minute bookings, as only 15.2% currently do.
- Explore offering discounts for stays of 30+ nights to attract the 32.6% of the market seeking extended stays.
- Adjust minimum nights based on seasonality – potentially shorter during low season and longer during peak demand periods in Colesville.
Colesville Airbnb Cancellation Policy Trends Analysis (2026)
Flexible
15 listings
32.6% of total
Moderate
18 listings
39.1% of total
Firm
8 listings
17.4% of total
Strict
5 listings
10.9% of total
Cancellation Policy Insights for Colesville
- The prevailing Airbnb cancellation policy trend in Colesville is Moderate, used by 39.1% of listings.
- The market strongly favors guest-friendly terms, with 71.7% of listings offering Flexible or Moderate policies. This suggests guests in Colesville may expect booking flexibility.
Recommendations for Hosts
- Consider adopting a Moderate policy to align with the 39.1% market standard in Colesville.
- Using a Strict policy might deter some guests, as only 10.9% of listings use it. Evaluate if potential revenue protection outweighs possible lower booking rates.
- Regularly review your cancellation policy against competitors and market demand shifts in Colesville.
Colesville STR Booking Lead Time Analysis (2026)
Average Booking Lead Time by Month
Booking Lead Time Insights for Colesville
- The overall average booking lead time for vacation rentals in Colesville is 32 days.
- Guests book furthest in advance for stays during November (average 78 days), likely coinciding with peak travel demand or local events.
- The shortest booking windows occur for stays in February (average 14 days), indicating more last-minute travel plans during this time.
- Seasonally, Summer (43 days avg.) sees the longest lead times, while Spring (27 days avg.) has the shortest, reflecting typical travel planning cycles.
Recommendations for Hosts
- Use the overall average lead time (32 days) as a baseline for your pricing and availability strategy in Colesville.
- For November stays, consider implementing length-of-stay discounts or slightly higher rates for bookings made less than 78 days out to capitalize on advance planning.
- During February, focus on last-minute booking availability and promotions, as guests book with very short notice (14 days avg.).
- Target marketing efforts for the Summer season well in advance (at least 43 days) to capture early planners.
- Monitor your own booking lead times against these Colesville averages to identify opportunities for dynamic pricing adjustments.
Popular & Essential Airbnb Amenities in Colesville (2026)
Amenity Prevalence
Amenity Insights for Colesville
- Essential amenities in Colesville that guests expect include: Wifi, Air conditioning, Smoke alarm. Lacking these (any) could significantly impact bookings.
- Popular amenities like Free parking on premises, Kitchen, TV are common but not universal. Offering these can provide a competitive edge.
Recommendations for Hosts
- Ensure your listing includes all essential amenities for Colesville: Wifi, Air conditioning, Smoke alarm.
- Prioritize adding missing essentials: Air conditioning, Smoke alarm.
- Consider adding popular differentiators like Free parking on premises or Kitchen to increase appeal.
- Highlight unique or less common amenities you offer (e.g., hot tub, dedicated workspace, EV charger) in your listing description and photos.
- Regularly check competitor amenities in Colesville to stay competitive.
Colesville Airbnb Guest Demographics & Profile Analysis (2026)
Guest Profile Summary for Colesville
- The typical guest profile for Airbnb in Colesville consists of primarily domestic travelers (93%), often arriving from nearby New York, typically belonging to the Post-2000s (Gen Z/Alpha) group (50%), primarily speaking English or Spanish.
- Domestic travelers account for 93.0% of guests.
- Key international markets include United States (93%) and DC (4.5%).
- Top languages spoken are English (67.3%) followed by Spanish (11.2%).
- A significant demographic segment is the Post-2000s (Gen Z/Alpha) group, representing 50% of guests.
Recommendations for Hosts
- Target domestic marketing efforts towards travelers from New York and Washington.
- Tailor amenities and listing descriptions to appeal to the dominant Post-2000s (Gen Z/Alpha) demographic (e.g., highlight fast WiFi, smart home features, local guides).
- Highlight unique local experiences or amenities relevant to the primary guest profile.
- Consider seasonal promotions aligned with peak travel times for key origin markets.
Nearby Short-Term Rental Market Comparison
How does the Colesville Airbnb market stack up against its neighbors? Compare key performance metrics like average monthly revenue, ADR, and occupancy rates in surrounding areas to understand the broader regional STR landscape.
| Market | Active Properties | Monthly Revenue | Daily Rate | Avg. Occupancy |
|---|---|---|---|---|
| Polk Township | 15 | $6,974 | $520.26 | 38% |
| Lemont | 21 | $6,940 | $873.93 | 37% |
| College Township | 83 | $6,551 | $848.63 | 36% |
| Centreville | 17 | $6,298 | $565.66 | 45% |
| McGaheysville | 83 | $6,156 | $431.72 | 45% |
| State College | 192 | $6,081 | $712.29 | 40% |
| Mayo | 13 | $5,915 | $447.58 | 51% |
| Shannondale | 45 | $5,808 | $337.30 | 54% |
| Hellam Township | 24 | $5,496 | $386.69 | 45% |
| Stevensville | 80 | $5,412 | $556.79 | 41% |