Chillum Airbnb Market Analysis 2026: Short Term Rental Data & Vacation Rental Statistics in Maryland, United States
Is Airbnb profitable in Chillum in 2026? Explore comprehensive Airbnb analytics for Chillum, Maryland, United States to uncover income potential. This 2026 STR market report for Chillum, based on AirROI data from February 2025 to January 2026, reveals key trends in the niche market of 19 active listings.
Whether you're considering an Airbnb investment in Chillum, optimizing your existing vacation rental, or exploring rental arbitrage opportunities, understanding the Chillum Airbnb data is crucial. Navigating the high regulation landscape is key to maximizing your short term rental income potential. Let's dive into the specifics.
Key Chillum Airbnb Performance Metrics Overview
Monthly Airbnb Revenue Variations & Income Potential in Chillum (2026)
Understanding the monthly revenue variations for Airbnb listings in Chillum is key to maximizing your short term rental income potential. Seasonality significantly impacts earnings. Our analysis, based on data from the past 12 months, shows that the peak revenue month for STRs in Chillum is typically December, while January often presents the lowest earnings, highlighting opportunities for strategic pricing adjustments during shoulder and low seasons. Explore the typical Airbnb income in Chillum across different performance tiers:
- Best-in-class properties (Top 10%) achieve $2,278+ monthly, often utilizing dynamic pricing and superior guest experiences.
- Strong performing properties (Top 25%) earn $1,742 or more, indicating effective management and desirable locations/amenities.
- Typical properties (Median) generate around $1,165 per month, representing the average market performance.
- Entry-level properties (Bottom 25%) see earnings around $656, often with potential for optimization.
Average Monthly Airbnb Earnings Trend in Chillum
Chillum Airbnb Occupancy Rate Trends (2026)
Maximize your bookings by understanding the Chillum STR occupancy trends. Seasonal demand shifts significantly influence how often properties are booked. Typically, Decembersees the highest demand (peak season occupancy), while January experiences the lowest (low season). Effective strategies, like adjusting minimum stays or offering promotions, can boost occupancy during slower periods. Here's how different property tiers perform in Chillum:
- Best-in-class properties (Top 10%) achieve 84%+ occupancy, indicating high desirability and potentially optimized availability.
- Strong performing properties (Top 25%) maintain 61% or higher occupancy, suggesting good market fit and guest satisfaction.
- Typical properties (Median) have an occupancy rate around 41%.
- Entry-level properties (Bottom 25%) average 22% occupancy, potentially facing higher vacancy.
Average Monthly Occupancy Rate Trend in Chillum
Average Daily Rate (ADR) Airbnb Trends in Chillum (2026)
Effective short term rental pricing strategy in Chillum involves understanding monthly ADR fluctuations. The Average Daily Rate (ADR) for Airbnb in Chillum typically peaks in May and dips lowest during January. Leveraging Airbnb dynamic pricing tools or strategies based on this seasonality can significantly boost revenue. Here's a look at the typical nightly rates achieved:
- Best-in-class properties (Top 10%) command rates of $202+ per night, often due to premium features or locations.
- Strong performing properties (Top 25%) achieve nightly rates of $108 or more.
- Typical properties (Median) charge around $78 per night.
- Entry-level properties (Bottom 25%) earn around $55 per night.
Average Daily Rate (ADR) Trend by Month in Chillum
Get Live Chillum Market Intelligence 👇

Explore Real-time Analytics
Airbnb Seasonality Analysis & Trends in Chillum (2026)
Peak Season (December, July, August)
- Revenue averages $1,838 per month
- Occupancy rates average 62.0%
- Daily rates average $103
Shoulder Season
- Revenue averages $1,192 per month
- Occupancy maintains around 43.5%
- Daily rates hold near $100
Low Season (January, March, September)
- Revenue drops to average $893 per month
- Occupancy decreases to average 30.5%
- Daily rates adjust to average $94
Seasonality Insights for Chillum
- The Airbnb seasonality in Chillum shows highly seasonal trends requiring careful strategy. While the sections above show seasonal averages, it's also insightful to look at the extremes:
- During the high season, the absolute peak month showcases Chillum's highest earning potential, with monthly revenues capable of climbing to $1,976, occupancy reaching a high of 64.5%, and ADRs peaking at $111.
- Conversely, the slowest single month of the year, typically falling within the low season, marks the market's lowest point. In this month, revenue might dip to $592, occupancy could drop to 20.6%, and ADRs may adjust down to $88.
- Understanding both the seasonal averages and these monthly peaks and troughs in revenue, occupancy, and ADR is crucial for maximizing your Airbnb profit potential in Chillum.
Seasonal Strategies for Maximizing Profit
- Peak Season: Maximize revenue through premium pricing and potentially longer minimum stays. Ensure high availability.
- Low Season: Offer competitive pricing, special promotions (e.g., extended stay discounts), and flexible cancellation policies. Target off-season travelers like remote workers or budget-conscious guests.
- Shoulder Seasons: Implement dynamic pricing that balances peak and low rates. Target weekend travelers or specific events. Offer slightly more flexible terms than peak season.
- Regularly analyze your own performance against these Chillum seasonality benchmarks and adjust your pricing and availability strategy accordingly.
Best Areas for Airbnb Investment in Chillum (2026)
Exploring the top neighborhoods for short-term rentals in Chillum? This section highlights key areas, outlining why they are attractive for hosts and guests, along with notable local attractions. Consider these locations based on your target guest profile and investment strategy.
| Neighborhood / Area | Why Host Here? (Target Guests & Appeal) | Key Attractions & Landmarks |
|---|---|---|
| Takoma Park | A diverse, family-friendly community with a vibrant arts scene and historic charm. Proximity to Washington, D.C. makes it attractive to tourists and business travelers alike. | Takoma Park Farmers Market, Silver Spring Civic Center, Historical Takoma, Sligo Creek Park, Takoma Theatre |
| Hyattsville | A burgeoning arts and cultural scene, making it appealing for young visitors and those looking for affordable accommodations near D.C. It features murals and local art galleries. | Hyattsville Arts District, Prince George's Plaza, Magruder Park, Gateway Arts Center, Riverdale Park |
| Langley Park | A vibrant, multicultural neighborhood, close to the D.C. border, offering affordable stays for international tourists seeking a diverse experience. | Langley Park Plaza, Prince George's Sports and Learning Complex, Woodland International Market, Local dining spots, Multicultural festivals |
| Mount Rainier | A small town with a strong community feel, known for its historic homes and close-knit neighborhoods, appealing to those who want a quiet stay with easy access to D.C. | Mount Rainier Artist Lofts, Public parks, Local shops and cafes, Historic architecture, Community events |
| North Brentwood | A quaint community with a mix of suburban and urban vibes. Its proximity to Washington D.C. makes it attractive for those visiting the capital for leisure or business. | North Brentwood Historic District, Local parks, Art galleries, Dining within the vicinity, Community parks |
| College Park | Home to the University of Maryland, attracting families and students. Offers a mix of student-oriented activities and family-friendly attractions. | University of Maryland Campus, Old Town College Park, Lake Artemesia, U.S. National Archives at College Park, College Park Aviation Museum |
| Bladensburg | An emerging area with historical significance and waterfront access. Ideal for tourists exploring the Anacostia River area. | Bladensburg Waterfront Park, Historic Bladensburg, Anacostia River trails, Local history attractions, Fishing spots |
| Greenbelt | A planned community with parks and green space, popular for families and eco-minded travelers. Close to the Greenbelt Metro station for easy access to D.C. | Greenbelt Park, Greenbelt Historic District, Buddy Attick Park, Greenbelt Theatre, Local dining options |
Understanding Airbnb License Requirements & STR Laws in Chillum (2026)
Yes, Chillum, Maryland, United States enforces high STR regulations. Obtaining a license and ensuring compliance is almost certainly required according to current 2026 STR laws. Always verify the latest short term rental regulations and Airbnb license requirements directly with local government authorities for Chillum to ensure full compliance before hosting.
(Source: AirROI data, 2026, based on 63% licensed listings)
Top Performing Airbnb Properties in Chillum (2026)
Benchmark your potential! Explore examples of top-performing Airbnb properties in Chillumbased on Trailing Twelve Month (TTM) revenue. Analyze their characteristics, revenue, occupancy rate, and ADR to understand what drives success in this market.
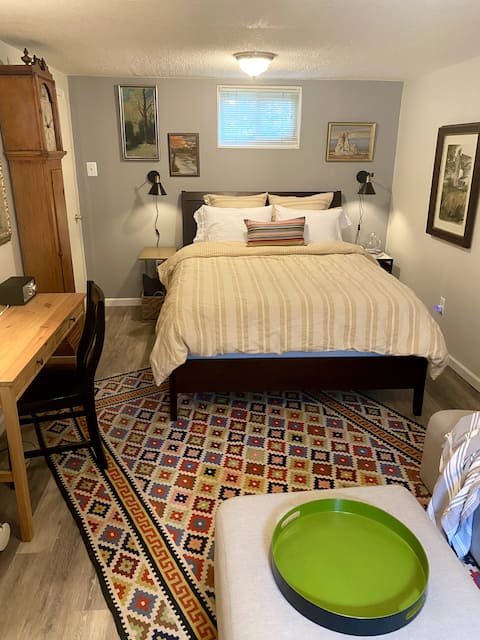
Historic Avondale Grove Basement
Private Room • N/A
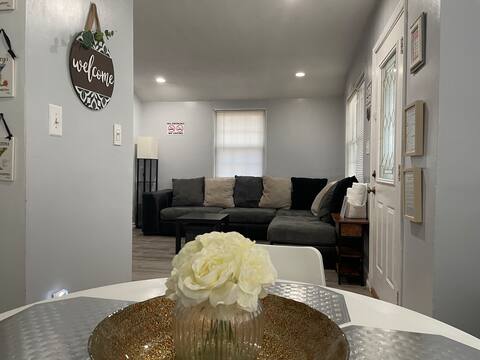
Renovated Guest Suite
Entire Place • 2 bedrooms

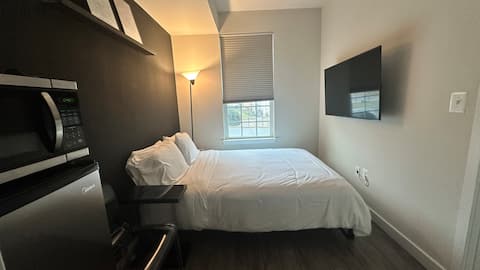
Family Staycation near DC ( Free parking)
Entire Place • 1 bedroom

Private entire basement, private bath,free parking
Entire Place • 1 bedroom
Private & Comfortable Bed and Bath | DC/MD Border
Private Room • 1 bedroom

Luxury RV 2 minutes from DC border
Entire Place • 1 bedroom
Note: Performance varies based on location, size, amenities, seasonality, and management quality. Data reflects the past 12 months.
Top Performing Airbnb Hosts in Chillum (2026)
Learn from the best! This table showcases top-performing Airbnb hosts in Chillum based on the number of properties managed and estimated total revenue over the past year. Analyze their scale and performance metrics.
| Host Name | Properties | Grossing Revenue | Stay Reviews | Avg Rating |
|---|---|---|---|---|
| Patrick | 2 | $27,937 | 149 | 4.65/5.0 |
| Mark | 1 | $25,451 | 106 | 4.90/5.0 |
| Diana | 1 | $21,652 | 106 | 4.56/5.0 |
| Mariam | 1 | $15,790 | 467 | 4.57/5.0 |
| Daniel | 3 | $11,987 | 51 | 4.74/5.0 |
| Ike | 1 | $11,651 | 65 | 4.97/5.0 |
| Angela | 2 | $10,366 | 78 | 4.56/5.0 |
| Julio | 3 | $6,560 | 138 | 4.72/5.0 |
| Bersabay | 2 | $4,407 | 3 | Not Rated |
| Yewubdar | 1 | $3,781 | 8 | 4.63/5.0 |
Analyzing the strategies of top hosts, such as their property selection, pricing, and guest communication, can offer valuable lessons for optimizing your own Airbnb operations in Chillum.
Dive Deeper: Advanced Chillum STR Market Data (2026)
Ready to unlock more insights? AirROI provides access to advanced metrics and comprehensive Airbnb data for Chillum. Explore detailed analytics beyond this report to refine your investment strategy, optimize pricing, and maximize your vacation rental profits.
Explore Advanced MetricsChillum Short-Term Rental Market Composition (2026): Property & Room Types
Room Type Distribution
Property Type Distribution
Market Composition Insights for Chillum
- The Chillum Airbnb market composition is heavily skewed towards Entire Home/Apt listings, which make up 68.4% of the 19 active rentals. This indicates strong guest preference for privacy and space.
- However, a notable 31.6% share for Private Rooms suggests opportunities for budget-conscious travelers or hosts renting out spare rooms.
- Looking at the property type distribution in Chillum, Apartment/Condo properties are the most common (42.1%), reflecting the local real estate landscape.
- Houses represent a significant 42.1% portion, catering likely to families or larger groups.
Chillum Airbnb Room Capacity Analysis (2026): Bedroom Distribution
Distribution of Listings by Number of Bedrooms
Room Capacity Insights for Chillum
- The dominant room capacity in Chillum is 1 bedroom listings, making up 52.6% of the market. This suggests a strong demand for properties suitable for couples or solo travelers.
- Together, 1 bedroom and 5+ bedrooms properties represent 57.9% of the active Airbnb listings in Chillum, indicating a high concentration in these sizes.
- With over half the market (52.6%) consisting of studios or 1-bedroom units, Chillum is particularly well-suited for individuals or couples.
Chillum Vacation Rental Guest Capacity Trends (2026)
Distribution of Listings by Guest Capacity
Guest Capacity Insights for Chillum
- The most common guest capacity trend in Chillum vacation rentals is listings accommodating 3 guests (21.1%). This suggests the primary traveler segment is likely small families or groups.
- Properties designed for 3 guests and 2 guests dominate the Chillum STR market, accounting for 36.9% of listings.
- 10.6% of properties accommodate 6+ guests, serving the market segment for larger families or group travel in Chillum.
- On average, properties in Chillum are equipped to host 2.5 guests.
Chillum Airbnb Booking Patterns (2026): Available vs. Booked Days
Available Days Distribution
Booked Days Distribution
Booking Pattern Insights for Chillum
- The most common availability pattern in Chillum falls within the 271-366 days range, representing 73.7% of listings. This suggests many properties have significant open periods on their calendars.
- Approximately 79.0% of listings show high availability (181+ days open annually), indicating potential for increased bookings or specific owner usage patterns.
- For booked days, the 1-30 days range is most frequent in Chillum (36.8%), reflecting common guest stay durations or potential owner blocking patterns.
- A notable 21.1% of properties secure long booking periods (181+ days booked per year), highlighting successful long-term rental strategies or significant owner usage.
Chillum Airbnb Minimum Stay Requirements Analysis
Distribution of Listings by Minimum Night Requirement
1 Night
3 listings
15.8% of total
2 Nights
4 listings
21.1% of total
3 Nights
3 listings
15.8% of total
4-6 Nights
1 listings
5.3% of total
30+ Nights
8 listings
42.1% of total
Key Insights
- The most prevalent minimum stay requirement in Chillum is 30+ Nights, adopted by 42.1% of listings. This highlights the market's preference for longer commitments.
- A significant segment (42.1%) caters to monthly stays (30+ nights) in Chillum, pointing to opportunities in the extended-stay market.
Recommendations
- Align with the market by considering a 30+ Nights minimum stay, as 42.1% of Chillum hosts use this setting.
- If feasible, allowing 1-night stays, especially midweek or during low season, could capture last-minute bookings, as only 15.8% currently do.
- Explore offering discounts for stays of 30+ nights to attract the 42.1% of the market seeking extended stays.
- Adjust minimum nights based on seasonality – potentially shorter during low season and longer during peak demand periods in Chillum.
Chillum Airbnb Cancellation Policy Trends Analysis (2026)
Flexible
7 listings
36.8% of total
Moderate
5 listings
26.3% of total
Firm
7 listings
36.8% of total
Cancellation Policy Insights for Chillum
- The prevailing Airbnb cancellation policy trend in Chillum is Flexible, used by 36.8% of listings.
- There's a relatively balanced mix between guest-friendly (63.1%) and stricter (36.8%) policies, offering choices for different guest needs.
Recommendations for Hosts
- Consider adopting a Flexible policy to align with the 36.8% market standard in Chillum.
- Regularly review your cancellation policy against competitors and market demand shifts in Chillum.
Chillum STR Booking Lead Time Analysis (2026)
Average Booking Lead Time by Month
Booking Lead Time Insights for Chillum
- The overall average booking lead time for vacation rentals in Chillum is 32 days.
- Guests book furthest in advance for stays during June (average 59 days), likely coinciding with peak travel demand or local events.
- The shortest booking windows occur for stays in August (average 11 days), indicating more last-minute travel plans during this time.
- Seasonally, Summer (33 days avg.) sees the longest lead times, while Winter (18 days avg.) has the shortest, reflecting typical travel planning cycles.
Recommendations for Hosts
- Use the overall average lead time (32 days) as a baseline for your pricing and availability strategy in Chillum.
- For June stays, consider implementing length-of-stay discounts or slightly higher rates for bookings made less than 59 days out to capitalize on advance planning.
- During August, focus on last-minute booking availability and promotions, as guests book with very short notice (11 days avg.).
- Target marketing efforts for the Summer season well in advance (at least 33 days) to capture early planners.
- Monitor your own booking lead times against these Chillum averages to identify opportunities for dynamic pricing adjustments.
Popular & Essential Airbnb Amenities in Chillum (2026)
Amenity Prevalence
Amenity Insights for Chillum
- Essential amenities in Chillum that guests expect include: Air conditioning. Lacking these (this) could significantly impact bookings.
- Popular amenities like Wifi, Smoke alarm, Free parking on premises are common but not universal. Offering these can provide a competitive edge.
- Warning: Wifi is not universally provided but is considered essential globally. Ensure reliable Wifi is offered.
Recommendations for Hosts
- Ensure your listing includes all essential amenities for Chillum: Air conditioning.
- Consider adding popular differentiators like Wifi or Smoke alarm to increase appeal.
- Highlight unique or less common amenities you offer (e.g., hot tub, dedicated workspace, EV charger) in your listing description and photos.
- Regularly check competitor amenities in Chillum to stay competitive.
Chillum Airbnb Guest Demographics & Profile Analysis (2026)
Guest Profile Summary for Chillum
- The typical guest profile for Airbnb in Chillum consists of primarily domestic travelers (86%), often arriving from nearby New York, typically belonging to the Post-2000s (Gen Z/Alpha) group (50%), primarily speaking English or Spanish.
- Domestic travelers account for 85.7% of guests.
- Key international markets include United States (85.7%) and DC (8.9%).
- Top languages spoken are English (69.8%) followed by Spanish (14%).
- A significant demographic segment is the Post-2000s (Gen Z/Alpha) group, representing 50% of guests.
Recommendations for Hosts
- Target domestic marketing efforts towards travelers from New York and Washington.
- Tailor amenities and listing descriptions to appeal to the dominant Post-2000s (Gen Z/Alpha) demographic (e.g., highlight fast WiFi, smart home features, local guides).
- Highlight unique local experiences or amenities relevant to the primary guest profile.
- Consider seasonal promotions aligned with peak travel times for key origin markets.
Nearby Short-Term Rental Market Comparison
How does the Chillum Airbnb market stack up against its neighbors? Compare key performance metrics like average monthly revenue, ADR, and occupancy rates in surrounding areas to understand the broader regional STR landscape.
| Market | Active Properties | Monthly Revenue | Daily Rate | Avg. Occupancy |
|---|---|---|---|---|
| Centreville | 17 | $6,298 | $565.66 | 45% |
| Mayo | 13 | $5,915 | $447.58 | 51% |
| Shannondale | 45 | $5,808 | $337.30 | 54% |
| Stevensville | 80 | $5,412 | $556.79 | 41% |
| Weems | 11 | $5,077 | $417.22 | 47% |
| Lower Windsor Township | 14 | $5,062 | $428.71 | 45% |
| Arundel on the Bay | 29 | $5,043 | $486.96 | 40% |
| Easton | 45 | $4,985 | $654.52 | 39% |
| Mineral | 231 | $4,800 | $474.55 | 36% |
| Middleburg | 39 | $4,681 | $485.11 | 41% |