Bennsville Airbnb Market Analysis 2025: Short Term Rental Data & Vacation Rental Statistics in Maryland, United States
Is Airbnb profitable in Bennsville in 2025? Explore comprehensive Airbnb analytics for Bennsville, Maryland, United States to uncover income potential. This 2025 STR market report for Bennsville, based on AirROI data from November 2024 to October 2025, reveals key trends in the niche market of 18 active listings.
Whether you're considering an Airbnb investment in Bennsville, optimizing your existing vacation rental, or exploring rental arbitrage opportunities, understanding the Bennsville Airbnb data is crucial. Leveraging the low regulation environment is key to maximizing your short term rental income potential. Let's dive into the specifics.
Key Bennsville Airbnb Performance Metrics Overview
Monthly Airbnb Revenue Variations & Income Potential in Bennsville (2025)
Understanding the monthly revenue variations for Airbnb listings in Bennsville is key to maximizing your short term rental income potential. Seasonality significantly impacts earnings. Our analysis, based on data from the past 12 months, shows that the peak revenue month for STRs in Bennsville is typically December, while October often presents the lowest earnings, highlighting opportunities for strategic pricing adjustments during shoulder and low seasons. Explore the typical Airbnb income in Bennsville across different performance tiers:
- Best-in-class properties (Top 10%) achieve $2,829+ monthly, often utilizing dynamic pricing and superior guest experiences.
- Strong performing properties (Top 25%) earn $1,839 or more, indicating effective management and desirable locations/amenities.
- Typical properties (Median) generate around $708 per month, representing the average market performance.
- Entry-level properties (Bottom 25%) see earnings around $429, often with potential for optimization.
Average Monthly Airbnb Earnings Trend in Bennsville
Bennsville Airbnb Occupancy Rate Trends (2025)
Maximize your bookings by understanding the Bennsville STR occupancy trends. Seasonal demand shifts significantly influence how often properties are booked. Typically, Novembersees the highest demand (peak season occupancy), while October experiences the lowest (low season). Effective strategies, like adjusting minimum stays or offering promotions, can boost occupancy during slower periods. Here's how different property tiers perform in Bennsville:
- Best-in-class properties (Top 10%) achieve 67%+ occupancy, indicating high desirability and potentially optimized availability.
- Strong performing properties (Top 25%) maintain 52% or higher occupancy, suggesting good market fit and guest satisfaction.
- Typical properties (Median) have an occupancy rate around 29%.
- Entry-level properties (Bottom 25%) average 15% occupancy, potentially facing higher vacancy.
Average Monthly Occupancy Rate Trend in Bennsville
Average Daily Rate (ADR) Airbnb Trends in Bennsville (2025)
Effective short term rental pricing strategy in Bennsville involves understanding monthly ADR fluctuations. The Average Daily Rate (ADR) for Airbnb in Bennsville typically peaks in January and dips lowest during September. Leveraging Airbnb dynamic pricing tools or strategies based on this seasonality can significantly boost revenue. Here's a look at the typical nightly rates achieved:
- Best-in-class properties (Top 10%) command rates of $147+ per night, often due to premium features or locations.
- Strong performing properties (Top 25%) achieve nightly rates of $115 or more.
- Typical properties (Median) charge around $61 per night.
- Entry-level properties (Bottom 25%) earn around $38 per night.
Average Daily Rate (ADR) Trend by Month in Bennsville
Get Live Bennsville Market Intelligence 👇

Explore Real-time Analytics
Airbnb Seasonality Analysis & Trends in Bennsville (2025)
Peak Season (December, November, March)
- Revenue averages $1,836 per month
- Occupancy rates average 43.9%
- Daily rates average $92
Shoulder Season
- Revenue averages $1,146 per month
- Occupancy maintains around 35.7%
- Daily rates hold near $90
Low Season (April, August, October)
- Revenue drops to average $808 per month
- Occupancy decreases to average 27.2%
- Daily rates adjust to average $89
Seasonality Insights for Bennsville
- The Airbnb seasonality in Bennsville shows highly seasonal trends requiring careful strategy. While the sections above show seasonal averages, it's also insightful to look at the extremes:
- During the high season, the absolute peak month showcases Bennsville's highest earning potential, with monthly revenues capable of climbing to $1,989, occupancy reaching a high of 51.2%, and ADRs peaking at $95.
- Conversely, the slowest single month of the year, typically falling within the low season, marks the market's lowest point. In this month, revenue might dip to $609, occupancy could drop to 19.4%, and ADRs may adjust down to $85.
- Understanding both the seasonal averages and these monthly peaks and troughs in revenue, occupancy, and ADR is crucial for maximizing your Airbnb profit potential in Bennsville.
Seasonal Strategies for Maximizing Profit
- Peak Season: Maximize revenue through premium pricing and potentially longer minimum stays. Ensure high availability.
- Low Season: Offer competitive pricing, special promotions (e.g., extended stay discounts), and flexible cancellation policies. Target off-season travelers like remote workers or budget-conscious guests.
- Shoulder Seasons: Implement dynamic pricing that balances peak and low rates. Target weekend travelers or specific events. Offer slightly more flexible terms than peak season.
- Regularly analyze your own performance against these Bennsville seasonality benchmarks and adjust your pricing and availability strategy accordingly.
Best Areas for Airbnb Investment in Bennsville (2025)
Exploring the top neighborhoods for short-term rentals in Bennsville? This section highlights key areas, outlining why they are attractive for hosts and guests, along with notable local attractions. Consider these locations based on your target guest profile and investment strategy.
| Neighborhood / Area | Why Host Here? (Target Guests & Appeal) | Key Attractions & Landmarks |
|---|---|---|
| Bennsville Park | A residential area with proximity to parks and recreational facilities, making it a family-friendly location ideal for visitors seeking outdoor activities and local experiences. | Bennsville Park, Rosaryville State Park, Waldorf West Library |
| Bennsville Town Center | A centrally located hub that offers various dining and shopping options. It's convenient for both tourists and local visitors, appealing to those wanting a suburban feel with urban amenities. | Bennsville Town Center, Waldorf Marketplace, The St. Charles Towne Center |
| La Plata | Nearby La Plata provides a charming small-town atmosphere rich in history. Tourists interested in culture and heritage will find this area appealing, especially with its local events and attractions. | La Plata Historic District, La Plata Town Hall, Maryland Blue Crab, Local Farmers Market |
| Waldorf | Waldorf is a larger nearby community with numerous attractions, retail spaces, and restaurant options. It attracts a range of guests from business travelers to families visiting the area. | Waldorf Nature Park, The Town Center at St. Charles, Smallwood State Park |
| Brandywine | Brandywine offers a suburban setting with access to rural landscapes. This area is perfect for those who want a peaceful getaway while still being near the attractions of suburban Maryland. | Croom Regional Park, Brandywine Historic District, Meadowside Park |
| Oxon Hill | While a little further out, Oxon Hill offers great access to the National Harbor and the waterfront, making it appealing for guests wanting entertainment and attractions in a vibrant area. | National Harbor, MGM National Harbor, Oxon Cove Park |
| Fort Washington | Near the Potomac River and historical sites, this area attracts guests who are interested in history and relaxing natural environments, providing a unique experience near Washington, D.C. | Fort Washington Park, Chesapeake and Ohio Canal, Potomac River |
| Upper Marlboro | As the county seat, Upper Marlboro offers a blend of historical attractions and local charm, appealing to visitors interested in Maryland's history and community events. | Marlboro Memorial Library, Prince George's County Historical Society, The Cabin at Nottingham |
Understanding Airbnb License Requirements & STR Laws in Bennsville (2025)
While Bennsville, Maryland, United States currently shows low STR regulations, specific Airbnb license requirements might still exist or change. Always verify the latest short term rental regulations and Airbnb license requirements directly with local government authorities for Bennsville to ensure full compliance before hosting.
(Source: AirROI data, 2025, finding no licensed listings among those analyzed)
Top Performing Airbnb Properties in Bennsville (2025)
Benchmark your potential! Explore examples of top-performing Airbnb properties in Bennsvillebased on Trailing Twelve Month (TTM) revenue. Analyze their characteristics, revenue, occupancy rate, and ADR to understand what drives success in this market.

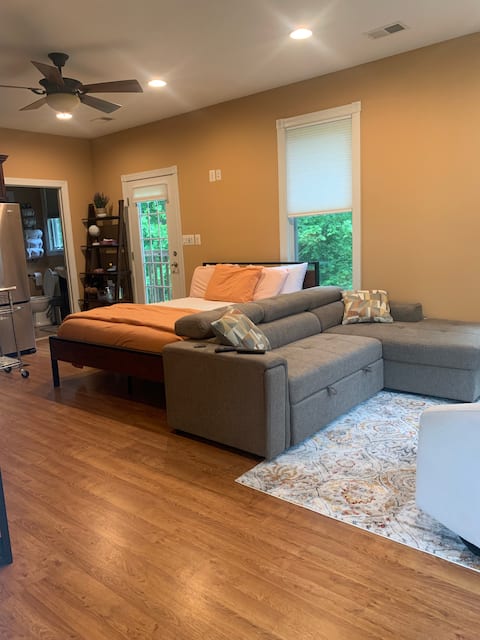
Waldorf MD: Gingko Lane: MCM Vibe Newly Renovated
Entire Place • 1 bedroom

Adorable 1 Bedroom Getaway Retreat
Entire Place • 1 bedroom
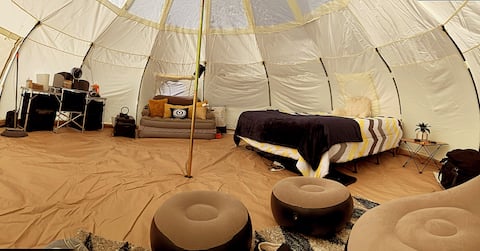
Mobile Glamping - We Come 2 U
Entire Place • 5 bedrooms
Adorable Large Efficiency Getaway Retreat
Entire Place • N/A

The Atrium with Luxury Backyard Retreat
Private Room • N/A

@ Maggie's
Private Room • N/A
Note: Performance varies based on location, size, amenities, seasonality, and management quality. Data reflects the past 12 months.
Top Performing Airbnb Hosts in Bennsville (2025)
Learn from the best! This table showcases top-performing Airbnb hosts in Bennsville based on the number of properties managed and estimated total revenue over the past year. Analyze their scale and performance metrics.
| Host Name | Properties | Grossing Revenue | Stay Reviews | Avg Rating |
|---|---|---|---|---|
| Donald | 2 | $47,466 | 241 | 4.99/5.0 |
| Lisa | 1 | $25,743 | 121 | 4.97/5.0 |
| Nakia | 1 | $24,742 | 1 | Not Rated |
| Tron & Tekeah | 1 | $15,095 | 83 | 4.96/5.0 |
| Caire & Kay | 8 | $14,519 | 79 | 4.62/5.0 |
| Gessese | 2 | $9,751 | 51 | 4.85/5.0 |
| Moniguane | 1 | $8,784 | 46 | 5.00/5.0 |
| Nicole | 1 | $5,403 | 35 | 4.94/5.0 |
| Beth | 1 | $500 | 8 | 4.75/5.0 |
Analyzing the strategies of top hosts, such as their property selection, pricing, and guest communication, can offer valuable lessons for optimizing your own Airbnb operations in Bennsville.
Dive Deeper: Advanced Bennsville STR Market Data (2025)
Ready to unlock more insights? AirROI provides access to advanced metrics and comprehensive Airbnb data for Bennsville. Explore detailed analytics beyond this report to refine your investment strategy, optimize pricing, and maximize your vacation rental profits.
Explore Advanced MetricsBennsville Short-Term Rental Market Composition (2025): Property & Room Types
Room Type Distribution
Property Type Distribution
Market Composition Insights for Bennsville
- The Bennsville Airbnb market composition is heavily skewed towards Private Room listings, which make up 72.2% of the 18 active rentals. This indicates strong guest preference for privacy and space.
- Looking at the property type distribution in Bennsville, House properties are the most common (61.1%), reflecting the local real estate landscape.
- Houses represent a significant 61.1% portion, catering likely to families or larger groups.
- The presence of 16.7% Hotel/Boutique listings indicates integration with traditional hospitality.
Bennsville Airbnb Room Capacity Analysis (2025): Bedroom Distribution
Distribution of Listings by Number of Bedrooms
Room Capacity Insights for Bennsville
- The dominant room capacity in Bennsville is 1 bedroom listings, making up 33.3% of the market. This suggests a strong demand for properties suitable for couples or solo travelers.
- Together, 1 bedroom and 5+ bedrooms properties represent 38.9% of the active Airbnb listings in Bennsville, indicating a high concentration in these sizes.
- Listings with 3+ bedrooms (5.6%) represent a smaller niche, potentially indicating an underserved market for larger group accommodations in Bennsville.
Bennsville Vacation Rental Guest Capacity Trends (2025)
Distribution of Listings by Guest Capacity
Guest Capacity Insights for Bennsville
- The most common guest capacity trend in Bennsville vacation rentals is listings accommodating 1 guest (11.1%). This suggests the primary traveler segment is likely couples or solo travelers.
- Properties designed for 1 guest and 4 guests dominate the Bennsville STR market, accounting for 22.2% of listings.
- On average, properties in Bennsville are equipped to host 1.4 guests.
Bennsville Airbnb Booking Patterns (2025): Available vs. Booked Days
Available Days Distribution
Booked Days Distribution
Booking Pattern Insights for Bennsville
- The most common availability pattern in Bennsville falls within the 271-366 days range, representing 77.8% of listings. This suggests many properties have significant open periods on their calendars.
- Approximately 83.4% of listings show high availability (181+ days open annually), indicating potential for increased bookings or specific owner usage patterns.
- For booked days, the 31-90 days range is most frequent in Bennsville (50%), reflecting common guest stay durations or potential owner blocking patterns.
- A notable 16.7% of properties secure long booking periods (181+ days booked per year), highlighting successful long-term rental strategies or significant owner usage.
Bennsville Airbnb Minimum Stay Requirements Analysis
Distribution of Listings by Minimum Night Requirement
1 Night
4 listings
22.2% of total
2 Nights
2 listings
11.1% of total
3 Nights
2 listings
11.1% of total
7-29 Nights
4 listings
22.2% of total
30+ Nights
6 listings
33.3% of total
Key Insights
- The most prevalent minimum stay requirement in Bennsville is 30+ Nights, adopted by 33.3% of listings. This highlights the market's preference for longer commitments.
- A significant segment (33.3%) caters to monthly stays (30+ nights) in Bennsville, pointing to opportunities in the extended-stay market.
Recommendations
- Align with the market by considering a 30+ Nights minimum stay, as 33.3% of Bennsville hosts use this setting.
- If feasible, allowing 1-night stays, especially midweek or during low season, could capture last-minute bookings, as only 22.2% currently do.
- Explore offering discounts for stays of 30+ nights to attract the 33.3% of the market seeking extended stays.
- Adjust minimum nights based on seasonality – potentially shorter during low season and longer during peak demand periods in Bennsville.
Bennsville Airbnb Cancellation Policy Trends Analysis (2025)
Limited
1 listings
5.6% of total
Flexible
5 listings
27.8% of total
Moderate
2 listings
11.1% of total
Firm
8 listings
44.4% of total
Strict
2 listings
11.1% of total
Cancellation Policy Insights for Bennsville
- The prevailing Airbnb cancellation policy trend in Bennsville is Firm, used by 44.4% of listings.
- A majority (55.5%) of hosts in Bennsville utilize Firm or Strict policies, indicating a market where hosts prioritize booking security.
Recommendations for Hosts
- Consider adopting a Firm policy to align with the 44.4% market standard in Bennsville.
- Using a Strict policy might deter some guests, as only 11.1% of listings use it. Evaluate if potential revenue protection outweighs possible lower booking rates.
- Regularly review your cancellation policy against competitors and market demand shifts in Bennsville.
Bennsville STR Booking Lead Time Analysis (2025)
Average Booking Lead Time by Month
Booking Lead Time Insights for Bennsville
- The overall average booking lead time for vacation rentals in Bennsville is 14 days.
- Guests book furthest in advance for stays during April (average 42 days), likely coinciding with peak travel demand or local events.
- The shortest booking windows occur for stays in February (average 10 days), indicating more last-minute travel plans during this time.
- Seasonally, Fall (28 days avg.) sees the longest lead times, while Summer (14 days avg.) has the shortest, reflecting typical travel planning cycles.
Recommendations for Hosts
- Use the overall average lead time (14 days) as a baseline for your pricing and availability strategy in Bennsville.
- For April stays, consider implementing length-of-stay discounts or slightly higher rates for bookings made less than 42 days out to capitalize on advance planning.
- Target marketing efforts for the Fall season well in advance (at least 28 days) to capture early planners.
- Monitor your own booking lead times against these Bennsville averages to identify opportunities for dynamic pricing adjustments.
Popular & Essential Airbnb Amenities in Bennsville (2025)
Amenity Prevalence
Amenity Insights for Bennsville
- Essential amenities in Bennsville that guests expect include: Smoke alarm, Wifi, Carbon monoxide alarm, Air conditioning, First aid kit. Lacking these (any) could significantly impact bookings.
- Popular amenities like Free parking on premises, Kitchen, Fire extinguisher are common but not universal. Offering these can provide a competitive edge.
Recommendations for Hosts
- Ensure your listing includes all essential amenities for Bennsville: Smoke alarm, Wifi, Carbon monoxide alarm, Air conditioning, First aid kit.
- Consider adding popular differentiators like Free parking on premises or Kitchen to increase appeal.
- Highlight unique or less common amenities you offer (e.g., hot tub, dedicated workspace, EV charger) in your listing description and photos.
- Regularly check competitor amenities in Bennsville to stay competitive.
Bennsville Airbnb Guest Demographics & Profile Analysis (2025)
Guest Profile Summary for Bennsville
- The typical guest profile for Airbnb in Bennsville consists of primarily domestic travelers (86%), often arriving from nearby Washington, typically belonging to the Post-2000s (Gen Z/Alpha) group (50%), primarily speaking English or Spanish.
- Domestic travelers account for 86.1% of guests.
- Key international markets include United States (86.1%) and DC (13.9%).
- Top languages spoken are English (71.4%) followed by Spanish (11.9%).
- A significant demographic segment is the Post-2000s (Gen Z/Alpha) group, representing 50% of guests.
Recommendations for Hosts
- Target domestic marketing efforts towards travelers from Washington and Maryland City.
- Tailor amenities and listing descriptions to appeal to the dominant Post-2000s (Gen Z/Alpha) demographic (e.g., highlight fast WiFi, smart home features, local guides).
- Highlight unique local experiences or amenities relevant to the primary guest profile.
- Consider seasonal promotions aligned with peak travel times for key origin markets.
Nearby Short-Term Rental Market Comparison
How does the Bennsville Airbnb market stack up against its neighbors? Compare key performance metrics like average monthly revenue, ADR, and occupancy rates in surrounding areas to understand the broader regional STR landscape.
| Market | Active Properties | Monthly Revenue | Daily Rate | Avg. Occupancy |
|---|---|---|---|---|
| Centreville | 16 | $6,145 | $599.99 | 42% |
| Bentonville | 22 | $6,044 | $430.17 | 51% |
| Mayo | 14 | $5,935 | $459.51 | 47% |
| Stevensville | 78 | $5,817 | $572.74 | 40% |
| Castleton | 10 | $5,802 | $559.63 | 34% |
| McGaheysville | 63 | $5,718 | $424.50 | 44% |
| Shannondale | 48 | $5,591 | $328.04 | 56% |
| Nellysford | 60 | $5,309 | $442.37 | 39% |
| Lower Windsor Township | 14 | $5,163 | $436.59 | 47% |
| Arundel on the Bay | 31 | $5,161 | $502.88 | 39% |