St. Francisville Airbnb Market Analysis 2026: Short Term Rental Data & Vacation Rental Statistics in Louisiana, United States
Is Airbnb profitable in St. Francisville in 2026? Explore comprehensive Airbnb analytics for St. Francisville, Louisiana, United States to uncover income potential. This 2026 STR market report for St. Francisville, based on AirROI data from February 2025 to January 2026, reveals key trends in the niche market of 24 active listings.
Whether you're considering an Airbnb investment in St. Francisville, optimizing your existing vacation rental, or exploring rental arbitrage opportunities, understanding the St. Francisville Airbnb data is crucial. Leveraging the low regulation environment is key to maximizing your short term rental income potential. Let's dive into the specifics.
Key St. Francisville Airbnb Performance Metrics Overview
Monthly Airbnb Revenue Variations & Income Potential in St. Francisville (2026)
Understanding the monthly revenue variations for Airbnb listings in St. Francisville is key to maximizing your short term rental income potential. Seasonality significantly impacts earnings. Our analysis, based on data from the past 12 months, shows that the peak revenue month for STRs in St. Francisville is typically December, while January often presents the lowest earnings, highlighting opportunities for strategic pricing adjustments during shoulder and low seasons. Explore the typical Airbnb income in St. Francisville across different performance tiers:
- Best-in-class properties (Top 10%) achieve $3,635+ monthly, often utilizing dynamic pricing and superior guest experiences.
- Strong performing properties (Top 25%) earn $2,490 or more, indicating effective management and desirable locations/amenities.
- Typical properties (Median) generate around $1,842 per month, representing the average market performance.
- Entry-level properties (Bottom 25%) see earnings around $1,305, often with potential for optimization.
Average Monthly Airbnb Earnings Trend in St. Francisville
St. Francisville Airbnb Occupancy Rate Trends (2026)
Maximize your bookings by understanding the St. Francisville STR occupancy trends. Seasonal demand shifts significantly influence how often properties are booked. Typically, Marchsees the highest demand (peak season occupancy), while August experiences the lowest (low season). Effective strategies, like adjusting minimum stays or offering promotions, can boost occupancy during slower periods. Here's how different property tiers perform in St. Francisville:
- Best-in-class properties (Top 10%) achieve 59%+ occupancy, indicating high desirability and potentially optimized availability.
- Strong performing properties (Top 25%) maintain 45% or higher occupancy, suggesting good market fit and guest satisfaction.
- Typical properties (Median) have an occupancy rate around 30%.
- Entry-level properties (Bottom 25%) average 20% occupancy, potentially facing higher vacancy.
Average Monthly Occupancy Rate Trend in St. Francisville
Average Daily Rate (ADR) Airbnb Trends in St. Francisville (2026)
Effective short term rental pricing strategy in St. Francisville involves understanding monthly ADR fluctuations. The Average Daily Rate (ADR) for Airbnb in St. Francisville typically peaks in June and dips lowest during March. Leveraging Airbnb dynamic pricing tools or strategies based on this seasonality can significantly boost revenue. Here's a look at the typical nightly rates achieved:
- Best-in-class properties (Top 10%) command rates of $473+ per night, often due to premium features or locations.
- Strong performing properties (Top 25%) achieve nightly rates of $307 or more.
- Typical properties (Median) charge around $191 per night.
- Entry-level properties (Bottom 25%) earn around $113 per night.
Average Daily Rate (ADR) Trend by Month in St. Francisville
Get Live St. Francisville Market Intelligence 👇

Explore Real-time Analytics
Airbnb Seasonality Analysis & Trends in St. Francisville (2026)
Peak Season (December, November, October)
- Revenue averages $2,987 per month
- Occupancy rates average 41.2%
- Daily rates average $240
Shoulder Season
- Revenue averages $2,219 per month
- Occupancy maintains around 35.8%
- Daily rates hold near $237
Low Season (January, August, September)
- Revenue drops to average $1,376 per month
- Occupancy decreases to average 22.9%
- Daily rates adjust to average $237
Seasonality Insights for St. Francisville
- The Airbnb seasonality in St. Francisville shows highly seasonal trends requiring careful strategy. While the sections above show seasonal averages, it's also insightful to look at the extremes:
- During the high season, the absolute peak month showcases St. Francisville's highest earning potential, with monthly revenues capable of climbing to $3,046, occupancy reaching a high of 45.6%, and ADRs peaking at $243.
- Conversely, the slowest single month of the year, typically falling within the low season, marks the market's lowest point. In this month, revenue might dip to $1,234, occupancy could drop to 21.6%, and ADRs may adjust down to $231.
- Understanding both the seasonal averages and these monthly peaks and troughs in revenue, occupancy, and ADR is crucial for maximizing your Airbnb profit potential in St. Francisville.
Seasonal Strategies for Maximizing Profit
- Peak Season: Maximize revenue through premium pricing and potentially longer minimum stays. Ensure high availability.
- Low Season: Offer competitive pricing, special promotions (e.g., extended stay discounts), and flexible cancellation policies. Target off-season travelers like remote workers or budget-conscious guests.
- Shoulder Seasons: Implement dynamic pricing that balances peak and low rates. Target weekend travelers or specific events. Offer slightly more flexible terms than peak season.
- Regularly analyze your own performance against these St. Francisville seasonality benchmarks and adjust your pricing and availability strategy accordingly.
Best Areas for Airbnb Investment in St. Francisville (2026)
Exploring the top neighborhoods for short-term rentals in St. Francisville? This section highlights key areas, outlining why they are attractive for hosts and guests, along with notable local attractions. Consider these locations based on your target guest profile and investment strategy.
| Neighborhood / Area | Why Host Here? (Target Guests & Appeal) | Key Attractions & Landmarks |
|---|---|---|
| Historic District | Charming area filled with antebellum homes and rich history. Great for guests interested in the heritage and culture of Louisiana with proximity to local dining and shopping. | Rosedown Plantation State Historic Site, Anvil Bar and Grill, St. Francisville Culture, Grace Church, The Myrtles Plantation |
| River Road | Scenic byway along the Mississippi River that offers picturesque views and easy access to historic sites. Appeals to nature lovers and those seeking a peaceful retreat. | Houmas House and Gardens, Laurel Hill Plantation, Catherine's Rest, Mississippi River Overlook, Rural Louisiana Landscape |
| Baton Rouge | Nearby capital city offering a blend of culture, history, and nightlife. Perfect for those who want to explore a larger urban area while enjoying the tranquility of St. Francisville. | Louisiana State Capitol, Baton Rouge Zoo, USS Kidd, Old State Capitol, River Walk |
| Pecan Grove | A beautiful, quiet neighborhood ideal for family gatherings and longer stays. Close to parks and nature trails, appealing to families and outdoor enthusiasts. | Pecan Grove Park, Nature trails, St. Francisville Town Park, Local wildlife watching, Picnic areas |
| The Myrtles Plantation | Known as one of the most haunted homes in America, this location attracts visitors interested in the paranormal and those seeking a unique stay experience. | The Myrtles Plantation, Haunted tours, Historic gardens, Local folklore, The gift shop |
| Local Wineries | St. Francisville is home to several wineries that attract wine enthusiasts and those looking for romantic getaways in a beautiful setting. | The Franciscan Winery, Paradise Vineyards, Wine tastings, Scenic vineyard views, Gourmet food pairings |
| West Feliciana Parish | Offers a mix of rural charm and local events, attracting guests interested in outdoor activities and local Louisiana culture. | Wildlife Management Areas, Local festivals, Outdoor recreational activities, Fishing spots, Historical landmarks |
| Local Art Scene | St. Francisville hosts a number of local art galleries and cultural events, appealing to art lovers and those seeking unique local experiences. | Local art galleries, Art festivals, Craft markets, Art workshops, Cultural exhibitions |
Understanding Airbnb License Requirements & STR Laws in St. Francisville (2026)
While St. Francisville, Louisiana, United States currently shows low STR regulations, specific Airbnb license requirements might still exist or change. Always verify the latest short term rental regulations and Airbnb license requirements directly with local government authorities for St. Francisville to ensure full compliance before hosting.
(Source: AirROI data, 2026, finding no licensed listings among those analyzed)
Top Performing Airbnb Properties in St. Francisville (2026)
Benchmark your potential! Explore examples of top-performing Airbnb properties in St. Francisvillebased on Trailing Twelve Month (TTM) revenue. Analyze their characteristics, revenue, occupancy rate, and ADR to understand what drives success in this market.
The Hannah House by Louisiana Hospitality Group
Entire Place • 3 bedrooms

Edgewood Cottage
Entire Place • 3 bedrooms

The Sage House by Louisiana Hospitality Group
Entire Place • 3 bedrooms
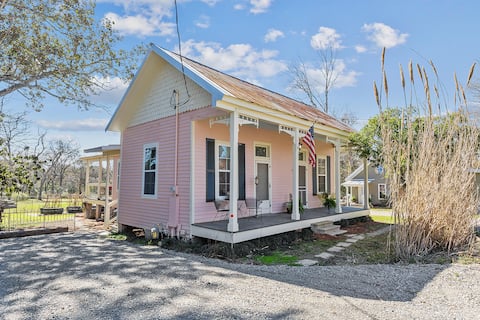
Jasperilla Pink House
Entire Place • 2 bedrooms

Ayres Cottage
Entire Place • 1 bedroom

Rustic cabin
Entire Place • 2 bedrooms
Note: Performance varies based on location, size, amenities, seasonality, and management quality. Data reflects the past 12 months.
Top Performing Airbnb Hosts in St. Francisville (2026)
Learn from the best! This table showcases top-performing Airbnb hosts in St. Francisville based on the number of properties managed and estimated total revenue over the past year. Analyze their scale and performance metrics.
| Host Name | Properties | Grossing Revenue | Stay Reviews | Avg Rating |
|---|---|---|---|---|
| The Saint Francisville Inn | 5 | $195,991 | 19 | 4.92/5.0 |
| Robin | 8 | $163,217 | 1140 | 4.86/5.0 |
| The Myrtles Plantation | 6 | $120,619 | 13 | 4.56/5.0 |
| Brian | 1 | $56,356 | 14 | 4.86/5.0 |
| Charles | 3 | $30,069 | 40 | 4.64/5.0 |
| Wendy | 1 | $2,900 | 1 | Not Rated |
Analyzing the strategies of top hosts, such as their property selection, pricing, and guest communication, can offer valuable lessons for optimizing your own Airbnb operations in St. Francisville.
Dive Deeper: Advanced St. Francisville STR Market Data (2026)
Ready to unlock more insights? AirROI provides access to advanced metrics and comprehensive Airbnb data for St. Francisville. Explore detailed analytics beyond this report to refine your investment strategy, optimize pricing, and maximize your vacation rental profits.
Explore Advanced MetricsSt. Francisville Short-Term Rental Market Composition (2026): Property & Room Types
Room Type Distribution
Property Type Distribution
Market Composition Insights for St. Francisville
- The St. Francisville Airbnb market composition is heavily skewed towards Entire Home/Apt listings, which make up 62.5% of the 24 active rentals. This indicates strong guest preference for privacy and space.
- However, a notable 37.5% share for Private Rooms suggests opportunities for budget-conscious travelers or hosts renting out spare rooms.
- Looking at the property type distribution in St. Francisville, House properties are the most common (41.7%), reflecting the local real estate landscape.
- Houses represent a significant 41.7% portion, catering likely to families or larger groups.
- The presence of 25% Hotel/Boutique listings indicates integration with traditional hospitality.
St. Francisville Airbnb Room Capacity Analysis (2026): Bedroom Distribution
Distribution of Listings by Number of Bedrooms
Room Capacity Insights for St. Francisville
- The dominant room capacity in St. Francisville is 1 bedroom listings, making up 66.7% of the market. This suggests a strong demand for properties suitable for couples or solo travelers.
- Together, 1 bedroom and 2 bedrooms properties represent 83.4% of the active Airbnb listings in St. Francisville, indicating a high concentration in these sizes.
- With over half the market (66.7%) consisting of studios or 1-bedroom units, St. Francisville is particularly well-suited for individuals or couples.
St. Francisville Vacation Rental Guest Capacity Trends (2026)
Distribution of Listings by Guest Capacity
Guest Capacity Insights for St. Francisville
- The most common guest capacity trend in St. Francisville vacation rentals is listings accommodating 2 guests (29.2%). This suggests the primary traveler segment is likely couples or solo travelers.
- Properties designed for 2 guests and 3 guests dominate the St. Francisville STR market, accounting for 54.2% of listings.
- 16.7% of properties accommodate 6+ guests, serving the market segment for larger families or group travel in St. Francisville.
- On average, properties in St. Francisville are equipped to host 3.6 guests.
St. Francisville Airbnb Booking Patterns (2026): Available vs. Booked Days
Available Days Distribution
Booked Days Distribution
Booking Pattern Insights for St. Francisville
- The most common availability pattern in St. Francisville falls within the 271-366 days range, representing 45.8% of listings. This suggests many properties have significant open periods on their calendars.
- Approximately 83.3% of listings show high availability (181+ days open annually), indicating potential for increased bookings or specific owner usage patterns.
- For booked days, the 31-90 days range is most frequent in St. Francisville (37.5%), reflecting common guest stay durations or potential owner blocking patterns.
- A notable 25.0% of properties secure long booking periods (181+ days booked per year), highlighting successful long-term rental strategies or significant owner usage.
St. Francisville Airbnb Minimum Stay Requirements Analysis
Distribution of Listings by Minimum Night Requirement
1 Night
14 listings
58.3% of total
2 Nights
2 listings
8.3% of total
4-6 Nights
1 listings
4.2% of total
30+ Nights
7 listings
29.2% of total
Key Insights
- The most prevalent minimum stay requirement in St. Francisville is 1 Night, adopted by 58.3% of listings. This highlights the market's preference for shorter, flexible bookings.
- A strong majority (66.6%) of the St. Francisville Airbnb data shows acceptance of very short stays (1-2 nights), indicating a dynamic, high-turnover market.
- A significant segment (29.2%) caters to monthly stays (30+ nights) in St. Francisville, pointing to opportunities in the extended-stay market.
Recommendations
- Align with the market by considering a 1 Night minimum stay, as 58.3% of St. Francisville hosts use this setting.
- Explore offering discounts for stays of 30+ nights to attract the 29.2% of the market seeking extended stays.
- Adjust minimum nights based on seasonality – potentially shorter during low season and longer during peak demand periods in St. Francisville.
St. Francisville Airbnb Cancellation Policy Trends Analysis (2026)
Flexible
9 listings
37.5% of total
Moderate
3 listings
12.5% of total
Firm
11 listings
45.8% of total
Strict
1 listings
4.2% of total
Cancellation Policy Insights for St. Francisville
- The prevailing Airbnb cancellation policy trend in St. Francisville is Firm, used by 45.8% of listings.
- There's a relatively balanced mix between guest-friendly (50.0%) and stricter (50.0%) policies, offering choices for different guest needs.
- Strict cancellation policies are quite rare (4.2%), potentially making listings with this policy less competitive unless justified by high demand or property type.
Recommendations for Hosts
- Consider adopting a Firm policy to align with the 45.8% market standard in St. Francisville.
- Using a Strict policy might deter some guests, as only 4.2% of listings use it. Evaluate if potential revenue protection outweighs possible lower booking rates.
- Regularly review your cancellation policy against competitors and market demand shifts in St. Francisville.
St. Francisville STR Booking Lead Time Analysis (2026)
Average Booking Lead Time by Month
Booking Lead Time Insights for St. Francisville
- The overall average booking lead time for vacation rentals in St. Francisville is 82 days.
- Guests book furthest in advance for stays during November (average 124 days), likely coinciding with peak travel demand or local events.
- The shortest booking windows occur for stays in August (average 42 days), indicating more last-minute travel plans during this time.
- Seasonally, Spring (111 days avg.) sees the longest lead times, while Summer (48 days avg.) has the shortest, reflecting typical travel planning cycles.
Recommendations for Hosts
- Use the overall average lead time (82 days) as a baseline for your pricing and availability strategy in St. Francisville.
- For November stays, consider implementing length-of-stay discounts or slightly higher rates for bookings made less than 124 days out to capitalize on advance planning.
- Target marketing efforts for the Spring season well in advance (at least 111 days) to capture early planners.
- Monitor your own booking lead times against these St. Francisville averages to identify opportunities for dynamic pricing adjustments.
Popular & Essential Airbnb Amenities in St. Francisville (2026)
Amenity Prevalence
Amenity Insights for St. Francisville
- Essential amenities in St. Francisville that guests expect include: Free parking on premises, Air conditioning. Lacking these (any) could significantly impact bookings.
- Popular amenities like TV, Shampoo, Heating are common but not universal. Offering these can provide a competitive edge.
- Warning: Wifi is not universally provided but is considered essential globally. Ensure reliable Wifi is offered.
Recommendations for Hosts
- Ensure your listing includes all essential amenities for St. Francisville: Free parking on premises, Air conditioning.
- Consider adding popular differentiators like TV or Shampoo to increase appeal.
- Highlight unique or less common amenities you offer (e.g., hot tub, dedicated workspace, EV charger) in your listing description and photos.
- Regularly check competitor amenities in St. Francisville to stay competitive.
St. Francisville Airbnb Guest Demographics & Profile Analysis (2026)
Guest Profile Summary for St. Francisville
- The typical guest profile for Airbnb in St. Francisville consists of primarily domestic travelers (92%), often arriving from nearby Baton Rouge, typically belonging to the Post-2000s (Gen Z/Alpha) group (50%), primarily speaking English or Spanish.
- Domestic travelers account for 91.7% of guests.
- Key international markets include United States (91.7%) and France (4.2%).
- Top languages spoken are English (69.7%) followed by Spanish (18.2%).
- A significant demographic segment is the Post-2000s (Gen Z/Alpha) group, representing 50% of guests.
Recommendations for Hosts
- Target domestic marketing efforts towards travelers from Baton Rouge and New Orleans.
- Tailor amenities and listing descriptions to appeal to the dominant Post-2000s (Gen Z/Alpha) demographic (e.g., highlight fast WiFi, smart home features, local guides).
- Highlight unique local experiences or amenities relevant to the primary guest profile.
- Consider seasonal promotions aligned with peak travel times for key origin markets.
Nearby Short-Term Rental Market Comparison
How does the St. Francisville Airbnb market stack up against its neighbors? Compare key performance metrics like average monthly revenue, ADR, and occupancy rates in surrounding areas to understand the broader regional STR landscape.
| Market | Active Properties | Monthly Revenue | Daily Rate | Avg. Occupancy |
|---|---|---|---|---|
| New Orleans | 4,857 | $3,260 | $298.03 | 42% |
| Grand Isle | 106 | $3,149 | $432.40 | 32% |
| Killian | 14 | $3,089 | $360.39 | 37% |
| New Roads | 27 | $2,790 | $361.00 | 32% |
| Ponchatoula | 49 | $2,512 | $231.70 | 39% |
| Covington | 65 | $2,427 | $204.72 | 47% |
| St. George | 70 | $2,194 | $231.63 | 40% |
| Gonzales | 37 | $2,142 | $175.66 | 44% |
| Arabi | 65 | $2,113 | $240.25 | 39% |
| Abita Springs | 19 | $2,111 | $189.00 | 42% |