New Orleans Airbnb Market Analysis 2026: Short Term Rental Data & Vacation Rental Statistics in Louisiana, United States
Is Airbnb profitable in New Orleans in 2026? Explore comprehensive Airbnb analytics for New Orleans, Louisiana, United States to uncover income potential. This 2026 STR market report for New Orleans, based on AirROI data from February 2025 to January 2026, reveals key trends in the bustling market of 4,857 active listings.
Whether you're considering an Airbnb investment in New Orleans, optimizing your existing vacation rental, or exploring rental arbitrage opportunities, understanding the New Orleans Airbnb data is crucial. Navigating the high regulation landscape is key to maximizing your short term rental income potential. Let's dive into the specifics.
Key New Orleans Airbnb Performance Metrics Overview
Monthly Airbnb Revenue Variations & Income Potential in New Orleans (2026)
Understanding the monthly revenue variations for Airbnb listings in New Orleans is key to maximizing your short term rental income potential. Seasonality significantly impacts earnings. Our analysis, based on data from the past 12 months, shows that the peak revenue month for STRs in New Orleans is typically February, while August often presents the lowest earnings, highlighting opportunities for strategic pricing adjustments during shoulder and low seasons. Explore the typical Airbnb income in New Orleans across different performance tiers:
- Best-in-class properties (Top 10%) achieve $9,086+ monthly, often utilizing dynamic pricing and superior guest experiences.
- Strong performing properties (Top 25%) earn $5,431 or more, indicating effective management and desirable locations/amenities.
- Typical properties (Median) generate around $3,060 per month, representing the average market performance.
- Entry-level properties (Bottom 25%) see earnings around $1,543, often with potential for optimization.
Average Monthly Airbnb Earnings Trend in New Orleans
New Orleans Airbnb Occupancy Rate Trends (2026)
Maximize your bookings by understanding the New Orleans STR occupancy trends. Seasonal demand shifts significantly influence how often properties are booked. Typically, Marchsees the highest demand (peak season occupancy), while January experiences the lowest (low season). Effective strategies, like adjusting minimum stays or offering promotions, can boost occupancy during slower periods. Here's how different property tiers perform in New Orleans:
- Best-in-class properties (Top 10%) achieve 77%+ occupancy, indicating high desirability and potentially optimized availability.
- Strong performing properties (Top 25%) maintain 62% or higher occupancy, suggesting good market fit and guest satisfaction.
- Typical properties (Median) have an occupancy rate around 43%.
- Entry-level properties (Bottom 25%) average 24% occupancy, potentially facing higher vacancy.
Average Monthly Occupancy Rate Trend in New Orleans
Average Daily Rate (ADR) Airbnb Trends in New Orleans (2026)
Effective short term rental pricing strategy in New Orleans involves understanding monthly ADR fluctuations. The Average Daily Rate (ADR) for Airbnb in New Orleans typically peaks in February and dips lowest during August. Leveraging Airbnb dynamic pricing tools or strategies based on this seasonality can significantly boost revenue. Here's a look at the typical nightly rates achieved:
- Best-in-class properties (Top 10%) command rates of $570+ per night, often due to premium features or locations.
- Strong performing properties (Top 25%) achieve nightly rates of $343 or more.
- Typical properties (Median) charge around $209 per night.
- Entry-level properties (Bottom 25%) earn around $135 per night.
Average Daily Rate (ADR) Trend by Month in New Orleans
Get Live New Orleans Market Intelligence 👇

Explore Real-time Analytics
Airbnb Seasonality Analysis & Trends in New Orleans (2026)
Peak Season (February, March, October)
- Revenue averages $5,508 per month
- Occupancy rates average 51.2%
- Daily rates average $328
Shoulder Season
- Revenue averages $4,275 per month
- Occupancy maintains around 42.8%
- Daily rates hold near $294
Low Season (June, August, September)
- Revenue drops to average $3,047 per month
- Occupancy decreases to average 37.8%
- Daily rates adjust to average $248
Seasonality Insights for New Orleans
- The Airbnb seasonality in New Orleans shows moderate seasonality with distinct peak and low periods. While the sections above show seasonal averages, it's also insightful to look at the extremes:
- During the high season, the absolute peak month showcases New Orleans's highest earning potential, with monthly revenues capable of climbing to $5,808, occupancy reaching a high of 54.3%, and ADRs peaking at $364.
- Conversely, the slowest single month of the year, typically falling within the low season, marks the market's lowest point. In this month, revenue might dip to $2,969, occupancy could drop to 34.2%, and ADRs may adjust down to $240.
- Understanding both the seasonal averages and these monthly peaks and troughs in revenue, occupancy, and ADR is crucial for maximizing your Airbnb profit potential in New Orleans.
Seasonal Strategies for Maximizing Profit
- Peak Season: Maximize revenue through premium pricing and potentially longer minimum stays. Ensure high availability.
- Low Season: Offer competitive pricing, special promotions (e.g., extended stay discounts), and flexible cancellation policies. Target off-season travelers like remote workers or budget-conscious guests.
- Shoulder Seasons: Implement dynamic pricing that balances peak and low rates. Target weekend travelers or specific events. Offer slightly more flexible terms than peak season.
- Regularly analyze your own performance against these New Orleans seasonality benchmarks and adjust your pricing and availability strategy accordingly.
Best Areas for Airbnb Investment in New Orleans (2026)
Exploring the top neighborhoods for short-term rentals in New Orleans? This section highlights key areas, outlining why they are attractive for hosts and guests, along with notable local attractions. Consider these locations based on your target guest profile and investment strategy.
| Neighborhood / Area | Why Host Here? (Target Guests & Appeal) | Key Attractions & Landmarks |
|---|---|---|
| French Quarter | The historic heart of New Orleans, known for its vibrant nightlife, unique architecture, and rich history. A prime location for tourists seeking entertainment, dining, and cultural experiences. | Bourbon Street, Jackson Square, St. Louis Cathedral, French Market, Royal Street, Audubon Aquarium of the Americas |
| Garden District | Famous for its well-preserved antebellum mansions and historic charm. Attracts visitors looking for a picturesque and tranquil neighborhood close to the lively French Quarter. | Magazine Street, Lafayette Cemetery No. 1, The Elms Mansion, Historic mansions, The Columns Hotel, Garden District Book Shop |
| Marigny | Known for its artsy vibe and live music scene, particularly jazz. The Marigny is popular with those looking for a laid-back atmosphere close to the French Quarter. | Frenchmen Street, Bacchanal Fine Wine & Spirits, The Spotted Cat Music Club, The Marigny Opera House, Praline Connection |
| Bywater | An up-and-coming neighborhood known for its colorful houses and artistic community. It attracts young creatives and those looking for a more local experience. | Crescent Park, Brewery Bar, The Maison, The Old 77 Hotel, Art galleries |
| Uptown | A residential area with beautiful parks and historic homes, popular among families and locals. Offers a quieter experience while still being close to attractions. | Audubon Park, Commander’s Palace, Newcomb Art Museum, The Fly, Maple Street |
| Mid-City | A diverse neighborhood with a mix of cultures, known for its local dining scene and access to City Park. It’s becoming increasingly popular with visitors. | City Park, New Orleans Museum of Art, Casino Gaming, Mid-City Market |
| St. Charles Avenue | Famous for its historic streetcar line and stunning mansions, this area attracts visitors looking for classic New Orleans charm and scenery. | Audubon Park, The historic streetcar, Louisiana Historical Center, Rodziak Park, Chalmette Battlefield |
| Broadmoor | A neighborhood known for its community spirit and accessibility, close to downtown. It offers a mix of local flavor and cultural experiences. | Broadmoor Community Center, Gardien de la Nouvelle-Orleans, Crescent City Farmers Market, Morris F.X. Jeff Community Center |
Understanding Airbnb License Requirements & STR Laws in New Orleans (2026)
Yes, New Orleans, Louisiana, United States enforces high STR regulations. Obtaining a license and ensuring compliance is almost certainly required according to current 2026 STR laws. Always verify the latest short term rental regulations and Airbnb license requirements directly with local government authorities for New Orleans to ensure full compliance before hosting.
(Source: AirROI data, 2026, based on 86% licensed listings)
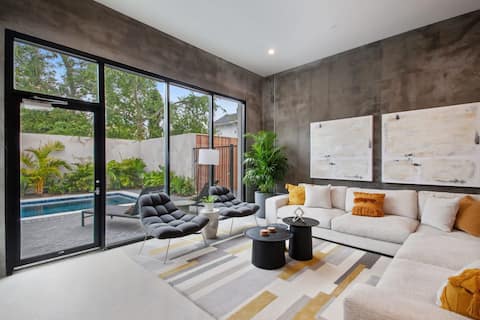
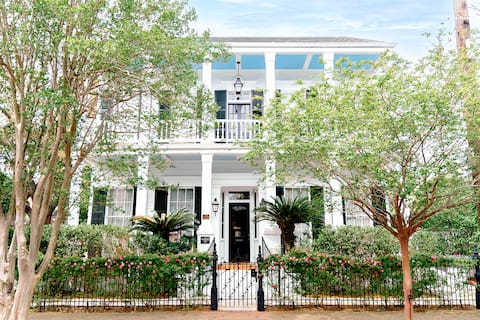
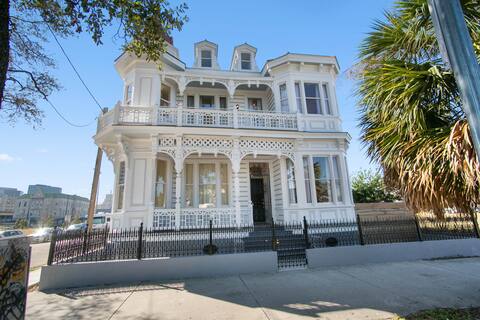
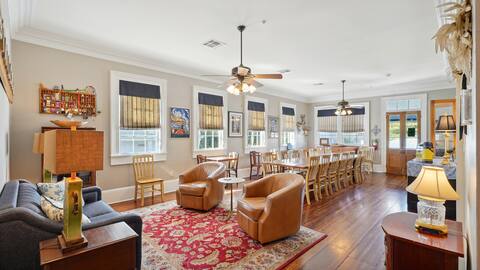
Top Performing Airbnb Properties in New Orleans (2026)
Benchmark your potential! Explore examples of top-performing Airbnb properties in New Orleansbased on Trailing Twelve Month (TTM) revenue. Analyze their characteristics, revenue, occupancy rate, and ADR to understand what drives success in this market.

Maison Grace | Luxurious Redesign with Pool Near F
Entire Place • 9 bedrooms
Claudia Hotel -Unit 5 Sense of Calm and Relaxation
Entire Place • 8 bedrooms
The Mazant: Renovated 1880s Bywater Mansion w/Pool
Entire Place • 8 bedrooms

Boutique 9BR Home with Pool | Steps from French Q
Entire Place • 9 bedrooms
The Orleans House | One of a Kind Historic Landmark w POOL near FQ
Entire Place • 8 bedrooms
Rent entire 9BR/9BA Bed & Breakfast with Pool
Entire Place • 9 bedrooms
Note: Performance varies based on location, size, amenities, seasonality, and management quality. Data reflects the past 12 months.
Top Performing Airbnb Hosts in New Orleans (2026)
Learn from the best! This table showcases top-performing Airbnb hosts in New Orleans based on the number of properties managed and estimated total revenue over the past year. Analyze their scale and performance metrics.
| Host Name | Properties | Grossing Revenue | Stay Reviews | Avg Rating |
|---|---|---|---|---|
| Heirloom | 70 | $7,834,843 | 5132 | 4.86/5.0 |
| New Orleans Luxury Collection | 77 | $5,913,506 | 1592 | 4.93/5.0 |
| David | 68 | $5,111,277 | 7376 | 4.91/5.0 |
| Jordan | 91 | $4,356,686 | 7283 | 4.70/5.0 |
| The Eleanor New Orleans | 44 | $3,713,967 | 777 | 4.83/5.0 |
| Mike | 65 | $3,709,040 | 6676 | 4.76/5.0 |
| Brenna And Nick | 74 | $3,648,444 | 8225 | 4.82/5.0 |
| New Orleans Vacations | 49 | $3,394,730 | 2495 | 4.69/5.0 |
| Nick | 19 | $3,074,104 | 1405 | 4.94/5.0 |
| New Orleans Luxury | 41 | $2,634,876 | 1855 | 4.97/5.0 |
Analyzing the strategies of top hosts, such as their property selection, pricing, and guest communication, can offer valuable lessons for optimizing your own Airbnb operations in New Orleans.
Dive Deeper: Advanced New Orleans STR Market Data (2026)
Ready to unlock more insights? AirROI provides access to advanced metrics and comprehensive Airbnb data for New Orleans. Explore detailed analytics beyond this report to refine your investment strategy, optimize pricing, and maximize your vacation rental profits.
Explore Advanced MetricsNew Orleans Short-Term Rental Market Composition (2026): Property & Room Types
Room Type Distribution
Property Type Distribution
Market Composition Insights for New Orleans
- The New Orleans Airbnb market composition is heavily skewed towards Entire Home/Apt listings, which make up 90.1% of the 4,857 active rentals. This indicates strong guest preference for privacy and space.
- Looking at the property type distribution in New Orleans, House properties are the most common (47%), reflecting the local real estate landscape.
- Houses represent a significant 47% portion, catering likely to families or larger groups.
- The presence of 7.4% Hotel/Boutique listings indicates integration with traditional hospitality.
- Smaller segments like others, unique stays (combined 3.1%) offer potential for unique stay experiences.
New Orleans Airbnb Room Capacity Analysis (2026): Bedroom Distribution
Distribution of Listings by Number of Bedrooms
Room Capacity Insights for New Orleans
- The dominant room capacity in New Orleans is 2 bedrooms listings, making up 28.8% of the market. This suggests a strong demand for properties suitable for couples or solo travelers.
- Together, 2 bedrooms and 1 bedroom properties represent 57.3% of the active Airbnb listings in New Orleans, indicating a high concentration in these sizes.
- A significant 36.1% of listings offer 3+ bedrooms, catering to larger groups and families seeking more space in New Orleans.
New Orleans Vacation Rental Guest Capacity Trends (2026)
Distribution of Listings by Guest Capacity
Guest Capacity Insights for New Orleans
- The most common guest capacity trend in New Orleans vacation rentals is listings accommodating 4 guests (28.1%). This suggests the primary traveler segment is likely small families or groups.
- Properties designed for 4 guests and 2 guests dominate the New Orleans STR market, accounting for 50.0% of listings.
- 40.9% of properties accommodate 6+ guests, serving the market segment for larger families or group travel in New Orleans.
- On average, properties in New Orleans are equipped to host 4.6 guests.
New Orleans Airbnb Booking Patterns (2026): Available vs. Booked Days
Available Days Distribution
Booked Days Distribution
Booking Pattern Insights for New Orleans
- The most common availability pattern in New Orleans falls within the 271-366 days range, representing 41.2% of listings. This suggests many properties have significant open periods on their calendars.
- Approximately 75.7% of listings show high availability (181+ days open annually), indicating potential for increased bookings or specific owner usage patterns.
- For booked days, the 91-180 days range is most frequent in New Orleans (34.8%), reflecting common guest stay durations or potential owner blocking patterns.
- A notable 25.8% of properties secure long booking periods (181+ days booked per year), highlighting successful long-term rental strategies or significant owner usage.
New Orleans Airbnb Minimum Stay Requirements Analysis
Distribution of Listings by Minimum Night Requirement
1 Night
522 listings
10.8% of total
2 Nights
868 listings
17.9% of total
3 Nights
128 listings
2.6% of total
4-6 Nights
230 listings
4.7% of total
7-29 Nights
961 listings
19.8% of total
30+ Nights
2142 listings
44.2% of total
Key Insights
- The most prevalent minimum stay requirement in New Orleans is 30+ Nights, adopted by 44.2% of listings. This highlights the market's preference for longer commitments.
- A significant segment (44.2%) caters to monthly stays (30+ nights) in New Orleans, pointing to opportunities in the extended-stay market.
Recommendations
- Align with the market by considering a 30+ Nights minimum stay, as 44.2% of New Orleans hosts use this setting.
- If feasible, allowing 1-night stays, especially midweek or during low season, could capture last-minute bookings, as only 10.8% currently do.
- Explore offering discounts for stays of 30+ nights to attract the 44.2% of the market seeking extended stays.
- Adjust minimum nights based on seasonality – potentially shorter during low season and longer during peak demand periods in New Orleans.
New Orleans Airbnb Cancellation Policy Trends Analysis (2026)
Refundable
1 listings
0% of total
Super Strict 30 Days
243 listings
5% of total
Limited
66 listings
1.4% of total
Super Strict 60 Days
102 listings
2.1% of total
Flexible
363 listings
7.5% of total
Moderate
843 listings
17.4% of total
Firm
2173 listings
44.9% of total
Strict
1049 listings
21.7% of total
Cancellation Policy Insights for New Orleans
- The prevailing Airbnb cancellation policy trend in New Orleans is Firm, used by 44.9% of listings.
- A majority (66.6%) of hosts in New Orleans utilize Firm or Strict policies, indicating a market where hosts prioritize booking security.
Recommendations for Hosts
- Consider adopting a Firm policy to align with the 44.9% market standard in New Orleans.
- Regularly review your cancellation policy against competitors and market demand shifts in New Orleans.
New Orleans STR Booking Lead Time Analysis (2026)
Average Booking Lead Time by Month
Booking Lead Time Insights for New Orleans
- The overall average booking lead time for vacation rentals in New Orleans is 59 days.
- Guests book furthest in advance for stays during February (average 83 days), likely coinciding with peak travel demand or local events.
- The shortest booking windows occur for stays in June (average 39 days), indicating more last-minute travel plans during this time.
- Seasonally, Spring (66 days avg.) sees the longest lead times, while Summer (43 days avg.) has the shortest, reflecting typical travel planning cycles.
Recommendations for Hosts
- Use the overall average lead time (59 days) as a baseline for your pricing and availability strategy in New Orleans.
- For February stays, consider implementing length-of-stay discounts or slightly higher rates for bookings made less than 83 days out to capitalize on advance planning.
- Target marketing efforts for the Spring season well in advance (at least 66 days) to capture early planners.
- Monitor your own booking lead times against these New Orleans averages to identify opportunities for dynamic pricing adjustments.
Popular & Essential Airbnb Amenities in New Orleans (2026)
Amenity Prevalence
Amenity Insights for New Orleans
- Essential amenities in New Orleans that guests expect include: Air conditioning, Wifi, Heating, TV, Smoke alarm. Lacking these (any) could significantly impact bookings.
- Popular amenities like Hot water, Hair dryer, Coffee maker are common but not universal. Offering these can provide a competitive edge.
Recommendations for Hosts
- Ensure your listing includes all essential amenities for New Orleans: Air conditioning, Wifi, Heating, TV, Smoke alarm.
- Prioritize adding missing essentials: Air conditioning, Wifi, Heating, TV, Smoke alarm.
- Consider adding popular differentiators like Hot water or Hair dryer to increase appeal.
- Highlight unique or less common amenities you offer (e.g., hot tub, dedicated workspace, EV charger) in your listing description and photos.
- Regularly check competitor amenities in New Orleans to stay competitive.
New Orleans Airbnb Guest Demographics & Profile Analysis (2026)
Guest Profile Summary for New Orleans
- The typical guest profile for Airbnb in New Orleans consists of primarily domestic travelers (93%), often arriving from nearby New York, typically belonging to the Post-2000s (Gen Z/Alpha) group (50%), primarily speaking English or Spanish.
- Domestic travelers account for 93.2% of guests.
- Key international markets include United States (93.2%) and United Kingdom (1.3%).
- Top languages spoken are English (69.7%) followed by Spanish (13.9%).
- A significant demographic segment is the Post-2000s (Gen Z/Alpha) group, representing 50% of guests.
Recommendations for Hosts
- Target domestic marketing efforts towards travelers from New York and Houston.
- Tailor amenities and listing descriptions to appeal to the dominant Post-2000s (Gen Z/Alpha) demographic (e.g., highlight fast WiFi, smart home features, local guides).
- Highlight unique local experiences or amenities relevant to the primary guest profile.
- Consider seasonal promotions aligned with peak travel times for key origin markets.
Nearby Short-Term Rental Market Comparison
How does the New Orleans Airbnb market stack up against its neighbors? Compare key performance metrics like average monthly revenue, ADR, and occupancy rates in surrounding areas to understand the broader regional STR landscape.
| Market | Active Properties | Monthly Revenue | Daily Rate | Avg. Occupancy |
|---|---|---|---|---|
| Plaquemines Parish | 28 | $4,733 | $413.26 | 40% |
| Grand Isle | 106 | $3,149 | $432.40 | 32% |
| Killian | 14 | $3,089 | $360.39 | 37% |
| New Roads | 27 | $2,790 | $361.00 | 32% |
| Pass Christian | 179 | $2,762 | $294.40 | 36% |
| Ponchatoula | 49 | $2,512 | $231.70 | 39% |
| Bay Saint Louis | 286 | $2,488 | $265.09 | 35% |
| Covington | 65 | $2,427 | $204.72 | 47% |
| Kiln | 16 | $2,289 | $221.81 | 41% |
| Waveland | 85 | $2,281 | $234.34 | 37% |