Natchitoches Airbnb Market Analysis 2026: Short Term Rental Data & Vacation Rental Statistics in Louisiana, United States
Is Airbnb profitable in Natchitoches in 2026? Explore comprehensive Airbnb analytics for Natchitoches, Louisiana, United States to uncover income potential. This 2026 STR market report for Natchitoches, based on AirROI data from February 2025 to January 2026, reveals key trends in the niche market of 80 active listings.
Whether you're considering an Airbnb investment in Natchitoches, optimizing your existing vacation rental, or exploring rental arbitrage opportunities, understanding the Natchitoches Airbnb data is crucial. Leveraging the low regulation environment is key to maximizing your short term rental income potential. Let's dive into the specifics.
Key Natchitoches Airbnb Performance Metrics Overview
Monthly Airbnb Revenue Variations & Income Potential in Natchitoches (2026)
Understanding the monthly revenue variations for Airbnb listings in Natchitoches is key to maximizing your short term rental income potential. Seasonality significantly impacts earnings. Our analysis, based on data from the past 12 months, shows that the peak revenue month for STRs in Natchitoches is typically December, while September often presents the lowest earnings, highlighting opportunities for strategic pricing adjustments during shoulder and low seasons. Explore the typical Airbnb income in Natchitoches across different performance tiers:
- Best-in-class properties (Top 10%) achieve $6,351+ monthly, often utilizing dynamic pricing and superior guest experiences.
- Strong performing properties (Top 25%) earn $4,040 or more, indicating effective management and desirable locations/amenities.
- Typical properties (Median) generate around $2,346 per month, representing the average market performance.
- Entry-level properties (Bottom 25%) see earnings around $1,305, often with potential for optimization.
Average Monthly Airbnb Earnings Trend in Natchitoches
Natchitoches Airbnb Occupancy Rate Trends (2026)
Maximize your bookings by understanding the Natchitoches STR occupancy trends. Seasonal demand shifts significantly influence how often properties are booked. Typically, Decembersees the highest demand (peak season occupancy), while September experiences the lowest (low season). Effective strategies, like adjusting minimum stays or offering promotions, can boost occupancy during slower periods. Here's how different property tiers perform in Natchitoches:
- Best-in-class properties (Top 10%) achieve 64%+ occupancy, indicating high desirability and potentially optimized availability.
- Strong performing properties (Top 25%) maintain 47% or higher occupancy, suggesting good market fit and guest satisfaction.
- Typical properties (Median) have an occupancy rate around 30%.
- Entry-level properties (Bottom 25%) average 16% occupancy, potentially facing higher vacancy.
Average Monthly Occupancy Rate Trend in Natchitoches
Average Daily Rate (ADR) Airbnb Trends in Natchitoches (2026)
Effective short term rental pricing strategy in Natchitoches involves understanding monthly ADR fluctuations. The Average Daily Rate (ADR) for Airbnb in Natchitoches typically peaks in December and dips lowest during April. Leveraging Airbnb dynamic pricing tools or strategies based on this seasonality can significantly boost revenue. Here's a look at the typical nightly rates achieved:
- Best-in-class properties (Top 10%) command rates of $566+ per night, often due to premium features or locations.
- Strong performing properties (Top 25%) achieve nightly rates of $391 or more.
- Typical properties (Median) charge around $241 per night.
- Entry-level properties (Bottom 25%) earn around $170 per night.
Average Daily Rate (ADR) Trend by Month in Natchitoches
Get Live Natchitoches Market Intelligence 👇

Explore Real-time Analytics
Airbnb Seasonality Analysis & Trends in Natchitoches (2026)
Peak Season (December, November, March)
- Revenue averages $4,056 per month
- Occupancy rates average 42.1%
- Daily rates average $310
Shoulder Season
- Revenue averages $2,896 per month
- Occupancy maintains around 33.6%
- Daily rates hold near $291
Low Season (January, June, September)
- Revenue drops to average $2,219 per month
- Occupancy decreases to average 26.8%
- Daily rates adjust to average $298
Seasonality Insights for Natchitoches
- The Airbnb seasonality in Natchitoches shows highly seasonal trends requiring careful strategy. While the sections above show seasonal averages, it's also insightful to look at the extremes:
- During the high season, the absolute peak month showcases Natchitoches's highest earning potential, with monthly revenues capable of climbing to $4,943, occupancy reaching a high of 46.8%, and ADRs peaking at $335.
- Conversely, the slowest single month of the year, typically falling within the low season, marks the market's lowest point. In this month, revenue might dip to $1,886, occupancy could drop to 23.4%, and ADRs may adjust down to $279.
- Understanding both the seasonal averages and these monthly peaks and troughs in revenue, occupancy, and ADR is crucial for maximizing your Airbnb profit potential in Natchitoches.
Seasonal Strategies for Maximizing Profit
- Peak Season: Maximize revenue through premium pricing and potentially longer minimum stays. Ensure high availability.
- Low Season: Offer competitive pricing, special promotions (e.g., extended stay discounts), and flexible cancellation policies. Target off-season travelers like remote workers or budget-conscious guests.
- Shoulder Seasons: Implement dynamic pricing that balances peak and low rates. Target weekend travelers or specific events. Offer slightly more flexible terms than peak season.
- Regularly analyze your own performance against these Natchitoches seasonality benchmarks and adjust your pricing and availability strategy accordingly.
Best Areas for Airbnb Investment in Natchitoches (2026)
Exploring the top neighborhoods for short-term rentals in Natchitoches? This section highlights key areas, outlining why they are attractive for hosts and guests, along with notable local attractions. Consider these locations based on your target guest profile and investment strategy.
| Neighborhood / Area | Why Host Here? (Target Guests & Appeal) | Key Attractions & Landmarks |
|---|---|---|
| Historic District | A charming area known for its well-preserved architecture and rich history, attracting visitors interested in culture and heritage. | Natchitoches Historic District, Cane River Creole National Historical Park, Fort St. Jean Baptiste State Historic Site, Natchitoches Landmark Historic District, Riverfront Park |
| NSU Area | Proximity to Northwestern State University makes this area popular with students, families, and visitors attending university events and activities. | Northwestern State University, Prudhomme-Rouquier House, Cane River Green Market, Natchitoches Events Center, Cultural District |
| Riverfront | Offers beautiful views of the Cane River and is a perfect spot for leisurely strolls and outdoor activities, appealing to tourists seeking relaxation. | Cane River Lake, Riverfront Park, Natchitoches Riverwalk, Annual Christmas Festival, Historic Landmarks |
| Cultural District | A vibrant area that showcases Natchitoches' arts and cultural heritage, ideal for art lovers and those seeking local crafts and food. | Natchitoches Art Guild, Local galleries, Art and Wine Festival, Historic Natchitoches Theater, Theatre de la Rue |
| Natchitoches French Market | A lively market area with a mix of local vendors and eateries, drawing in tourists looking for local flavors and unique shopping experiences. | Natchitoches French Market, Local restaurants, Seasonal festivals, Craft fairs, Live music events |
| Plantation Country | Explore the nearby plantations for a taste of Southern history and hospitality, attracting tourists who want a glimpse into Louisiana's past. | Melrose Plantation, Clemson Plantation, Magnolia Plantation, Historic plantation tours, Louisiana State Museum |
| Food District | Known for its delicious Cajun and Creole cuisine, this area attracts food enthusiasts and tourists eager to experience local flavors. | Local restaurants, Annual Food Festivals, Cooking classes, Cajun music events, Farm-to-table markets |
| Urban Lake Area | Natural beauty and recreational activities along the lake attract families and outdoor enthusiasts looking for adventure and relaxation. | Lake Natchitoches, Fishing and boating, Picnic areas, Nature trails, Camping facilities |
Understanding Airbnb License Requirements & STR Laws in Natchitoches (2026)
While Natchitoches, Louisiana, United States currently shows low STR regulations, specific Airbnb license requirements might still exist or change. Always verify the latest short term rental regulations and Airbnb license requirements directly with local government authorities for Natchitoches to ensure full compliance before hosting.
(Source: AirROI data, 2026, based on 3% licensed listings)
Top Performing Airbnb Properties in Natchitoches (2026)
Benchmark your potential! Explore examples of top-performing Airbnb properties in Natchitochesbased on Trailing Twelve Month (TTM) revenue. Analyze their characteristics, revenue, occupancy rate, and ADR to understand what drives success in this market.

City View on the Cane
Entire Place • 3 bedrooms
Downtown Riverside Oasis: Deck, Hot Tub & More!
Entire Place • 3 bedrooms

Cane River Living Downtown I Historic District
Entire Place • 5 bedrooms
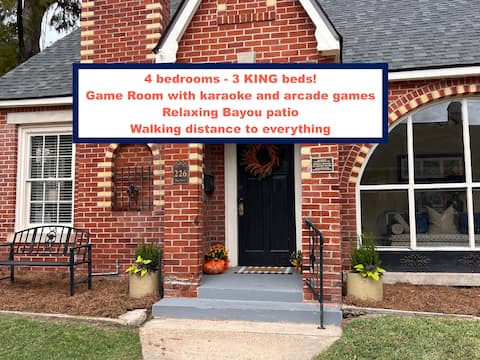
4 bedrooms! Walk Everywhere! Relaxing Patio!
Entire Place • 4 bedrooms

The Sadie - Natchitoches Historic District
Entire Place • 4 bedrooms

The Perrault House - Circa 1911 - Pecan Plantation
Entire Place • 5 bedrooms
Note: Performance varies based on location, size, amenities, seasonality, and management quality. Data reflects the past 12 months.
Top Performing Airbnb Hosts in Natchitoches (2026)
Learn from the best! This table showcases top-performing Airbnb hosts in Natchitoches based on the number of properties managed and estimated total revenue over the past year. Analyze their scale and performance metrics.
| Host Name | Properties | Grossing Revenue | Stay Reviews | Avg Rating |
|---|---|---|---|---|
| Janice | 4 | $152,149 | 379 | 4.98/5.0 |
| Nissi | 10 | $126,421 | 80 | 4.94/5.0 |
| Andrea | 2 | $101,683 | 288 | 4.92/5.0 |
| Catherine Christy | 1 | $96,435 | 12 | 4.92/5.0 |
| Vevalyn | 3 | $90,033 | 23 | 5.00/5.0 |
| Kristen | 3 | $89,955 | 66 | 4.93/5.0 |
| Michael | 2 | $74,856 | 178 | 4.96/5.0 |
| Andy | 1 | $71,881 | 49 | 4.98/5.0 |
| Laurie | 1 | $71,553 | 32 | 4.91/5.0 |
| Denise | 1 | $64,104 | 111 | 4.96/5.0 |
Analyzing the strategies of top hosts, such as their property selection, pricing, and guest communication, can offer valuable lessons for optimizing your own Airbnb operations in Natchitoches.
Dive Deeper: Advanced Natchitoches STR Market Data (2026)
Ready to unlock more insights? AirROI provides access to advanced metrics and comprehensive Airbnb data for Natchitoches. Explore detailed analytics beyond this report to refine your investment strategy, optimize pricing, and maximize your vacation rental profits.
Explore Advanced MetricsNatchitoches Short-Term Rental Market Composition (2026): Property & Room Types
Room Type Distribution
Property Type Distribution
Market Composition Insights for Natchitoches
- The Natchitoches Airbnb market composition is heavily skewed towards Entire Home/Apt listings, which make up 78.8% of the 80 active rentals. This indicates strong guest preference for privacy and space.
- Looking at the property type distribution in Natchitoches, House properties are the most common (62.5%), reflecting the local real estate landscape.
- Houses represent a significant 62.5% portion, catering likely to families or larger groups.
- The presence of 25% Hotel/Boutique listings indicates integration with traditional hospitality.
Natchitoches Airbnb Room Capacity Analysis (2026): Bedroom Distribution
Distribution of Listings by Number of Bedrooms
Room Capacity Insights for Natchitoches
- The dominant room capacity in Natchitoches is 3 bedrooms listings, making up 25% of the market. This suggests a strong demand for properties suitable for families or small groups.
- Together, 3 bedrooms and 2 bedrooms properties represent 43.8% of the active Airbnb listings in Natchitoches, indicating a high concentration in these sizes.
- A significant 46.3% of listings offer 3+ bedrooms, catering to larger groups and families seeking more space in Natchitoches.
Natchitoches Vacation Rental Guest Capacity Trends (2026)
Distribution of Listings by Guest Capacity
Guest Capacity Insights for Natchitoches
- The most common guest capacity trend in Natchitoches vacation rentals is listings accommodating 8+ guests (28.7%). This suggests the primary traveler segment is likely larger groups.
- Properties designed for 8+ guests and 6 guests dominate the Natchitoches STR market, accounting for 47.5% of listings.
- 51.3% of properties accommodate 6+ guests, serving the market segment for larger families or group travel in Natchitoches.
- On average, properties in Natchitoches are equipped to host 4.7 guests.
Natchitoches Airbnb Booking Patterns (2026): Available vs. Booked Days
Available Days Distribution
Booked Days Distribution
Booking Pattern Insights for Natchitoches
- The most common availability pattern in Natchitoches falls within the 271-366 days range, representing 50% of listings. This suggests many properties have significant open periods on their calendars.
- Approximately 93.8% of listings show high availability (181+ days open annually), indicating potential for increased bookings or specific owner usage patterns.
- For booked days, the 91-180 days range is most frequent in Natchitoches (45%), reflecting common guest stay durations or potential owner blocking patterns.
- A notable 8.8% of properties secure long booking periods (181+ days booked per year), highlighting successful long-term rental strategies or significant owner usage.
Natchitoches Airbnb Minimum Stay Requirements Analysis
Distribution of Listings by Minimum Night Requirement
1 Night
27 listings
33.8% of total
2 Nights
26 listings
32.5% of total
3 Nights
1 listings
1.3% of total
4-6 Nights
1 listings
1.3% of total
30+ Nights
25 listings
31.3% of total
Key Insights
- The most prevalent minimum stay requirement in Natchitoches is 1 Night, adopted by 33.8% of listings. This highlights the market's preference for shorter, flexible bookings.
- A strong majority (66.3%) of the Natchitoches Airbnb data shows acceptance of very short stays (1-2 nights), indicating a dynamic, high-turnover market.
- A significant segment (31.3%) caters to monthly stays (30+ nights) in Natchitoches, pointing to opportunities in the extended-stay market.
Recommendations
- Align with the market by considering a 1 Night minimum stay, as 33.8% of Natchitoches hosts use this setting.
- Explore offering discounts for stays of 30+ nights to attract the 31.3% of the market seeking extended stays.
- Adjust minimum nights based on seasonality – potentially shorter during low season and longer during peak demand periods in Natchitoches.
Natchitoches Airbnb Cancellation Policy Trends Analysis (2026)
Super Strict 60 Days
10 listings
12.5% of total
Limited
2 listings
2.5% of total
Flexible
14 listings
17.5% of total
Moderate
13 listings
16.3% of total
Firm
33 listings
41.3% of total
Strict
8 listings
10% of total
Cancellation Policy Insights for Natchitoches
- The prevailing Airbnb cancellation policy trend in Natchitoches is Firm, used by 41.3% of listings.
- A majority (51.3%) of hosts in Natchitoches utilize Firm or Strict policies, indicating a market where hosts prioritize booking security.
Recommendations for Hosts
- Consider adopting a Firm policy to align with the 41.3% market standard in Natchitoches.
- Using a Strict policy might deter some guests, as only 10% of listings use it. Evaluate if potential revenue protection outweighs possible lower booking rates.
- Regularly review your cancellation policy against competitors and market demand shifts in Natchitoches.
Natchitoches STR Booking Lead Time Analysis (2026)
Average Booking Lead Time by Month
Booking Lead Time Insights for Natchitoches
- The overall average booking lead time for vacation rentals in Natchitoches is 69 days.
- Guests book furthest in advance for stays during December (average 129 days), likely coinciding with peak travel demand or local events.
- The shortest booking windows occur for stays in February (average 22 days), indicating more last-minute travel plans during this time.
- Seasonally, Fall (79 days avg.) sees the longest lead times, while Summer (41 days avg.) has the shortest, reflecting typical travel planning cycles.
Recommendations for Hosts
- Use the overall average lead time (69 days) as a baseline for your pricing and availability strategy in Natchitoches.
- For December stays, consider implementing length-of-stay discounts or slightly higher rates for bookings made less than 129 days out to capitalize on advance planning.
- Target marketing efforts for the Fall season well in advance (at least 79 days) to capture early planners.
- Monitor your own booking lead times against these Natchitoches averages to identify opportunities for dynamic pricing adjustments.
Popular & Essential Airbnb Amenities in Natchitoches (2026)
Amenity Prevalence
Amenity Insights for Natchitoches
- Essential amenities in Natchitoches that guests expect include: Free parking on premises, TV, Wifi, Heating, Air conditioning. Lacking these (any) could significantly impact bookings.
- Popular amenities like Hot water, Bed linens, Essentials are common but not universal. Offering these can provide a competitive edge.
Recommendations for Hosts
- Ensure your listing includes all essential amenities for Natchitoches: Free parking on premises, TV, Wifi, Heating, Air conditioning.
- Prioritize adding missing essentials: Wifi, Heating, Air conditioning.
- Consider adding popular differentiators like Hot water or Bed linens to increase appeal.
- Highlight unique or less common amenities you offer (e.g., hot tub, dedicated workspace, EV charger) in your listing description and photos.
- Regularly check competitor amenities in Natchitoches to stay competitive.
Natchitoches Airbnb Guest Demographics & Profile Analysis (2026)
Guest Profile Summary for Natchitoches
- The typical guest profile for Airbnb in Natchitoches consists of primarily domestic travelers (97%), often arriving from nearby Houston, typically belonging to the Post-2000s (Gen Z/Alpha) group (50%), primarily speaking English or Spanish.
- Domestic travelers account for 97.3% of guests.
- Key international markets include United States (97.3%) and France (1.3%).
- Top languages spoken are English (83.5%) followed by Spanish (11.2%).
- A significant demographic segment is the Post-2000s (Gen Z/Alpha) group, representing 50% of guests.
Recommendations for Hosts
- Target domestic marketing efforts towards travelers from Houston and Baton Rouge.
- Tailor amenities and listing descriptions to appeal to the dominant Post-2000s (Gen Z/Alpha) demographic (e.g., highlight fast WiFi, smart home features, local guides).
- Highlight unique local experiences or amenities relevant to the primary guest profile.
- Consider seasonal promotions aligned with peak travel times for key origin markets.
Nearby Short-Term Rental Market Comparison
How does the Natchitoches Airbnb market stack up against its neighbors? Compare key performance metrics like average monthly revenue, ADR, and occupancy rates in surrounding areas to understand the broader regional STR landscape.
| Market | Active Properties | Monthly Revenue | Daily Rate | Avg. Occupancy |
|---|---|---|---|---|
| Jonesboro | 11 | $2,988 | $229.32 | 42% |
| Gladewater | 15 | $2,975 | $313.40 | 34% |
| Milam | 12 | $2,955 | $346.16 | 41% |
| Homer | 11 | $2,891 | $236.92 | 40% |
| Lumberton | 20 | $2,377 | $230.17 | 35% |
| Brookeland | 56 | $2,363 | $289.67 | 33% |
| Chatham | 10 | $2,339 | $187.26 | 46% |
| Karnack | 50 | $2,334 | $220.13 | 37% |
| Zwolle | 31 | $2,297 | $248.16 | 30% |
| Farmerville | 28 | $2,279 | $196.18 | 40% |