Lake Charles Airbnb Market Analysis 2026: Short Term Rental Data & Vacation Rental Statistics in Louisiana, United States
Is Airbnb profitable in Lake Charles in 2026? Explore comprehensive Airbnb analytics for Lake Charles, Louisiana, United States to uncover income potential. This 2026 STR market report for Lake Charles, based on AirROI data from February 2025 to January 2026, reveals key trends in the market of 320 active listings.
Whether you're considering an Airbnb investment in Lake Charles, optimizing your existing vacation rental, or exploring rental arbitrage opportunities, understanding the Lake Charles Airbnb data is crucial. Leveraging the low regulation environment is key to maximizing your short term rental income potential. Let's dive into the specifics.
Key Lake Charles Airbnb Performance Metrics Overview
Monthly Airbnb Revenue Variations & Income Potential in Lake Charles (2026)
Understanding the monthly revenue variations for Airbnb listings in Lake Charles is key to maximizing your short term rental income potential. Seasonality significantly impacts earnings. Our analysis, based on data from the past 12 months, shows that the peak revenue month for STRs in Lake Charles is typically July, while February often presents the lowest earnings, highlighting opportunities for strategic pricing adjustments during shoulder and low seasons. Explore the typical Airbnb income in Lake Charles across different performance tiers:
- Best-in-class properties (Top 10%) achieve $4,456+ monthly, often utilizing dynamic pricing and superior guest experiences.
- Strong performing properties (Top 25%) earn $3,010 or more, indicating effective management and desirable locations/amenities.
- Typical properties (Median) generate around $1,942 per month, representing the average market performance.
- Entry-level properties (Bottom 25%) see earnings around $1,006, often with potential for optimization.
Average Monthly Airbnb Earnings Trend in Lake Charles
Lake Charles Airbnb Occupancy Rate Trends (2026)
Maximize your bookings by understanding the Lake Charles STR occupancy trends. Seasonal demand shifts significantly influence how often properties are booked. Typically, Marchsees the highest demand (peak season occupancy), while January experiences the lowest (low season). Effective strategies, like adjusting minimum stays or offering promotions, can boost occupancy during slower periods. Here's how different property tiers perform in Lake Charles:
- Best-in-class properties (Top 10%) achieve 81%+ occupancy, indicating high desirability and potentially optimized availability.
- Strong performing properties (Top 25%) maintain 63% or higher occupancy, suggesting good market fit and guest satisfaction.
- Typical properties (Median) have an occupancy rate around 43%.
- Entry-level properties (Bottom 25%) average 24% occupancy, potentially facing higher vacancy.
Average Monthly Occupancy Rate Trend in Lake Charles
Average Daily Rate (ADR) Airbnb Trends in Lake Charles (2026)
Effective short term rental pricing strategy in Lake Charles involves understanding monthly ADR fluctuations. The Average Daily Rate (ADR) for Airbnb in Lake Charles typically peaks in December and dips lowest during April. Leveraging Airbnb dynamic pricing tools or strategies based on this seasonality can significantly boost revenue. Here's a look at the typical nightly rates achieved:
- Best-in-class properties (Top 10%) command rates of $275+ per night, often due to premium features or locations.
- Strong performing properties (Top 25%) achieve nightly rates of $187 or more.
- Typical properties (Median) charge around $134 per night.
- Entry-level properties (Bottom 25%) earn around $96 per night.
Average Daily Rate (ADR) Trend by Month in Lake Charles
Get Live Lake Charles Market Intelligence 👇

Explore Real-time Analytics
Airbnb Seasonality Analysis & Trends in Lake Charles (2026)
Peak Season (July, October, August)
- Revenue averages $2,698 per month
- Occupancy rates average 47.0%
- Daily rates average $165
Shoulder Season
- Revenue averages $2,392 per month
- Occupancy maintains around 45.0%
- Daily rates hold near $163
Low Season (January, February, April)
- Revenue drops to average $2,004 per month
- Occupancy decreases to average 41.9%
- Daily rates adjust to average $156
Seasonality Insights for Lake Charles
- The Airbnb seasonality in Lake Charles shows moderate seasonality with distinct peak and low periods. While the sections above show seasonal averages, it's also insightful to look at the extremes:
- During the high season, the absolute peak month showcases Lake Charles's highest earning potential, with monthly revenues capable of climbing to $2,732, occupancy reaching a high of 52.4%, and ADRs peaking at $174.
- Conversely, the slowest single month of the year, typically falling within the low season, marks the market's lowest point. In this month, revenue might dip to $1,942, occupancy could drop to 36.6%, and ADRs may adjust down to $146.
- Understanding both the seasonal averages and these monthly peaks and troughs in revenue, occupancy, and ADR is crucial for maximizing your Airbnb profit potential in Lake Charles.
Seasonal Strategies for Maximizing Profit
- Peak Season: Maximize revenue through premium pricing and potentially longer minimum stays. Ensure high availability.
- Low Season: Offer competitive pricing, special promotions (e.g., extended stay discounts), and flexible cancellation policies. Target off-season travelers like remote workers or budget-conscious guests.
- Shoulder Seasons: Implement dynamic pricing that balances peak and low rates. Target weekend travelers or specific events. Offer slightly more flexible terms than peak season.
- Regularly analyze your own performance against these Lake Charles seasonality benchmarks and adjust your pricing and availability strategy accordingly.
Best Areas for Airbnb Investment in Lake Charles (2026)
Exploring the top neighborhoods for short-term rentals in Lake Charles? This section highlights key areas, outlining why they are attractive for hosts and guests, along with notable local attractions. Consider these locations based on your target guest profile and investment strategy.
| Neighborhood / Area | Why Host Here? (Target Guests & Appeal) | Key Attractions & Landmarks |
|---|---|---|
| Lakefront District | A popular area near Lake Charles, known for its scenic views and access to water activities. It's a peaceful retreat for families and vacationers alike, making it ideal for Airbnb hosting. | Lake Charles, Prien Lake Park, Sparrow Park, Lake Charles Civic Center, North Beach |
| Downtown Lake Charles | The cultural and entertainment hub of the city featuring restaurants, bars, and events. It attracts both tourists and business travelers, providing a great opportunity for Airbnb hosting. | Millennium Park, Lake Charles Historic District, Imperial Calcasieu Museum, Civic Center","Charlie's Place |
| Historic Garden District | Known for its stunning architecture and tree-lined streets, this area is attractive to visitors seeking a charming and picturesque setting for their stay. | Historic homes, Frasch Park, Hodges Gardens, Bord du Lac Park, Calcasieu Parish Courthouse |
| Prien Lake Area | Offers a suburban feel with shopping, dining, and proximity to the lake. It's a favorite for families and those looking for longer stays. | Prien Lake Mall, Restaurants, North Beach, Regional Airport, Golf Courses |
| Contraband Bayou | A tranquil neighborhood known for its waterfront properties and natural landscapes, perfect for nature lovers and those seeking peace away from the city center. | Contraband Bayou, Golf Courses, Kayaking Routes, Nature Trails, Wildlife Watching |
| Southwest Lake Charles | An emerging area attracting visitors due to its mix of residential conveniences and local attractions; it's a growing destination for short-term rentals. | Local restaurants, Parks, Nearby shopping centers, Recreation areas, Live music venues |
| Big Lake | A more rural area that offers fishing and hunting, ideal for visitors looking for outdoor activities and escape from city life. | Big Lake, Fishing spots, Hunting grounds, Nature trails, Outdoor campsites |
| Westlake | Just outside of Lake Charles, Westlake offers a quieter option for stays while still being close to the attractions of the city. A great place for families and group stays. | Westlake Village, Local parks, Nearby golf courses, Community events, Convenient access to Lake Charles |
Understanding Airbnb License Requirements & STR Laws in Lake Charles (2026)
While Lake Charles, Louisiana, United States currently shows low STR regulations, specific Airbnb license requirements might still exist or change. Always verify the latest short term rental regulations and Airbnb license requirements directly with local government authorities for Lake Charles to ensure full compliance before hosting.
(Source: AirROI data, 2026, finding no licensed listings among those analyzed)
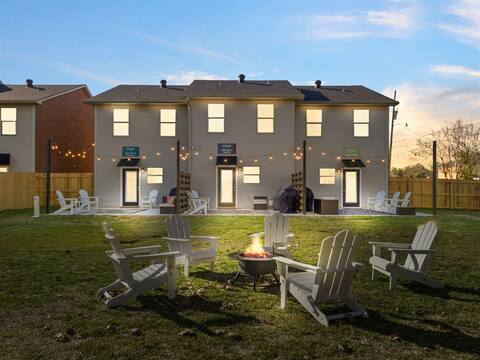
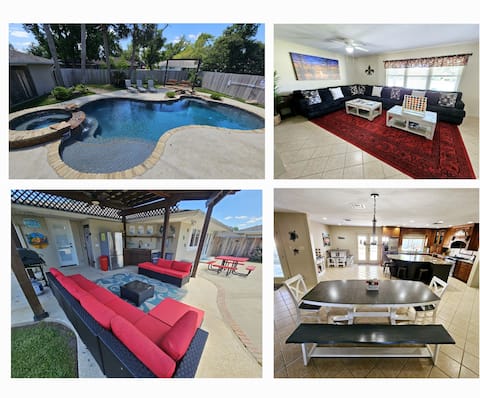
Top Performing Airbnb Properties in Lake Charles (2026)
Benchmark your potential! Explore examples of top-performing Airbnb properties in Lake Charlesbased on Trailing Twelve Month (TTM) revenue. Analyze their characteristics, revenue, occupancy rate, and ADR to understand what drives success in this market.

Doc's - 10,000 sq ft of Louisiana Luxury
Entire Place • 8 bedrooms
Big Fam Lodge | Near Casinos & Golf | Sleeps 24
Entire Place • 6 bedrooms

Skylines : Stunning New Luxury Home.
Entire Place • 5 bedrooms
Poolside Triple Suite Retreat
Entire Place • 3 bedrooms

4 Bedroom Home with Pool
Entire Place • 4 bedrooms

The Onyx Bungalow | 6 Bedrooms | 5 mins to Casino
Entire Place • 6 bedrooms
Note: Performance varies based on location, size, amenities, seasonality, and management quality. Data reflects the past 12 months.
Top Performing Airbnb Hosts in Lake Charles (2026)
Learn from the best! This table showcases top-performing Airbnb hosts in Lake Charles based on the number of properties managed and estimated total revenue over the past year. Analyze their scale and performance metrics.
| Host Name | Properties | Grossing Revenue | Stay Reviews | Avg Rating |
|---|---|---|---|---|
| Kay Property Management | 27 | $863,951 | 1259 | 4.75/5.0 |
| Cade And Lynette | 4 | $252,983 | 511 | 4.96/5.0 |
| Michelle | 3 | $230,982 | 149 | 4.98/5.0 |
| Rusty | 10 | $216,201 | 314 | 4.75/5.0 |
| David | 9 | $201,350 | 477 | 4.94/5.0 |
| Candice-Rent It Like A Saint | 10 | $184,453 | 172 | 5.00/5.0 |
| Mark | 1 | $180,540 | 94 | 4.89/5.0 |
| Mark | 9 | $150,869 | 579 | 4.76/5.0 |
| Carlos E | 2 | $148,709 | 140 | 4.97/5.0 |
| Dan | 7 | $115,235 | 260 | 4.81/5.0 |
Analyzing the strategies of top hosts, such as their property selection, pricing, and guest communication, can offer valuable lessons for optimizing your own Airbnb operations in Lake Charles.
Dive Deeper: Advanced Lake Charles STR Market Data (2026)
Ready to unlock more insights? AirROI provides access to advanced metrics and comprehensive Airbnb data for Lake Charles. Explore detailed analytics beyond this report to refine your investment strategy, optimize pricing, and maximize your vacation rental profits.
Explore Advanced MetricsLake Charles Short-Term Rental Market Composition (2026): Property & Room Types
Room Type Distribution
Property Type Distribution
Market Composition Insights for Lake Charles
- The Lake Charles Airbnb market composition is heavily skewed towards Entire Home/Apt listings, which make up 94.4% of the 320 active rentals. This indicates strong guest preference for privacy and space.
- Looking at the property type distribution in Lake Charles, House properties are the most common (73.1%), reflecting the local real estate landscape.
- Houses represent a significant 73.1% portion, catering likely to families or larger groups.
- Smaller segments like hotel/boutique, others, unique stays, outdoor/unique (combined 4.1%) offer potential for unique stay experiences.
Lake Charles Airbnb Room Capacity Analysis (2026): Bedroom Distribution
Distribution of Listings by Number of Bedrooms
Room Capacity Insights for Lake Charles
- The dominant room capacity in Lake Charles is 3 bedrooms listings, making up 35.6% of the market. This suggests a strong demand for properties suitable for families or small groups.
- Together, 3 bedrooms and 2 bedrooms properties represent 58.1% of the active Airbnb listings in Lake Charles, indicating a high concentration in these sizes.
- A significant 51.6% of listings offer 3+ bedrooms, catering to larger groups and families seeking more space in Lake Charles.
Lake Charles Vacation Rental Guest Capacity Trends (2026)
Distribution of Listings by Guest Capacity
Guest Capacity Insights for Lake Charles
- The most common guest capacity trend in Lake Charles vacation rentals is listings accommodating 8+ guests (23.8%). This suggests the primary traveler segment is likely larger groups.
- Properties designed for 8+ guests and 6 guests dominate the Lake Charles STR market, accounting for 45.4% of listings.
- 52.3% of properties accommodate 6+ guests, serving the market segment for larger families or group travel in Lake Charles.
- On average, properties in Lake Charles are equipped to host 5.1 guests.
Lake Charles Airbnb Booking Patterns (2026): Available vs. Booked Days
Available Days Distribution
Booked Days Distribution
Booking Pattern Insights for Lake Charles
- The most common availability pattern in Lake Charles falls within the 271-366 days range, representing 40.9% of listings. This suggests many properties have significant open periods on their calendars.
- Approximately 77.8% of listings show high availability (181+ days open annually), indicating potential for increased bookings or specific owner usage patterns.
- For booked days, the 91-180 days range is most frequent in Lake Charles (37.5%), reflecting common guest stay durations or potential owner blocking patterns.
- A notable 24.4% of properties secure long booking periods (181+ days booked per year), highlighting successful long-term rental strategies or significant owner usage.
Lake Charles Airbnb Minimum Stay Requirements Analysis
Distribution of Listings by Minimum Night Requirement
1 Night
86 listings
26.9% of total
2 Nights
97 listings
30.3% of total
3 Nights
13 listings
4.1% of total
4-6 Nights
19 listings
5.9% of total
7-29 Nights
21 listings
6.6% of total
30+ Nights
84 listings
26.3% of total
Key Insights
- The most prevalent minimum stay requirement in Lake Charles is 2 Nights, adopted by 30.3% of listings. This highlights the market's preference for shorter, flexible bookings.
- A significant segment (26.3%) caters to monthly stays (30+ nights) in Lake Charles, pointing to opportunities in the extended-stay market.
Recommendations
- Align with the market by considering a 2 Nights minimum stay, as 30.3% of Lake Charles hosts use this setting.
- If feasible, allowing 1-night stays, especially midweek or during low season, could capture last-minute bookings, as only 26.9% currently do.
- Explore offering discounts for stays of 30+ nights to attract the 26.3% of the market seeking extended stays.
- Adjust minimum nights based on seasonality – potentially shorter during low season and longer during peak demand periods in Lake Charles.
Lake Charles Airbnb Cancellation Policy Trends Analysis (2026)
Limited
5 listings
1.6% of total
Flexible
96 listings
30% of total
Moderate
93 listings
29.1% of total
Firm
106 listings
33.1% of total
Strict
20 listings
6.3% of total
Cancellation Policy Insights for Lake Charles
- The prevailing Airbnb cancellation policy trend in Lake Charles is Firm, used by 33.1% of listings.
- There's a relatively balanced mix between guest-friendly (59.1%) and stricter (39.4%) policies, offering choices for different guest needs.
- Strict cancellation policies are quite rare (6.3%), potentially making listings with this policy less competitive unless justified by high demand or property type.
Recommendations for Hosts
- Consider adopting a Firm policy to align with the 33.1% market standard in Lake Charles.
- Using a Strict policy might deter some guests, as only 6.3% of listings use it. Evaluate if potential revenue protection outweighs possible lower booking rates.
- Regularly review your cancellation policy against competitors and market demand shifts in Lake Charles.
Lake Charles STR Booking Lead Time Analysis (2026)
Average Booking Lead Time by Month
Booking Lead Time Insights for Lake Charles
- The overall average booking lead time for vacation rentals in Lake Charles is 21 days.
- Guests book furthest in advance for stays during July (average 28 days), likely coinciding with peak travel demand or local events.
- The shortest booking windows occur for stays in January (average 17 days), indicating more last-minute travel plans during this time.
- Seasonally, Spring (24 days avg.) sees the longest lead times, while Winter (21 days avg.) has the shortest, reflecting typical travel planning cycles.
Recommendations for Hosts
- Use the overall average lead time (21 days) as a baseline for your pricing and availability strategy in Lake Charles.
- Target marketing efforts for the Spring season well in advance (at least 24 days) to capture early planners.
- Monitor your own booking lead times against these Lake Charles averages to identify opportunities for dynamic pricing adjustments.
Popular & Essential Airbnb Amenities in Lake Charles (2026)
Amenity Prevalence
Amenity Insights for Lake Charles
- Essential amenities in Lake Charles that guests expect include: Air conditioning, Smoke alarm, Free parking on premises, Wifi, TV, Kitchen, Heating. Lacking these (any) could significantly impact bookings.
- Popular amenities like Coffee maker, Hot water, Washer are common but not universal. Offering these can provide a competitive edge.
Recommendations for Hosts
- Ensure your listing includes all essential amenities for Lake Charles: Air conditioning, Smoke alarm, Free parking on premises, Wifi, TV, Kitchen, Heating.
- Prioritize adding missing essentials: Air conditioning, Smoke alarm, Free parking on premises, Wifi, TV, Kitchen, Heating.
- Consider adding popular differentiators like Coffee maker or Hot water to increase appeal.
- Highlight unique or less common amenities you offer (e.g., hot tub, dedicated workspace, EV charger) in your listing description and photos.
- Regularly check competitor amenities in Lake Charles to stay competitive.
Lake Charles Airbnb Guest Demographics & Profile Analysis (2026)
Guest Profile Summary for Lake Charles
- The typical guest profile for Airbnb in Lake Charles consists of primarily domestic travelers (98%), often arriving from nearby Houston, typically belonging to the Post-2000s (Gen Z/Alpha) group (50%), primarily speaking English or Spanish.
- Domestic travelers account for 97.5% of guests.
- Key international markets include United States (97.5%) and United Kingdom (0.9%).
- Top languages spoken are English (75.4%) followed by Spanish (16.2%).
- A significant demographic segment is the Post-2000s (Gen Z/Alpha) group, representing 50% of guests.
Recommendations for Hosts
- Target domestic marketing efforts towards travelers from Houston and Lake Charles.
- Tailor amenities and listing descriptions to appeal to the dominant Post-2000s (Gen Z/Alpha) demographic (e.g., highlight fast WiFi, smart home features, local guides).
- Highlight unique local experiences or amenities relevant to the primary guest profile.
- Consider seasonal promotions aligned with peak travel times for key origin markets.
Nearby Short-Term Rental Market Comparison
How does the Lake Charles Airbnb market stack up against its neighbors? Compare key performance metrics like average monthly revenue, ADR, and occupancy rates in surrounding areas to understand the broader regional STR landscape.
| Market | Active Properties | Monthly Revenue | Daily Rate | Avg. Occupancy |
|---|---|---|---|---|
| Jamaica Beach | 199 | $3,774 | $394.20 | 37% |
| Crystal Beach | 143 | $3,768 | $408.48 | 35% |
| Bolivar Peninsula | 913 | $3,311 | $396.49 | 34% |
| Milam | 12 | $2,955 | $346.16 | 41% |
| Hackberry | 26 | $2,869 | $332.54 | 31% |
| San Leon | 78 | $2,713 | $308.16 | 35% |
| Galveston | 3,732 | $2,581 | $297.50 | 35% |
| Lumberton | 20 | $2,377 | $230.17 | 35% |
| Brookeland | 56 | $2,363 | $289.67 | 33% |
| Zwolle | 31 | $2,297 | $248.16 | 30% |