Kenner Airbnb Market Analysis 2026: Short Term Rental Data & Vacation Rental Statistics in Louisiana, United States
Is Airbnb profitable in Kenner in 2026? Explore comprehensive Airbnb analytics for Kenner, Louisiana, United States to uncover income potential. This 2026 STR market report for Kenner, based on AirROI data from February 2025 to January 2026, reveals key trends in the niche market of 59 active listings.
Whether you're considering an Airbnb investment in Kenner, optimizing your existing vacation rental, or exploring rental arbitrage opportunities, understanding the Kenner Airbnb data is crucial. Leveraging the low regulation environment is key to maximizing your short term rental income potential. Let's dive into the specifics.
Key Kenner Airbnb Performance Metrics Overview
Monthly Airbnb Revenue Variations & Income Potential in Kenner (2026)
Understanding the monthly revenue variations for Airbnb listings in Kenner is key to maximizing your short term rental income potential. Seasonality significantly impacts earnings. Our analysis, based on data from the past 12 months, shows that the peak revenue month for STRs in Kenner is typically February, while January often presents the lowest earnings, highlighting opportunities for strategic pricing adjustments during shoulder and low seasons. Explore the typical Airbnb income in Kenner across different performance tiers:
- Best-in-class properties (Top 10%) achieve $5,662+ monthly, often utilizing dynamic pricing and superior guest experiences.
- Strong performing properties (Top 25%) earn $3,530 or more, indicating effective management and desirable locations/amenities.
- Typical properties (Median) generate around $1,703 per month, representing the average market performance.
- Entry-level properties (Bottom 25%) see earnings around $884, often with potential for optimization.
Average Monthly Airbnb Earnings Trend in Kenner
Kenner Airbnb Occupancy Rate Trends (2026)
Maximize your bookings by understanding the Kenner STR occupancy trends. Seasonal demand shifts significantly influence how often properties are booked. Typically, Februarysees the highest demand (peak season occupancy), while January experiences the lowest (low season). Effective strategies, like adjusting minimum stays or offering promotions, can boost occupancy during slower periods. Here's how different property tiers perform in Kenner:
- Best-in-class properties (Top 10%) achieve 79%+ occupancy, indicating high desirability and potentially optimized availability.
- Strong performing properties (Top 25%) maintain 63% or higher occupancy, suggesting good market fit and guest satisfaction.
- Typical properties (Median) have an occupancy rate around 40%.
- Entry-level properties (Bottom 25%) average 20% occupancy, potentially facing higher vacancy.
Average Monthly Occupancy Rate Trend in Kenner
Average Daily Rate (ADR) Airbnb Trends in Kenner (2026)
Effective short term rental pricing strategy in Kenner involves understanding monthly ADR fluctuations. The Average Daily Rate (ADR) for Airbnb in Kenner typically peaks in February and dips lowest during April. Leveraging Airbnb dynamic pricing tools or strategies based on this seasonality can significantly boost revenue. Here's a look at the typical nightly rates achieved:
- Best-in-class properties (Top 10%) command rates of $362+ per night, often due to premium features or locations.
- Strong performing properties (Top 25%) achieve nightly rates of $260 or more.
- Typical properties (Median) charge around $148 per night.
- Entry-level properties (Bottom 25%) earn around $102 per night.
Average Daily Rate (ADR) Trend by Month in Kenner
Get Live Kenner Market Intelligence 👇

Explore Real-time Analytics
Airbnb Seasonality Analysis & Trends in Kenner (2026)
Peak Season (February, May, March)
- Revenue averages $3,095 per month
- Occupancy rates average 50.9%
- Daily rates average $194
Shoulder Season
- Revenue averages $2,509 per month
- Occupancy maintains around 42.1%
- Daily rates hold near $190
Low Season (January, June, August)
- Revenue drops to average $1,704 per month
- Occupancy decreases to average 33.3%
- Daily rates adjust to average $189
Seasonality Insights for Kenner
- The Airbnb seasonality in Kenner shows moderate seasonality with distinct peak and low periods. While the sections above show seasonal averages, it's also insightful to look at the extremes:
- During the high season, the absolute peak month showcases Kenner's highest earning potential, with monthly revenues capable of climbing to $3,304, occupancy reaching a high of 54.8%, and ADRs peaking at $208.
- Conversely, the slowest single month of the year, typically falling within the low season, marks the market's lowest point. In this month, revenue might dip to $1,595, occupancy could drop to 29.3%, and ADRs may adjust down to $181.
- Understanding both the seasonal averages and these monthly peaks and troughs in revenue, occupancy, and ADR is crucial for maximizing your Airbnb profit potential in Kenner.
Seasonal Strategies for Maximizing Profit
- Peak Season: Maximize revenue through premium pricing and potentially longer minimum stays. Ensure high availability.
- Low Season: Offer competitive pricing, special promotions (e.g., extended stay discounts), and flexible cancellation policies. Target off-season travelers like remote workers or budget-conscious guests.
- Shoulder Seasons: Implement dynamic pricing that balances peak and low rates. Target weekend travelers or specific events. Offer slightly more flexible terms than peak season.
- Regularly analyze your own performance against these Kenner seasonality benchmarks and adjust your pricing and availability strategy accordingly.
Best Areas for Airbnb Investment in Kenner (2026)
Exploring the top neighborhoods for short-term rentals in Kenner? This section highlights key areas, outlining why they are attractive for hosts and guests, along with notable local attractions. Consider these locations based on your target guest profile and investment strategy.
| Neighborhood / Area | Why Host Here? (Target Guests & Appeal) | Key Attractions & Landmarks |
|---|---|---|
| Kenner Waterfront | A beautiful waterfront area that attracts tourists looking for scenic views and outdoor activities. Great for families and those who enjoy water sports and fishing. | Kenner Town Square, Lakeside Shopping Center, Lake Pontchartrain, Kenner Riverboat, Pelican Park |
| Old Kenner | Historical district with charming homes and a quaint atmosphere. Ideal for visitors interested in local culture and history, with access to local dining and shops. | Kenner's Historic District, Cypress Swamp, Old Kenner Cemetery, Gonzales Park, Rivertown |
| Esplanade Mall Area | Home to one of the largest shopping centers in the region, attracting both shoppers and those looking for entertainment and dining options. | Esplanade Mall, Regal Cinema Esplanade 10, Metro Health & Fitness, various dining options, local boutiques |
| Adrian C. Hall Community Center | A hub for events and community activities, attracting visitors during sports events and local festivals. | Adrian C. Hall Community Center, local festivals, fitness events, community gatherings |
| Crescent City Connection | A vital transportation link with great views of the New Orleans skyline, appealing to those who wish to explore both Kenner and New Orleans easily. | Crescent City Connection Bridge, Riverwalk Marketplace, Great views of the Mississippi River, easy access to downtown New Orleans |
| Kenner Science Museum | Attracts families and school groups looking for educational experiences, making it appealing for family-friendly rentals. | Kenner Science Museum, interactive exhibits, family-friendly activities |
| Pelican Park Area | A local sports complex popular with families for recreational activities, perfect for sports enthusiasts and families alike. | Pelican Park, multi-sport fields, walking trails, playgrounds |
| Oakland Park | Quiet residential area with a friendly community ambiance, attractive for longer stays and temporary relocations. | local parks, residential ambiance, family-friendly events, proximity to schools |
Understanding Airbnb License Requirements & STR Laws in Kenner (2026)
While Kenner, Louisiana, United States currently shows low STR regulations, specific Airbnb license requirements might still exist or change. Always verify the latest short term rental regulations and Airbnb license requirements directly with local government authorities for Kenner to ensure full compliance before hosting.
(Source: AirROI data, 2026, based on 2% licensed listings)
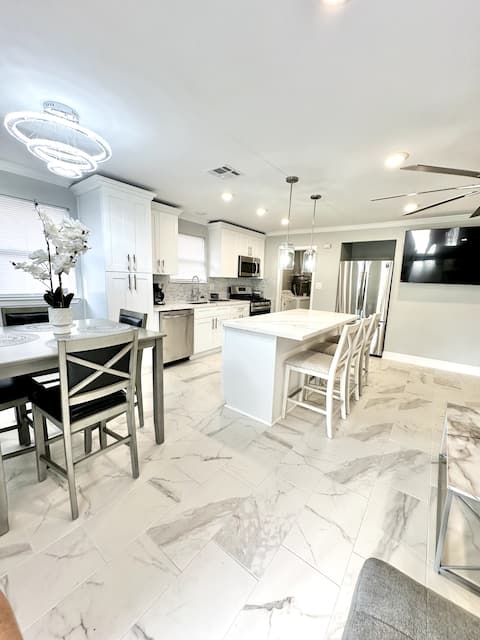
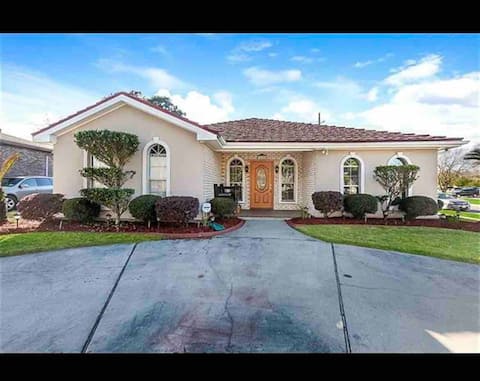
Top Performing Airbnb Properties in Kenner (2026)
Benchmark your potential! Explore examples of top-performing Airbnb properties in Kennerbased on Trailing Twelve Month (TTM) revenue. Analyze their characteristics, revenue, occupancy rate, and ADR to understand what drives success in this market.

Newly constructed house in NOLA
Entire Place • 4 bedrooms

Delightful,Spacious, Tranquil Residential home
Entire Place • 5 bedrooms
Lovely, Cozy Residential home
Entire Place • 5 bedrooms

Safe Beautiful Furnished Resort Kenner/New Orleans
Entire Place • 3 bedrooms

Quiet, Safe NOLA Getaway:Mins to Airport, King Bed
Entire Place • 3 bedrooms
Southern’s Beauty2 very close to the airport
Entire Place • 4 bedrooms
Note: Performance varies based on location, size, amenities, seasonality, and management quality. Data reflects the past 12 months.
Top Performing Airbnb Hosts in Kenner (2026)
Learn from the best! This table showcases top-performing Airbnb hosts in Kenner based on the number of properties managed and estimated total revenue over the past year. Analyze their scale and performance metrics.
| Host Name | Properties | Grossing Revenue | Stay Reviews | Avg Rating |
|---|---|---|---|---|
| Marisol | 3 | $170,789 | 308 | 4.96/5.0 |
| Nick | 2 | $111,164 | 127 | 4.91/5.0 |
| Jason | 2 | $95,078 | 195 | 4.88/5.0 |
| Bryan | 2 | $82,551 | 111 | 4.97/5.0 |
| Samah | 2 | $80,259 | 492 | 4.89/5.0 |
| Jeffery | 1 | $51,574 | 60 | 4.90/5.0 |
| Nola | 6 | $50,328 | 469 | 4.76/5.0 |
| Davon | 1 | $50,070 | 30 | 4.87/5.0 |
| Robert | 1 | $43,972 | 180 | 4.92/5.0 |
| Danny | 1 | $42,350 | 162 | 4.73/5.0 |
Analyzing the strategies of top hosts, such as their property selection, pricing, and guest communication, can offer valuable lessons for optimizing your own Airbnb operations in Kenner.
Dive Deeper: Advanced Kenner STR Market Data (2026)
Ready to unlock more insights? AirROI provides access to advanced metrics and comprehensive Airbnb data for Kenner. Explore detailed analytics beyond this report to refine your investment strategy, optimize pricing, and maximize your vacation rental profits.
Explore Advanced MetricsKenner Short-Term Rental Market Composition (2026): Property & Room Types
Room Type Distribution
Property Type Distribution
Market Composition Insights for Kenner
- The Kenner Airbnb market composition is heavily skewed towards Entire Home/Apt listings, which make up 89.8% of the 59 active rentals. This indicates strong guest preference for privacy and space.
- Looking at the property type distribution in Kenner, House properties are the most common (59.3%), reflecting the local real estate landscape.
- Houses represent a significant 59.3% portion, catering likely to families or larger groups.
- The presence of 8.5% Hotel/Boutique listings indicates integration with traditional hospitality.
Kenner Airbnb Room Capacity Analysis (2026): Bedroom Distribution
Distribution of Listings by Number of Bedrooms
Room Capacity Insights for Kenner
- The dominant room capacity in Kenner is 3 bedrooms listings, making up 28.8% of the market. This suggests a strong demand for properties suitable for families or small groups.
- Together, 3 bedrooms and 1 bedroom properties represent 55.9% of the active Airbnb listings in Kenner, indicating a high concentration in these sizes.
- A significant 44.1% of listings offer 3+ bedrooms, catering to larger groups and families seeking more space in Kenner.
Kenner Vacation Rental Guest Capacity Trends (2026)
Distribution of Listings by Guest Capacity
Guest Capacity Insights for Kenner
- The most common guest capacity trend in Kenner vacation rentals is listings accommodating 8+ guests (32.2%). This suggests the primary traveler segment is likely larger groups.
- Properties designed for 8+ guests and 4 guests dominate the Kenner STR market, accounting for 49.1% of listings.
- 45.8% of properties accommodate 6+ guests, serving the market segment for larger families or group travel in Kenner.
- On average, properties in Kenner are equipped to host 4.9 guests.
Kenner Airbnb Booking Patterns (2026): Available vs. Booked Days
Available Days Distribution
Booked Days Distribution
Booking Pattern Insights for Kenner
- The most common availability pattern in Kenner falls within the 271-366 days range, representing 42.4% of listings. This suggests many properties have significant open periods on their calendars.
- Approximately 79.7% of listings show high availability (181+ days open annually), indicating potential for increased bookings or specific owner usage patterns.
- For booked days, the 91-180 days range is most frequent in Kenner (35.6%), reflecting common guest stay durations or potential owner blocking patterns.
- A notable 25.4% of properties secure long booking periods (181+ days booked per year), highlighting successful long-term rental strategies or significant owner usage.
Kenner Airbnb Minimum Stay Requirements Analysis
Distribution of Listings by Minimum Night Requirement
1 Night
25 listings
42.4% of total
2 Nights
11 listings
18.6% of total
3 Nights
6 listings
10.2% of total
4-6 Nights
1 listings
1.7% of total
7-29 Nights
4 listings
6.8% of total
30+ Nights
12 listings
20.3% of total
Key Insights
- The most prevalent minimum stay requirement in Kenner is 1 Night, adopted by 42.4% of listings. This highlights the market's preference for shorter, flexible bookings.
- A strong majority (61.0%) of the Kenner Airbnb data shows acceptance of very short stays (1-2 nights), indicating a dynamic, high-turnover market.
- A significant segment (20.3%) caters to monthly stays (30+ nights) in Kenner, pointing to opportunities in the extended-stay market.
Recommendations
- Align with the market by considering a 1 Night minimum stay, as 42.4% of Kenner hosts use this setting.
- Explore offering discounts for stays of 30+ nights to attract the 20.3% of the market seeking extended stays.
- Adjust minimum nights based on seasonality – potentially shorter during low season and longer during peak demand periods in Kenner.
Kenner Airbnb Cancellation Policy Trends Analysis (2026)
Flexible
15 listings
25.4% of total
Moderate
8 listings
13.6% of total
Firm
21 listings
35.6% of total
Strict
15 listings
25.4% of total
Cancellation Policy Insights for Kenner
- The prevailing Airbnb cancellation policy trend in Kenner is Firm, used by 35.6% of listings.
- A majority (61.0%) of hosts in Kenner utilize Firm or Strict policies, indicating a market where hosts prioritize booking security.
Recommendations for Hosts
- Consider adopting a Firm policy to align with the 35.6% market standard in Kenner.
- Regularly review your cancellation policy against competitors and market demand shifts in Kenner.
Kenner STR Booking Lead Time Analysis (2026)
Average Booking Lead Time by Month
Booking Lead Time Insights for Kenner
- The overall average booking lead time for vacation rentals in Kenner is 37 days.
- Guests book furthest in advance for stays during February (average 74 days), likely coinciding with peak travel demand or local events.
- The shortest booking windows occur for stays in January (average 27 days), indicating more last-minute travel plans during this time.
- Seasonally, Winter (44 days avg.) sees the longest lead times, while Summer (33 days avg.) has the shortest, reflecting typical travel planning cycles.
Recommendations for Hosts
- Use the overall average lead time (37 days) as a baseline for your pricing and availability strategy in Kenner.
- For February stays, consider implementing length-of-stay discounts or slightly higher rates for bookings made less than 74 days out to capitalize on advance planning.
- Target marketing efforts for the Winter season well in advance (at least 44 days) to capture early planners.
- Monitor your own booking lead times against these Kenner averages to identify opportunities for dynamic pricing adjustments.
Popular & Essential Airbnb Amenities in Kenner (2026)
Amenity Prevalence
Amenity Insights for Kenner
- Essential amenities in Kenner that guests expect include: TV, Smoke alarm, Air conditioning, Wifi. Lacking these (any) could significantly impact bookings.
- Popular amenities like Dishes and silverware, Heating, Kitchen are common but not universal. Offering these can provide a competitive edge.
Recommendations for Hosts
- Ensure your listing includes all essential amenities for Kenner: TV, Smoke alarm, Air conditioning, Wifi.
- Prioritize adding missing essentials: Smoke alarm, Air conditioning, Wifi.
- Consider adding popular differentiators like Dishes and silverware or Heating to increase appeal.
- Highlight unique or less common amenities you offer (e.g., hot tub, dedicated workspace, EV charger) in your listing description and photos.
- Regularly check competitor amenities in Kenner to stay competitive.
Kenner Airbnb Guest Demographics & Profile Analysis (2026)
Guest Profile Summary for Kenner
- The typical guest profile for Airbnb in Kenner consists of primarily domestic travelers (95%), often arriving from nearby Houston, typically belonging to the Post-2000s (Gen Z/Alpha) group (50%), primarily speaking English or Spanish.
- Domestic travelers account for 95.0% of guests.
- Key international markets include United States (95%) and Canada (0.9%).
- Top languages spoken are English (71.7%) followed by Spanish (14.9%).
- A significant demographic segment is the Post-2000s (Gen Z/Alpha) group, representing 50% of guests.
Recommendations for Hosts
- Target domestic marketing efforts towards travelers from Houston and New Orleans.
- Tailor amenities and listing descriptions to appeal to the dominant Post-2000s (Gen Z/Alpha) demographic (e.g., highlight fast WiFi, smart home features, local guides).
- Highlight unique local experiences or amenities relevant to the primary guest profile.
- Consider seasonal promotions aligned with peak travel times for key origin markets.
Nearby Short-Term Rental Market Comparison
How does the Kenner Airbnb market stack up against its neighbors? Compare key performance metrics like average monthly revenue, ADR, and occupancy rates in surrounding areas to understand the broader regional STR landscape.
| Market | Active Properties | Monthly Revenue | Daily Rate | Avg. Occupancy |
|---|---|---|---|---|
| Plaquemines Parish | 28 | $4,733 | $413.26 | 40% |
| New Orleans | 4,857 | $3,260 | $298.03 | 42% |
| Grand Isle | 106 | $3,149 | $432.40 | 32% |
| Killian | 14 | $3,089 | $360.39 | 37% |
| New Roads | 27 | $2,790 | $361.00 | 32% |
| Pass Christian | 179 | $2,762 | $294.40 | 36% |
| Ponchatoula | 49 | $2,512 | $231.70 | 39% |
| Bay Saint Louis | 286 | $2,488 | $265.09 | 35% |
| Covington | 65 | $2,427 | $204.72 | 47% |
| Petal | 15 | $2,415 | $216.54 | 41% |