Folsom Airbnb Market Analysis 2026: Short Term Rental Data & Vacation Rental Statistics in Louisiana, United States
Is Airbnb profitable in Folsom in 2026? Explore comprehensive Airbnb analytics for Folsom, Louisiana, United States to uncover income potential. This 2026 STR market report for Folsom, based on AirROI data from February 2025 to January 2026, reveals key trends in the niche market of 25 active listings.
Whether you're considering an Airbnb investment in Folsom, optimizing your existing vacation rental, or exploring rental arbitrage opportunities, understanding the Folsom Airbnb data is crucial. Leveraging the low regulation environment is key to maximizing your short term rental income potential. Let's dive into the specifics.
Key Folsom Airbnb Performance Metrics Overview
Monthly Airbnb Revenue Variations & Income Potential in Folsom (2026)
Understanding the monthly revenue variations for Airbnb listings in Folsom is key to maximizing your short term rental income potential. Seasonality significantly impacts earnings. Our analysis, based on data from the past 12 months, shows that the peak revenue month for STRs in Folsom is typically June, while August often presents the lowest earnings, highlighting opportunities for strategic pricing adjustments during shoulder and low seasons. Explore the typical Airbnb income in Folsom across different performance tiers:
- Best-in-class properties (Top 10%) achieve $3,855+ monthly, often utilizing dynamic pricing and superior guest experiences.
- Strong performing properties (Top 25%) earn $2,763 or more, indicating effective management and desirable locations/amenities.
- Typical properties (Median) generate around $1,527 per month, representing the average market performance.
- Entry-level properties (Bottom 25%) see earnings around $669, often with potential for optimization.
Average Monthly Airbnb Earnings Trend in Folsom
Folsom Airbnb Occupancy Rate Trends (2026)
Maximize your bookings by understanding the Folsom STR occupancy trends. Seasonal demand shifts significantly influence how often properties are booked. Typically, Februarysees the highest demand (peak season occupancy), while August experiences the lowest (low season). Effective strategies, like adjusting minimum stays or offering promotions, can boost occupancy during slower periods. Here's how different property tiers perform in Folsom:
- Best-in-class properties (Top 10%) achieve 66%+ occupancy, indicating high desirability and potentially optimized availability.
- Strong performing properties (Top 25%) maintain 48% or higher occupancy, suggesting good market fit and guest satisfaction.
- Typical properties (Median) have an occupancy rate around 29%.
- Entry-level properties (Bottom 25%) average 15% occupancy, potentially facing higher vacancy.
Average Monthly Occupancy Rate Trend in Folsom
Average Daily Rate (ADR) Airbnb Trends in Folsom (2026)
Effective short term rental pricing strategy in Folsom involves understanding monthly ADR fluctuations. The Average Daily Rate (ADR) for Airbnb in Folsom typically peaks in December and dips lowest during April. Leveraging Airbnb dynamic pricing tools or strategies based on this seasonality can significantly boost revenue. Here's a look at the typical nightly rates achieved:
- Best-in-class properties (Top 10%) command rates of $276+ per night, often due to premium features or locations.
- Strong performing properties (Top 25%) achieve nightly rates of $195 or more.
- Typical properties (Median) charge around $149 per night.
- Entry-level properties (Bottom 25%) earn around $106 per night.
Average Daily Rate (ADR) Trend by Month in Folsom
Get Live Folsom Market Intelligence 👇

Explore Real-time Analytics
Airbnb Seasonality Analysis & Trends in Folsom (2026)
Peak Season (June, December, March)
- Revenue averages $2,185 per month
- Occupancy rates average 35.2%
- Daily rates average $168
Shoulder Season
- Revenue averages $1,945 per month
- Occupancy maintains around 36.5%
- Daily rates hold near $165
Low Season (January, August, September)
- Revenue drops to average $1,423 per month
- Occupancy decreases to average 26.8%
- Daily rates adjust to average $171
Seasonality Insights for Folsom
- The Airbnb seasonality in Folsom shows moderate seasonality with distinct peak and low periods. While the sections above show seasonal averages, it's also insightful to look at the extremes:
- During the high season, the absolute peak month showcases Folsom's highest earning potential, with monthly revenues capable of climbing to $2,359, occupancy reaching a high of 44.4%, and ADRs peaking at $184.
- Conversely, the slowest single month of the year, typically falling within the low season, marks the market's lowest point. In this month, revenue might dip to $1,226, occupancy could drop to 23.7%, and ADRs may adjust down to $150.
- Understanding both the seasonal averages and these monthly peaks and troughs in revenue, occupancy, and ADR is crucial for maximizing your Airbnb profit potential in Folsom.
Seasonal Strategies for Maximizing Profit
- Peak Season: Maximize revenue through premium pricing and potentially longer minimum stays. Ensure high availability.
- Low Season: Offer competitive pricing, special promotions (e.g., extended stay discounts), and flexible cancellation policies. Target off-season travelers like remote workers or budget-conscious guests.
- Shoulder Seasons: Implement dynamic pricing that balances peak and low rates. Target weekend travelers or specific events. Offer slightly more flexible terms than peak season.
- Regularly analyze your own performance against these Folsom seasonality benchmarks and adjust your pricing and availability strategy accordingly.
Best Areas for Airbnb Investment in Folsom (2026)
Exploring the top neighborhoods for short-term rentals in Folsom? This section highlights key areas, outlining why they are attractive for hosts and guests, along with notable local attractions. Consider these locations based on your target guest profile and investment strategy.
| Neighborhood / Area | Why Host Here? (Target Guests & Appeal) | Key Attractions & Landmarks |
|---|---|---|
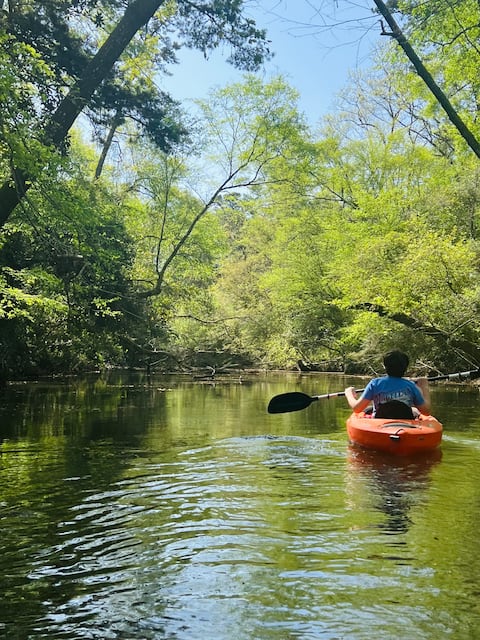
| Lake Pontchartrain | A natural getaway with stunning water views. Ideal for those looking for outdoor activities such as fishing, boating, and enjoying nature walks, attracting nature enthusiasts and families alike. | Pelican Park, Cypress Garden, Folsom Lake, Lake Pontchartrain, Parks and Wildlife areas |
| Historic Folsom Village | A quaint neighborhood full of charm, featuring antique shops and local eateries. Perfect for travelers seeking a unique local experience with a small-town feel. | Folsom Historical Society, Local Art Galleries, Shops and Cafes, Community Events, Local Festivals |
| Nola's Folsom Festival area | Known for its lively community festivals and events. Great for those wanting to experience local culture and festivities, drawing crowds during special events. | Annual Folsom Art Festival, Music Events, Seasonal Fairs, Food Truck Gatherings, Craft Fairs |
| Off Road Trails | Surrounded by nature with numerous biking and hiking trails. Attracts outdoor adventurers and nature lovers looking for a rustic retreat away from the city. | Hiking Trails, Biking Routes, Wildlife Viewing, Picnic Areas, Scenic Overviews |
| Rural Retreats | Offers an escape into the countryside with peaceful surroundings and agricultural experiences. Attractions for families and groups looking for retreat-style stays. | Local Farms, Rural Tourism, Agritourism Experiences, Nature Reserves, Scenic Drives |
| Sports and Recreation Complex | A hub for families and sports enthusiasts. Perfect for travelers interested in athletic activities and family-friendly outings. | Folsom Sports Complex, Playgrounds, Community Sports Events, Outdoor Activities |
| Local Wineries and Vineyards | A top destination for wine lovers and those seeking relaxing vineyard experiences. Offers tours and tastings that draw both locals and tourists. | Local Vineyards, Wine Tastings, Grape Picking, Wine Festivals, Scenic Vineyard Views |
| Folsom Wildlife Center | An educational hub that focuses on local wildlife conservation. Attracts families and nature enthusiasts seeking a unique experience. | Wildlife Viewing, Educational Programs, Nature Trails, Family Activities, Conservation Workshops |
Understanding Airbnb License Requirements & STR Laws in Folsom (2026)
While Folsom, Louisiana, United States currently shows low STR regulations, specific Airbnb license requirements might still exist or change. Always verify the latest short term rental regulations and Airbnb license requirements directly with local government authorities for Folsom to ensure full compliance before hosting.
(Source: AirROI data, 2026, finding no licensed listings among those analyzed)
Top Performing Airbnb Properties in Folsom (2026)
Benchmark your potential! Explore examples of top-performing Airbnb properties in Folsombased on Trailing Twelve Month (TTM) revenue. Analyze their characteristics, revenue, occupancy rate, and ADR to understand what drives success in this market.

Stunning 3 bdrm. River Paradise on 7 acres!
Entire Place • 3 bedrooms

Bluebird Lane Estates
Entire Place • 4 bedrooms
Folsom Prison AKA Paradise on 12 Acres
Entire Place • 1 bedroom

Core Homestead, a country escape
Entire Place • 3 bedrooms

Cozy Cottage on Little Tchefuncta River
Entire Place • 3 bedrooms

Little lodge
Entire Place • 2 bedrooms
Note: Performance varies based on location, size, amenities, seasonality, and management quality. Data reflects the past 12 months.
Top Performing Airbnb Hosts in Folsom (2026)
Learn from the best! This table showcases top-performing Airbnb hosts in Folsom based on the number of properties managed and estimated total revenue over the past year. Analyze their scale and performance metrics.
| Host Name | Properties | Grossing Revenue | Stay Reviews | Avg Rating |
|---|---|---|---|---|
| Marcus | 1 | $53,934 | 247 | 4.83/5.0 |
| Allison | 1 | $44,815 | 105 | 4.98/5.0 |
| Krista | 1 | $38,776 | 81 | 4.89/5.0 |
| Susan C | 1 | $31,988 | 90 | 5.00/5.0 |
| Micah | 3 | $28,255 | 98 | 4.98/5.0 |
| Bobbie | 1 | $24,682 | 109 | 4.99/5.0 |
| Georgia | 1 | $21,237 | 347 | 4.96/5.0 |
| Katie | 1 | $20,562 | 45 | 4.78/5.0 |
| Marcie | 5 | $19,739 | 120 | 4.65/5.0 |
| Virginia | 1 | $19,423 | 119 | 4.87/5.0 |
Analyzing the strategies of top hosts, such as their property selection, pricing, and guest communication, can offer valuable lessons for optimizing your own Airbnb operations in Folsom.
Dive Deeper: Advanced Folsom STR Market Data (2026)
Ready to unlock more insights? AirROI provides access to advanced metrics and comprehensive Airbnb data for Folsom. Explore detailed analytics beyond this report to refine your investment strategy, optimize pricing, and maximize your vacation rental profits.
Explore Advanced MetricsFolsom Short-Term Rental Market Composition (2026): Property & Room Types
Room Type Distribution
Property Type Distribution
Market Composition Insights for Folsom
- The Folsom Airbnb market composition is heavily skewed towards Entire Home/Apt listings, which make up 100% of the 25 active rentals. This indicates strong guest preference for privacy and space.
- Looking at the property type distribution in Folsom, House properties are the most common (40%), reflecting the local real estate landscape.
- Houses represent a significant 40% portion, catering likely to families or larger groups.
- Smaller segments like hotel/boutique (combined 4.0%) offer potential for unique stay experiences.
Folsom Airbnb Room Capacity Analysis (2026): Bedroom Distribution
Distribution of Listings by Number of Bedrooms
Room Capacity Insights for Folsom
- The dominant room capacity in Folsom is 1 bedroom listings, making up 56% of the market. This suggests a strong demand for properties suitable for couples or solo travelers.
- Together, 1 bedroom and 3 bedrooms properties represent 76.0% of the active Airbnb listings in Folsom, indicating a high concentration in these sizes.
- With over half the market (56%) consisting of studios or 1-bedroom units, Folsom is particularly well-suited for individuals or couples.
- A significant 28.0% of listings offer 3+ bedrooms, catering to larger groups and families seeking more space in Folsom.
Folsom Vacation Rental Guest Capacity Trends (2026)
Distribution of Listings by Guest Capacity
Guest Capacity Insights for Folsom
- The most common guest capacity trend in Folsom vacation rentals is listings accommodating 2 guests (32%). This suggests the primary traveler segment is likely couples or solo travelers.
- Properties designed for 2 guests and 4 guests dominate the Folsom STR market, accounting for 56.0% of listings.
- 32.0% of properties accommodate 6+ guests, serving the market segment for larger families or group travel in Folsom.
- On average, properties in Folsom are equipped to host 4.1 guests.
Folsom Airbnb Booking Patterns (2026): Available vs. Booked Days
Available Days Distribution
Booked Days Distribution
Booking Pattern Insights for Folsom
- The most common availability pattern in Folsom falls within the 271-366 days range, representing 56% of listings. This suggests many properties have significant open periods on their calendars.
- Approximately 92.0% of listings show high availability (181+ days open annually), indicating potential for increased bookings or specific owner usage patterns.
- For booked days, the 31-90 days range is most frequent in Folsom (36%), reflecting common guest stay durations or potential owner blocking patterns.
- A notable 8.0% of properties secure long booking periods (181+ days booked per year), highlighting successful long-term rental strategies or significant owner usage.
Folsom Airbnb Minimum Stay Requirements Analysis
Distribution of Listings by Minimum Night Requirement
1 Night
8 listings
32% of total
2 Nights
8 listings
32% of total
3 Nights
3 listings
12% of total
7-29 Nights
2 listings
8% of total
30+ Nights
4 listings
16% of total
Key Insights
- The most prevalent minimum stay requirement in Folsom is 1 Night, adopted by 32% of listings. This highlights the market's preference for shorter, flexible bookings.
- A strong majority (64.0%) of the Folsom Airbnb data shows acceptance of very short stays (1-2 nights), indicating a dynamic, high-turnover market.
- A significant segment (16%) caters to monthly stays (30+ nights) in Folsom, pointing to opportunities in the extended-stay market.
Recommendations
- Align with the market by considering a 1 Night minimum stay, as 32% of Folsom hosts use this setting.
- Explore offering discounts for stays of 30+ nights to attract the 16% of the market seeking extended stays.
- Adjust minimum nights based on seasonality – potentially shorter during low season and longer during peak demand periods in Folsom.
Folsom Airbnb Cancellation Policy Trends Analysis (2026)
Flexible
10 listings
40% of total
Moderate
6 listings
24% of total
Firm
8 listings
32% of total
Strict
1 listings
4% of total
Cancellation Policy Insights for Folsom
- The prevailing Airbnb cancellation policy trend in Folsom is Flexible, used by 40% of listings.
- There's a relatively balanced mix between guest-friendly (64.0%) and stricter (36.0%) policies, offering choices for different guest needs.
- Strict cancellation policies are quite rare (4%), potentially making listings with this policy less competitive unless justified by high demand or property type.
Recommendations for Hosts
- Consider adopting a Flexible policy to align with the 40% market standard in Folsom.
- Using a Strict policy might deter some guests, as only 4% of listings use it. Evaluate if potential revenue protection outweighs possible lower booking rates.
- Regularly review your cancellation policy against competitors and market demand shifts in Folsom.
Folsom STR Booking Lead Time Analysis (2026)
Average Booking Lead Time by Month
Booking Lead Time Insights for Folsom
- The overall average booking lead time for vacation rentals in Folsom is 43 days.
- Guests book furthest in advance for stays during September (average 135 days), likely coinciding with peak travel demand or local events.
- The shortest booking windows occur for stays in August (average 18 days), indicating more last-minute travel plans during this time.
- Seasonally, Fall (90 days avg.) sees the longest lead times, while Summer (28 days avg.) has the shortest, reflecting typical travel planning cycles.
Recommendations for Hosts
- Use the overall average lead time (43 days) as a baseline for your pricing and availability strategy in Folsom.
- For September stays, consider implementing length-of-stay discounts or slightly higher rates for bookings made less than 135 days out to capitalize on advance planning.
- Target marketing efforts for the Fall season well in advance (at least 90 days) to capture early planners.
- Monitor your own booking lead times against these Folsom averages to identify opportunities for dynamic pricing adjustments.
Popular & Essential Airbnb Amenities in Folsom (2026)
Amenity Prevalence
Amenity Insights for Folsom
- Essential amenities in Folsom that guests expect include: Free parking on premises, Microwave, Fire extinguisher, Heating, TV, Coffee maker, Air conditioning, Dishes and silverware, Smoke alarm, Essentials. Lacking these (any) could significantly impact bookings.
Recommendations for Hosts
- Ensure your listing includes all essential amenities for Folsom: Free parking on premises, Microwave, Fire extinguisher, Heating, TV, Coffee maker, Air conditioning, Dishes and silverware, Smoke alarm, Essentials.
- Prioritize adding missing essentials: Smoke alarm, Essentials.
- Highlight unique or less common amenities you offer (e.g., hot tub, dedicated workspace, EV charger) in your listing description and photos.
- Regularly check competitor amenities in Folsom to stay competitive.
Folsom Airbnb Guest Demographics & Profile Analysis (2026)
Guest Profile Summary for Folsom
- The typical guest profile for Airbnb in Folsom consists of primarily domestic travelers (98%), often arriving from nearby New Orleans, typically belonging to the Post-2000s (Gen Z/Alpha) group (50%), primarily speaking English or Spanish.
- Domestic travelers account for 97.7% of guests.
- Key international markets include United States (97.7%) and Japan (0.8%).
- Top languages spoken are English (67.2%) followed by Spanish (20.9%).
- A significant demographic segment is the Post-2000s (Gen Z/Alpha) group, representing 50% of guests.
Recommendations for Hosts
- Target domestic marketing efforts towards travelers from New Orleans and Covington.
- Tailor amenities and listing descriptions to appeal to the dominant Post-2000s (Gen Z/Alpha) demographic (e.g., highlight fast WiFi, smart home features, local guides).
- Highlight unique local experiences or amenities relevant to the primary guest profile.
- Consider seasonal promotions aligned with peak travel times for key origin markets.
Nearby Short-Term Rental Market Comparison
How does the Folsom Airbnb market stack up against its neighbors? Compare key performance metrics like average monthly revenue, ADR, and occupancy rates in surrounding areas to understand the broader regional STR landscape.
| Market | Active Properties | Monthly Revenue | Daily Rate | Avg. Occupancy |
|---|---|---|---|---|
| Plaquemines Parish | 28 | $4,733 | $413.26 | 40% |
| New Orleans | 4,857 | $3,260 | $298.03 | 42% |
| Grand Isle | 106 | $3,149 | $432.40 | 32% |
| Killian | 14 | $3,089 | $360.39 | 37% |
| New Roads | 27 | $2,790 | $361.00 | 32% |
| Pass Christian | 179 | $2,762 | $294.40 | 36% |
| Ponchatoula | 49 | $2,512 | $231.70 | 39% |
| Bay Saint Louis | 286 | $2,488 | $265.09 | 35% |
| Covington | 65 | $2,427 | $204.72 | 47% |
| Petal | 15 | $2,415 | $216.54 | 41% |