Breaux Bridge Airbnb Market Analysis 2026: Short Term Rental Data & Vacation Rental Statistics in Louisiana, United States
Is Airbnb profitable in Breaux Bridge in 2026? Explore comprehensive Airbnb analytics for Breaux Bridge, Louisiana, United States to uncover income potential. This 2026 STR market report for Breaux Bridge, based on AirROI data from February 2025 to January 2026, reveals key trends in the niche market of 69 active listings.
Whether you're considering an Airbnb investment in Breaux Bridge, optimizing your existing vacation rental, or exploring rental arbitrage opportunities, understanding the Breaux Bridge Airbnb data is crucial. Leveraging the low regulation environment is key to maximizing your short term rental income potential. Let's dive into the specifics.
Key Breaux Bridge Airbnb Performance Metrics Overview
Monthly Airbnb Revenue Variations & Income Potential in Breaux Bridge (2026)
Understanding the monthly revenue variations for Airbnb listings in Breaux Bridge is key to maximizing your short term rental income potential. Seasonality significantly impacts earnings. Our analysis, based on data from the past 12 months, shows that the peak revenue month for STRs in Breaux Bridge is typically March, while August often presents the lowest earnings, highlighting opportunities for strategic pricing adjustments during shoulder and low seasons. Explore the typical Airbnb income in Breaux Bridge across different performance tiers:
- Best-in-class properties (Top 10%) achieve $2,970+ monthly, often utilizing dynamic pricing and superior guest experiences.
- Strong performing properties (Top 25%) earn $2,051 or more, indicating effective management and desirable locations/amenities.
- Typical properties (Median) generate around $1,143 per month, representing the average market performance.
- Entry-level properties (Bottom 25%) see earnings around $591, often with potential for optimization.
Average Monthly Airbnb Earnings Trend in Breaux Bridge
Breaux Bridge Airbnb Occupancy Rate Trends (2026)
Maximize your bookings by understanding the Breaux Bridge STR occupancy trends. Seasonal demand shifts significantly influence how often properties are booked. Typically, Aprilsees the highest demand (peak season occupancy), while January experiences the lowest (low season). Effective strategies, like adjusting minimum stays or offering promotions, can boost occupancy during slower periods. Here's how different property tiers perform in Breaux Bridge:
- Best-in-class properties (Top 10%) achieve 66%+ occupancy, indicating high desirability and potentially optimized availability.
- Strong performing properties (Top 25%) maintain 48% or higher occupancy, suggesting good market fit and guest satisfaction.
- Typical properties (Median) have an occupancy rate around 30%.
- Entry-level properties (Bottom 25%) average 15% occupancy, potentially facing higher vacancy.
Average Monthly Occupancy Rate Trend in Breaux Bridge
Average Daily Rate (ADR) Airbnb Trends in Breaux Bridge (2026)
Effective short term rental pricing strategy in Breaux Bridge involves understanding monthly ADR fluctuations. The Average Daily Rate (ADR) for Airbnb in Breaux Bridge typically peaks in October and dips lowest during March. Leveraging Airbnb dynamic pricing tools or strategies based on this seasonality can significantly boost revenue. Here's a look at the typical nightly rates achieved:
- Best-in-class properties (Top 10%) command rates of $248+ per night, often due to premium features or locations.
- Strong performing properties (Top 25%) achieve nightly rates of $169 or more.
- Typical properties (Median) charge around $127 per night.
- Entry-level properties (Bottom 25%) earn around $107 per night.
Average Daily Rate (ADR) Trend by Month in Breaux Bridge
Get Live Breaux Bridge Market Intelligence 👇

Explore Real-time Analytics
Airbnb Seasonality Analysis & Trends in Breaux Bridge (2026)
Peak Season (March, April, May)
- Revenue averages $1,791 per month
- Occupancy rates average 39.5%
- Daily rates average $140
Shoulder Season
- Revenue averages $1,518 per month
- Occupancy maintains around 34.2%
- Daily rates hold near $149
Low Season (January, August, September)
- Revenue drops to average $1,106 per month
- Occupancy decreases to average 26.6%
- Daily rates adjust to average $147
Seasonality Insights for Breaux Bridge
- The Airbnb seasonality in Breaux Bridge shows moderate seasonality with distinct peak and low periods. While the sections above show seasonal averages, it's also insightful to look at the extremes:
- During the high season, the absolute peak month showcases Breaux Bridge's highest earning potential, with monthly revenues capable of climbing to $1,843, occupancy reaching a high of 42.3%, and ADRs peaking at $156.
- Conversely, the slowest single month of the year, typically falling within the low season, marks the market's lowest point. In this month, revenue might dip to $1,070, occupancy could drop to 25.9%, and ADRs may adjust down to $138.
- Understanding both the seasonal averages and these monthly peaks and troughs in revenue, occupancy, and ADR is crucial for maximizing your Airbnb profit potential in Breaux Bridge.
Seasonal Strategies for Maximizing Profit
- Peak Season: Maximize revenue through premium pricing and potentially longer minimum stays. Ensure high availability.
- Low Season: Offer competitive pricing, special promotions (e.g., extended stay discounts), and flexible cancellation policies. Target off-season travelers like remote workers or budget-conscious guests.
- Shoulder Seasons: Implement dynamic pricing that balances peak and low rates. Target weekend travelers or specific events. Offer slightly more flexible terms than peak season.
- Regularly analyze your own performance against these Breaux Bridge seasonality benchmarks and adjust your pricing and availability strategy accordingly.
Best Areas for Airbnb Investment in Breaux Bridge (2026)
Exploring the top neighborhoods for short-term rentals in Breaux Bridge? This section highlights key areas, outlining why they are attractive for hosts and guests, along with notable local attractions. Consider these locations based on your target guest profile and investment strategy.
| Neighborhood / Area | Why Host Here? (Target Guests & Appeal) | Key Attractions & Landmarks |
|---|---|---|
| Lake Martin | A stunning natural area perfect for outdoor enthusiasts. With its picturesque cypress trees and diverse wildlife, it attracts visitors for kayaking, fishing, and bird watching. | Cypress Island Preserve, Lake Martin Heritage Area, Bird Watching Tours, Kayaking, Fishing |
| Breaux Bridge Historic District | Known for its charming small-town Louisiana vibe, this area is rich in history and culture, making it ideal for visitors interested in Cajun heritage and local cuisine. | Breaux Bridge Historic District, Cajun restaurants, Local festivals, Art galleries, Shops |
| Atchafalaya Basin | The largest swamp in the US, offering breathtaking scenery and abundant wildlife. A great spot for outdoor activities, attracting tourists who want to explore the Cajun landscape. | Atchafalaya National Heritage Area, Swamp Tours, Fishing and Hunting, Wildlife Observation, Hiking Trails |
| St. Martinville | A nearby town with a rich history and cultural significance, St. Martinville draws guests interested in the history of the Acadians and local attractions. | Evangeline Oak, St. Martin de Tours Church, Acadian Memorial, Local History Museums, Cultural Festivals |
| Palmetto Island State Park | A beautiful state park offering camping, fishing, and hiking opportunities. Visitors come here for nature and outdoor activities away from urban life. | Campground, Hiking Trails, Fishing, Wildlife, Picnicking |
| Lafayette | Just a short drive away, Lafayette is a cultural hub of Cajun and Creole culture, attracting visitors for its music scene and culinary experiences. | University of Louisiana at Lafayette, Acadian Village, Lafayette Science Museum, Local music venues, Culinary tours |
| New Iberia | Known for its beautiful plantation homes and the tabasco factory, New Iberia attracts tourists interested in history and food. | Shadows-on-the-Teche, Tabasco Factory Tour, Jefferson Island, Local historic sites, Bayou Teche |
| Sattler Hill | A tranquil suburban neighborhood that's becoming popular with families and visitors seeking peace and quiet, while still being close to Breaux Bridge's attractions. | Residential areas, Parks, Quiet suburban vibe, Access to local amenities, Family-friendly environment |
Understanding Airbnb License Requirements & STR Laws in Breaux Bridge (2026)
While Breaux Bridge, Louisiana, United States currently shows low STR regulations, specific Airbnb license requirements might still exist or change. Always verify the latest short term rental regulations and Airbnb license requirements directly with local government authorities for Breaux Bridge to ensure full compliance before hosting.
(Source: AirROI data, 2026, finding no licensed listings among those analyzed)
Top Performing Airbnb Properties in Breaux Bridge (2026)
Benchmark your potential! Explore examples of top-performing Airbnb properties in Breaux Bridgebased on Trailing Twelve Month (TTM) revenue. Analyze their characteristics, revenue, occupancy rate, and ADR to understand what drives success in this market.

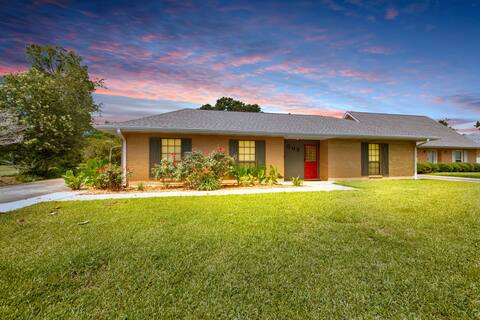
A spacious 4 bedroom home with a pool!
Entire Place • 4 bedrooms
Walk To Restaurants, Bars & Shops Breaux Bridge
Entire Place • 3 bedrooms

Butte La Rose Camp "Something to Crow About"
Entire Place • 3 bedrooms

Cajun Rose
Entire Place • 3 bedrooms

Maison Isabelle
Entire Place • 2 bedrooms

Rose Haven
Entire Place • 2 bedrooms
Note: Performance varies based on location, size, amenities, seasonality, and management quality. Data reflects the past 12 months.
Top Performing Airbnb Hosts in Breaux Bridge (2026)
Learn from the best! This table showcases top-performing Airbnb hosts in Breaux Bridge based on the number of properties managed and estimated total revenue over the past year. Analyze their scale and performance metrics.
| Host Name | Properties | Grossing Revenue | Stay Reviews | Avg Rating |
|---|---|---|---|---|
| Paul | 1 | $65,620 | 106 | 5.00/5.0 |
| Sandra | 2 | $58,901 | 142 | 4.96/5.0 |
| Debora | 6 | $51,706 | 188 | 4.90/5.0 |
| Candy Renee | 3 | $40,588 | 180 | 4.94/5.0 |
| Jennifer | 2 | $39,880 | 185 | 5.00/5.0 |
| Linni Tolmachoff | 3 | $37,046 | 480 | 4.97/5.0 |
| Tressie | 5 | $36,582 | 54 | 4.95/5.0 |
| Kelly | 2 | $33,866 | 145 | 4.99/5.0 |
| Babette | 1 | $31,248 | 39 | 4.97/5.0 |
| Betsy Plouhar | 1 | $30,414 | 165 | 4.85/5.0 |
Analyzing the strategies of top hosts, such as their property selection, pricing, and guest communication, can offer valuable lessons for optimizing your own Airbnb operations in Breaux Bridge.
Dive Deeper: Advanced Breaux Bridge STR Market Data (2026)
Ready to unlock more insights? AirROI provides access to advanced metrics and comprehensive Airbnb data for Breaux Bridge. Explore detailed analytics beyond this report to refine your investment strategy, optimize pricing, and maximize your vacation rental profits.
Explore Advanced MetricsBreaux Bridge Short-Term Rental Market Composition (2026): Property & Room Types
Room Type Distribution
Property Type Distribution
Market Composition Insights for Breaux Bridge
- The Breaux Bridge Airbnb market composition is heavily skewed towards Entire Home/Apt listings, which make up 76.8% of the 69 active rentals. This indicates strong guest preference for privacy and space.
- Looking at the property type distribution in Breaux Bridge, House properties are the most common (62.3%), reflecting the local real estate landscape.
- Houses represent a significant 62.3% portion, catering likely to families or larger groups.
- The presence of 14.5% Hotel/Boutique listings indicates integration with traditional hospitality.
Breaux Bridge Airbnb Room Capacity Analysis (2026): Bedroom Distribution
Distribution of Listings by Number of Bedrooms
Room Capacity Insights for Breaux Bridge
- The dominant room capacity in Breaux Bridge is 1 bedroom listings, making up 43.5% of the market. This suggests a strong demand for properties suitable for couples or solo travelers.
- Together, 1 bedroom and 2 bedrooms properties represent 60.9% of the active Airbnb listings in Breaux Bridge, indicating a high concentration in these sizes.
- A significant 24.6% of listings offer 3+ bedrooms, catering to larger groups and families seeking more space in Breaux Bridge.
Breaux Bridge Vacation Rental Guest Capacity Trends (2026)
Distribution of Listings by Guest Capacity
Guest Capacity Insights for Breaux Bridge
- The most common guest capacity trend in Breaux Bridge vacation rentals is listings accommodating 2 guests (27.5%). This suggests the primary traveler segment is likely couples or solo travelers.
- Properties designed for 2 guests and 8+ guests dominate the Breaux Bridge STR market, accounting for 44.9% of listings.
- 33.3% of properties accommodate 6+ guests, serving the market segment for larger families or group travel in Breaux Bridge.
- On average, properties in Breaux Bridge are equipped to host 3.9 guests.
Breaux Bridge Airbnb Booking Patterns (2026): Available vs. Booked Days
Available Days Distribution
Booked Days Distribution
Booking Pattern Insights for Breaux Bridge
- The most common availability pattern in Breaux Bridge falls within the 271-366 days range, representing 55.1% of listings. This suggests many properties have significant open periods on their calendars.
- Approximately 91.3% of listings show high availability (181+ days open annually), indicating potential for increased bookings or specific owner usage patterns.
- For booked days, the 31-90 days range is most frequent in Breaux Bridge (39.1%), reflecting common guest stay durations or potential owner blocking patterns.
- A notable 8.7% of properties secure long booking periods (181+ days booked per year), highlighting successful long-term rental strategies or significant owner usage.
Breaux Bridge Airbnb Minimum Stay Requirements Analysis
Distribution of Listings by Minimum Night Requirement
1 Night
34 listings
49.3% of total
2 Nights
17 listings
24.6% of total
3 Nights
1 listings
1.4% of total
4-6 Nights
2 listings
2.9% of total
30+ Nights
15 listings
21.7% of total
Key Insights
- The most prevalent minimum stay requirement in Breaux Bridge is 1 Night, adopted by 49.3% of listings. This highlights the market's preference for shorter, flexible bookings.
- A strong majority (73.9%) of the Breaux Bridge Airbnb data shows acceptance of very short stays (1-2 nights), indicating a dynamic, high-turnover market.
- A significant segment (21.7%) caters to monthly stays (30+ nights) in Breaux Bridge, pointing to opportunities in the extended-stay market.
Recommendations
- Align with the market by considering a 1 Night minimum stay, as 49.3% of Breaux Bridge hosts use this setting.
- Explore offering discounts for stays of 30+ nights to attract the 21.7% of the market seeking extended stays.
- Adjust minimum nights based on seasonality – potentially shorter during low season and longer during peak demand periods in Breaux Bridge.
Breaux Bridge Airbnb Cancellation Policy Trends Analysis (2026)
Flexible
18 listings
26.1% of total
Moderate
22 listings
31.9% of total
Firm
21 listings
30.4% of total
Strict
8 listings
11.6% of total
Cancellation Policy Insights for Breaux Bridge
- The prevailing Airbnb cancellation policy trend in Breaux Bridge is Moderate, used by 31.9% of listings.
- There's a relatively balanced mix between guest-friendly (58.0%) and stricter (42.0%) policies, offering choices for different guest needs.
Recommendations for Hosts
- Consider adopting a Moderate policy to align with the 31.9% market standard in Breaux Bridge.
- Using a Strict policy might deter some guests, as only 11.6% of listings use it. Evaluate if potential revenue protection outweighs possible lower booking rates.
- Regularly review your cancellation policy against competitors and market demand shifts in Breaux Bridge.
Breaux Bridge STR Booking Lead Time Analysis (2026)
Average Booking Lead Time by Month
Booking Lead Time Insights for Breaux Bridge
- The overall average booking lead time for vacation rentals in Breaux Bridge is 51 days.
- Guests book furthest in advance for stays during April (average 99 days), likely coinciding with peak travel demand or local events.
- The shortest booking windows occur for stays in January (average 25 days), indicating more last-minute travel plans during this time.
- Seasonally, Spring (71 days avg.) sees the longest lead times, while Summer (28 days avg.) has the shortest, reflecting typical travel planning cycles.
Recommendations for Hosts
- Use the overall average lead time (51 days) as a baseline for your pricing and availability strategy in Breaux Bridge.
- For April stays, consider implementing length-of-stay discounts or slightly higher rates for bookings made less than 99 days out to capitalize on advance planning.
- Target marketing efforts for the Spring season well in advance (at least 71 days) to capture early planners.
- Monitor your own booking lead times against these Breaux Bridge averages to identify opportunities for dynamic pricing adjustments.
Popular & Essential Airbnb Amenities in Breaux Bridge (2026)
Amenity Prevalence
Amenity Insights for Breaux Bridge
- Essential amenities in Breaux Bridge that guests expect include: Wifi. Lacking these (this) could significantly impact bookings.
- Popular amenities like Air conditioning, Heating, Smoke alarm are common but not universal. Offering these can provide a competitive edge.
Recommendations for Hosts
- Ensure your listing includes all essential amenities for Breaux Bridge: Wifi.
- Prioritize adding missing essentials: Wifi.
- Consider adding popular differentiators like Air conditioning or Heating to increase appeal.
- Highlight unique or less common amenities you offer (e.g., hot tub, dedicated workspace, EV charger) in your listing description and photos.
- Regularly check competitor amenities in Breaux Bridge to stay competitive.
Breaux Bridge Airbnb Guest Demographics & Profile Analysis (2026)
Guest Profile Summary for Breaux Bridge
- The typical guest profile for Airbnb in Breaux Bridge consists of primarily domestic travelers (87%), often arriving from nearby Lafayette, typically belonging to the Post-2000s (Gen Z/Alpha) group (50%), primarily speaking English or Spanish.
- Domestic travelers account for 86.9% of guests.
- Key international markets include United States (86.9%) and France (3.2%).
- Top languages spoken are English (67.5%) followed by Spanish (10.6%).
- A significant demographic segment is the Post-2000s (Gen Z/Alpha) group, representing 50% of guests.
Recommendations for Hosts
- Target domestic marketing efforts towards travelers from Lafayette and Houston.
- Tailor amenities and listing descriptions to appeal to the dominant Post-2000s (Gen Z/Alpha) demographic (e.g., highlight fast WiFi, smart home features, local guides).
- Highlight unique local experiences or amenities relevant to the primary guest profile.
- Consider seasonal promotions aligned with peak travel times for key origin markets.
Nearby Short-Term Rental Market Comparison
How does the Breaux Bridge Airbnb market stack up against its neighbors? Compare key performance metrics like average monthly revenue, ADR, and occupancy rates in surrounding areas to understand the broader regional STR landscape.
| Market | Active Properties | Monthly Revenue | Daily Rate | Avg. Occupancy |
|---|---|---|---|---|
| New Orleans | 4,857 | $3,260 | $298.03 | 42% |
| Grand Isle | 106 | $3,149 | $432.40 | 32% |
| Killian | 14 | $3,089 | $360.39 | 37% |
| New Roads | 27 | $2,790 | $361.00 | 32% |
| Ponchatoula | 49 | $2,512 | $231.70 | 39% |
| Covington | 65 | $2,427 | $204.72 | 47% |
| St. George | 70 | $2,194 | $231.63 | 40% |
| Gonzales | 37 | $2,142 | $175.66 | 44% |
| Arabi | 65 | $2,113 | $240.25 | 39% |
| Abita Springs | 19 | $2,111 | $189.00 | 42% |