Baton Rouge Airbnb Market Analysis 2026: Short Term Rental Data & Vacation Rental Statistics in Louisiana, United States
Is Airbnb profitable in Baton Rouge in 2026? Explore comprehensive Airbnb analytics for Baton Rouge, Louisiana, United States to uncover income potential. This 2026 STR market report for Baton Rouge, based on AirROI data from February 2025 to January 2026, reveals key trends in the market of 642 active listings.
Whether you're considering an Airbnb investment in Baton Rouge, optimizing your existing vacation rental, or exploring rental arbitrage opportunities, understanding the Baton Rouge Airbnb data is crucial. Leveraging the low regulation environment is key to maximizing your short term rental income potential. Let's dive into the specifics.
Key Baton Rouge Airbnb Performance Metrics Overview
Monthly Airbnb Revenue Variations & Income Potential in Baton Rouge (2026)
Understanding the monthly revenue variations for Airbnb listings in Baton Rouge is key to maximizing your short term rental income potential. Seasonality significantly impacts earnings. Our analysis, based on data from the past 12 months, shows that the peak revenue month for STRs in Baton Rouge is typically July, while January often presents the lowest earnings, highlighting opportunities for strategic pricing adjustments during shoulder and low seasons. Explore the typical Airbnb income in Baton Rouge across different performance tiers:
- Best-in-class properties (Top 10%) achieve $4,882+ monthly, often utilizing dynamic pricing and superior guest experiences.
- Strong performing properties (Top 25%) earn $3,299 or more, indicating effective management and desirable locations/amenities.
- Typical properties (Median) generate around $2,034 per month, representing the average market performance.
- Entry-level properties (Bottom 25%) see earnings around $1,031, often with potential for optimization.
Average Monthly Airbnb Earnings Trend in Baton Rouge
Baton Rouge Airbnb Occupancy Rate Trends (2026)
Maximize your bookings by understanding the Baton Rouge STR occupancy trends. Seasonal demand shifts significantly influence how often properties are booked. Typically, Marchsees the highest demand (peak season occupancy), while January experiences the lowest (low season). Effective strategies, like adjusting minimum stays or offering promotions, can boost occupancy during slower periods. Here's how different property tiers perform in Baton Rouge:
- Best-in-class properties (Top 10%) achieve 77%+ occupancy, indicating high desirability and potentially optimized availability.
- Strong performing properties (Top 25%) maintain 62% or higher occupancy, suggesting good market fit and guest satisfaction.
- Typical properties (Median) have an occupancy rate around 42%.
- Entry-level properties (Bottom 25%) average 23% occupancy, potentially facing higher vacancy.
Average Monthly Occupancy Rate Trend in Baton Rouge
Average Daily Rate (ADR) Airbnb Trends in Baton Rouge (2026)
Effective short term rental pricing strategy in Baton Rouge involves understanding monthly ADR fluctuations. The Average Daily Rate (ADR) for Airbnb in Baton Rouge typically peaks in November and dips lowest during April. Leveraging Airbnb dynamic pricing tools or strategies based on this seasonality can significantly boost revenue. Here's a look at the typical nightly rates achieved:
- Best-in-class properties (Top 10%) command rates of $333+ per night, often due to premium features or locations.
- Strong performing properties (Top 25%) achieve nightly rates of $230 or more.
- Typical properties (Median) charge around $162 per night.
- Entry-level properties (Bottom 25%) earn around $106 per night.
Average Daily Rate (ADR) Trend by Month in Baton Rouge
Get Live Baton Rouge Market Intelligence 👇

Explore Real-time Analytics
Airbnb Seasonality Analysis & Trends in Baton Rouge (2026)
Peak Season (July, October, March)
- Revenue averages $2,796 per month
- Occupancy rates average 47.5%
- Daily rates average $193
Shoulder Season
- Revenue averages $2,498 per month
- Occupancy maintains around 42.6%
- Daily rates hold near $197
Low Season (January, February, August)
- Revenue drops to average $2,064 per month
- Occupancy decreases to average 40.0%
- Daily rates adjust to average $185
Seasonality Insights for Baton Rouge
- The Airbnb seasonality in Baton Rouge shows moderate seasonality with distinct peak and low periods. While the sections above show seasonal averages, it's also insightful to look at the extremes:
- During the high season, the absolute peak month showcases Baton Rouge's highest earning potential, with monthly revenues capable of climbing to $2,862, occupancy reaching a high of 54.1%, and ADRs peaking at $220.
- Conversely, the slowest single month of the year, typically falling within the low season, marks the market's lowest point. In this month, revenue might dip to $1,716, occupancy could drop to 30.5%, and ADRs may adjust down to $172.
- Understanding both the seasonal averages and these monthly peaks and troughs in revenue, occupancy, and ADR is crucial for maximizing your Airbnb profit potential in Baton Rouge.
Seasonal Strategies for Maximizing Profit
- Peak Season: Maximize revenue through premium pricing and potentially longer minimum stays. Ensure high availability.
- Low Season: Offer competitive pricing, special promotions (e.g., extended stay discounts), and flexible cancellation policies. Target off-season travelers like remote workers or budget-conscious guests.
- Shoulder Seasons: Implement dynamic pricing that balances peak and low rates. Target weekend travelers or specific events. Offer slightly more flexible terms than peak season.
- Regularly analyze your own performance against these Baton Rouge seasonality benchmarks and adjust your pricing and availability strategy accordingly.
Best Areas for Airbnb Investment in Baton Rouge (2026)
Exploring the top neighborhoods for short-term rentals in Baton Rouge? This section highlights key areas, outlining why they are attractive for hosts and guests, along with notable local attractions. Consider these locations based on your target guest profile and investment strategy.
| Neighborhood / Area | Why Host Here? (Target Guests & Appeal) | Key Attractions & Landmarks |
|---|---|---|
| Downtown Baton Rouge | The vibrant core of the city, filled with history and culture. Ideal for visitors exploring governmental sites, museums, and local dining options. | Louisiana State Capitol, Old State Capitol, Baton Rouge River Center, USS Kidd, L'Auberge Casino Resort |
| LSU Campus Area | A lively area around Louisiana State University, popular with students, families, and visitors attending events and games. | Tiger Stadium, Mike the Tiger Habitat, LSU Museum of Art, Student Union, Reilly Food Court |
| Mid City | A trendy area known for its eclectic shops, art, and dining scene. Attracts a mix of locals and visitors looking for a unique experience. | Mid City Market, Cottage Cafe, Baton Rouge Gallery, Baton Rouge Arts Market, Red Stick Farmers Market |
| Garden District | A historic neighborhood featuring beautiful homes, lush gardens, and tree-lined streets. Excellent for visitors seeking charm and tranquility. | Magnolia Mound Plantation, Rose Garden at the Botanic Gardens, Historic homes, Baton Rouge Zoo, City Park |
| Spanish Town | Known for its colorful houses and annual Mardi Gras celebrations, this quirky neighborhood offers a glimpse into the local culture and arts. | Spanish Town Mardi Gras, Spanish Town Market, Local Art Installations, Historic Homes, Neighborhood Festivals |
| Zachary | A suburban area just north of Baton Rouge known for its family-friendly atmosphere and access to local attractions, great for longer stays. | Parks and Recreation Areas, Zachary Historical Association, Local Shopping, Community Events, Outdoor Recreation Areas |
| Port Allen | A nearby community across the Mississippi River, offering affordable lodging and unique access to both Baton Rouge and rural attractions. | West Baton Rouge Museum, Mississippi River Levee, Fishing and Boating Areas, Local Restaurants, Louisiana Southern University |
| Baton Rouge Waterfront | A scenic area along the river with entertainment venues, dining, and leisure activities. Great for tourists wanting a relaxing getaway. | Riverfront Plaza, Beer and Wine Festivals, Boat Tours, Local Dining, Live Music Venues |
Understanding Airbnb License Requirements & STR Laws in Baton Rouge (2026)
While Baton Rouge, Louisiana, United States currently shows low STR regulations, specific Airbnb license requirements might still exist or change. Always verify the latest short term rental regulations and Airbnb license requirements directly with local government authorities for Baton Rouge to ensure full compliance before hosting.
(Source: AirROI data, 2026, based on 0% licensed listings)
Top Performing Airbnb Properties in Baton Rouge (2026)
Benchmark your potential! Explore examples of top-performing Airbnb properties in Baton Rougebased on Trailing Twelve Month (TTM) revenue. Analyze their characteristics, revenue, occupancy rate, and ADR to understand what drives success in this market.

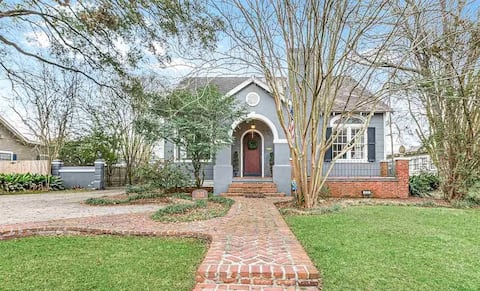
Beautiful Quiet Cozy Home Near LSU and Downtown
Entire Place • 3 bedrooms
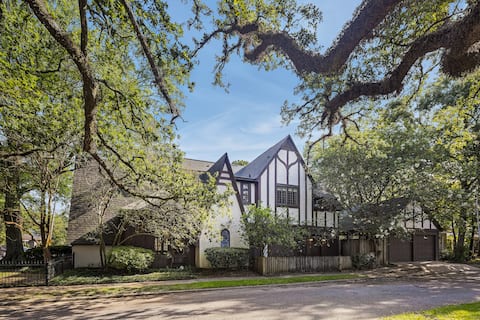
“The Stanford House” 4BR,3BA Great Location
Entire Place • 4 bedrooms
Modern 4 bed/ 3.5 bath home with heated pool.
Entire Place • 4 bedrooms
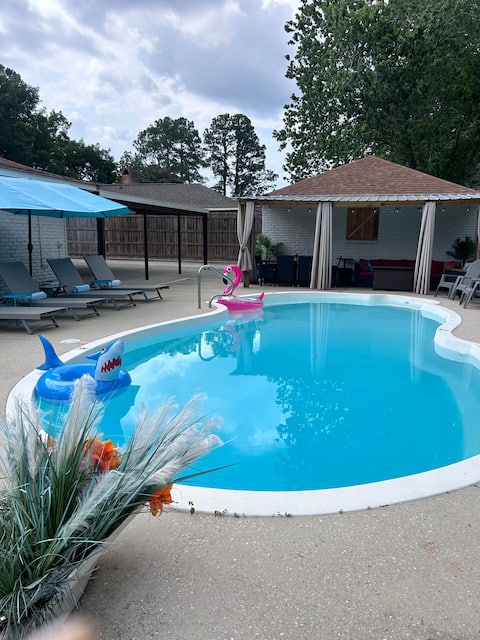
3+ BR Hospitality Haven, Sleeps 12, Heated Pool!
Entire Place • 3 bedrooms

Old Nicholson Manor Near LSU | 6 Bedrooms
Entire Place • 6 bedrooms

Perfect gathering home near LSU & City Park!
Entire Place • 4 bedrooms
Note: Performance varies based on location, size, amenities, seasonality, and management quality. Data reflects the past 12 months.
Top Performing Airbnb Hosts in Baton Rouge (2026)
Learn from the best! This table showcases top-performing Airbnb hosts in Baton Rouge based on the number of properties managed and estimated total revenue over the past year. Analyze their scale and performance metrics.
| Host Name | Properties | Grossing Revenue | Stay Reviews | Avg Rating |
|---|---|---|---|---|
| Sweetlife Homes | 22 | $771,375 | 601 | 4.88/5.0 |
| Tommy | 15 | $455,927 | 1552 | 4.78/5.0 |
| Kelsey | 14 | $329,085 | 703 | 4.89/5.0 |
| Dani & Jacob | 8 | $279,004 | 519 | 4.82/5.0 |
| Blake | 5 | $253,895 | 205 | 4.92/5.0 |
| Paul | 19 | $243,150 | 922 | 4.71/5.0 |
| Erika | 6 | $230,439 | 471 | 4.88/5.0 |
| John | 7 | $225,008 | 439 | 4.94/5.0 |
| James | 13 | $175,493 | 246 | 4.79/5.0 |
| Lance | 3 | $149,680 | 554 | 4.93/5.0 |
Analyzing the strategies of top hosts, such as their property selection, pricing, and guest communication, can offer valuable lessons for optimizing your own Airbnb operations in Baton Rouge.
Dive Deeper: Advanced Baton Rouge STR Market Data (2026)
Ready to unlock more insights? AirROI provides access to advanced metrics and comprehensive Airbnb data for Baton Rouge. Explore detailed analytics beyond this report to refine your investment strategy, optimize pricing, and maximize your vacation rental profits.
Explore Advanced MetricsBaton Rouge Short-Term Rental Market Composition (2026): Property & Room Types
Room Type Distribution
Property Type Distribution
Market Composition Insights for Baton Rouge
- The Baton Rouge Airbnb market composition is heavily skewed towards Entire Home/Apt listings, which make up 91.1% of the 642 active rentals. This indicates strong guest preference for privacy and space.
- Looking at the property type distribution in Baton Rouge, House properties are the most common (62.3%), reflecting the local real estate landscape.
- Houses represent a significant 62.3% portion, catering likely to families or larger groups.
- The presence of 5.6% Hotel/Boutique listings indicates integration with traditional hospitality.
- Smaller segments like others, outdoor/unique (combined 1.9%) offer potential for unique stay experiences.
Baton Rouge Airbnb Room Capacity Analysis (2026): Bedroom Distribution
Distribution of Listings by Number of Bedrooms
Room Capacity Insights for Baton Rouge
- The dominant room capacity in Baton Rouge is 3 bedrooms listings, making up 30.5% of the market. This suggests a strong demand for properties suitable for families or small groups.
- Together, 3 bedrooms and 2 bedrooms properties represent 56.5% of the active Airbnb listings in Baton Rouge, indicating a high concentration in these sizes.
- A significant 41.1% of listings offer 3+ bedrooms, catering to larger groups and families seeking more space in Baton Rouge.
Baton Rouge Vacation Rental Guest Capacity Trends (2026)
Distribution of Listings by Guest Capacity
Guest Capacity Insights for Baton Rouge
- The most common guest capacity trend in Baton Rouge vacation rentals is listings accommodating 8+ guests (22%). This suggests the primary traveler segment is likely larger groups.
- Properties designed for 8+ guests and 4 guests dominate the Baton Rouge STR market, accounting for 43.7% of listings.
- 46.6% of properties accommodate 6+ guests, serving the market segment for larger families or group travel in Baton Rouge.
- On average, properties in Baton Rouge are equipped to host 4.8 guests.
Baton Rouge Airbnb Booking Patterns (2026): Available vs. Booked Days
Available Days Distribution
Booked Days Distribution
Booking Pattern Insights for Baton Rouge
- The most common availability pattern in Baton Rouge falls within the 271-366 days range, representing 39.4% of listings. This suggests many properties have significant open periods on their calendars.
- Approximately 77.9% of listings show high availability (181+ days open annually), indicating potential for increased bookings or specific owner usage patterns.
- For booked days, the 91-180 days range is most frequent in Baton Rouge (38.5%), reflecting common guest stay durations or potential owner blocking patterns.
- A notable 23.8% of properties secure long booking periods (181+ days booked per year), highlighting successful long-term rental strategies or significant owner usage.
Baton Rouge Airbnb Minimum Stay Requirements Analysis
Distribution of Listings by Minimum Night Requirement
1 Night
189 listings
29.4% of total
2 Nights
223 listings
34.7% of total
3 Nights
21 listings
3.3% of total
4-6 Nights
25 listings
3.9% of total
7-29 Nights
27 listings
4.2% of total
30+ Nights
157 listings
24.5% of total
Key Insights
- The most prevalent minimum stay requirement in Baton Rouge is 2 Nights, adopted by 34.7% of listings. This highlights the market's preference for shorter, flexible bookings.
- A strong majority (64.1%) of the Baton Rouge Airbnb data shows acceptance of very short stays (1-2 nights), indicating a dynamic, high-turnover market.
- A significant segment (24.5%) caters to monthly stays (30+ nights) in Baton Rouge, pointing to opportunities in the extended-stay market.
Recommendations
- Align with the market by considering a 2 Nights minimum stay, as 34.7% of Baton Rouge hosts use this setting.
- If feasible, allowing 1-night stays, especially midweek or during low season, could capture last-minute bookings, as only 29.4% currently do.
- Explore offering discounts for stays of 30+ nights to attract the 24.5% of the market seeking extended stays.
- Adjust minimum nights based on seasonality – potentially shorter during low season and longer during peak demand periods in Baton Rouge.
Baton Rouge Airbnb Cancellation Policy Trends Analysis (2026)
Super Strict 30 Days
1 listings
0.2% of total
Super Strict 60 Days
1 listings
0.2% of total
Limited
22 listings
3.4% of total
Flexible
155 listings
24.2% of total
Moderate
180 listings
28.1% of total
Firm
213 listings
33.2% of total
Strict
69 listings
10.8% of total
Cancellation Policy Insights for Baton Rouge
- The prevailing Airbnb cancellation policy trend in Baton Rouge is Firm, used by 33.2% of listings.
- There's a relatively balanced mix between guest-friendly (52.3%) and stricter (44.0%) policies, offering choices for different guest needs.
Recommendations for Hosts
- Consider adopting a Firm policy to align with the 33.2% market standard in Baton Rouge.
- Using a Strict policy might deter some guests, as only 10.8% of listings use it. Evaluate if potential revenue protection outweighs possible lower booking rates.
- Regularly review your cancellation policy against competitors and market demand shifts in Baton Rouge.
Baton Rouge STR Booking Lead Time Analysis (2026)
Average Booking Lead Time by Month
Booking Lead Time Insights for Baton Rouge
- The overall average booking lead time for vacation rentals in Baton Rouge is 42 days.
- Guests book furthest in advance for stays during October (average 71 days), likely coinciding with peak travel demand or local events.
- The shortest booking windows occur for stays in January (average 24 days), indicating more last-minute travel plans during this time.
- Seasonally, Fall (61 days avg.) sees the longest lead times, while Winter (28 days avg.) has the shortest, reflecting typical travel planning cycles.
Recommendations for Hosts
- Use the overall average lead time (42 days) as a baseline for your pricing and availability strategy in Baton Rouge.
- For October stays, consider implementing length-of-stay discounts or slightly higher rates for bookings made less than 71 days out to capitalize on advance planning.
- Target marketing efforts for the Fall season well in advance (at least 61 days) to capture early planners.
- Monitor your own booking lead times against these Baton Rouge averages to identify opportunities for dynamic pricing adjustments.
Popular & Essential Airbnb Amenities in Baton Rouge (2026)
Amenity Prevalence
Amenity Insights for Baton Rouge
- Essential amenities in Baton Rouge that guests expect include: Wifi, Air conditioning, TV, Smoke alarm, Free parking on premises. Lacking these (any) could significantly impact bookings.
- Popular amenities like Kitchen, Heating, Hot water are common but not universal. Offering these can provide a competitive edge.
Recommendations for Hosts
- Ensure your listing includes all essential amenities for Baton Rouge: Wifi, Air conditioning, TV, Smoke alarm, Free parking on premises.
- Prioritize adding missing essentials: Wifi, Air conditioning, TV, Smoke alarm, Free parking on premises.
- Consider adding popular differentiators like Kitchen or Heating to increase appeal.
- Highlight unique or less common amenities you offer (e.g., hot tub, dedicated workspace, EV charger) in your listing description and photos.
- Regularly check competitor amenities in Baton Rouge to stay competitive.
Baton Rouge Airbnb Guest Demographics & Profile Analysis (2026)
Guest Profile Summary for Baton Rouge
- The typical guest profile for Airbnb in Baton Rouge consists of primarily domestic travelers (96%), often arriving from nearby Baton Rouge, typically belonging to the Post-2000s (Gen Z/Alpha) group (50%), primarily speaking English or Spanish.
- Domestic travelers account for 96.1% of guests.
- Key international markets include United States (96.1%) and DC (0.7%).
- Top languages spoken are English (77.9%) followed by Spanish (11.7%).
- A significant demographic segment is the Post-2000s (Gen Z/Alpha) group, representing 50% of guests.
Recommendations for Hosts
- Target domestic marketing efforts towards travelers from Baton Rouge and Houston.
- Tailor amenities and listing descriptions to appeal to the dominant Post-2000s (Gen Z/Alpha) demographic (e.g., highlight fast WiFi, smart home features, local guides).
- Highlight unique local experiences or amenities relevant to the primary guest profile.
- Consider seasonal promotions aligned with peak travel times for key origin markets.
Nearby Short-Term Rental Market Comparison
How does the Baton Rouge Airbnb market stack up against its neighbors? Compare key performance metrics like average monthly revenue, ADR, and occupancy rates in surrounding areas to understand the broader regional STR landscape.
| Market | Active Properties | Monthly Revenue | Daily Rate | Avg. Occupancy |
|---|---|---|---|---|
| New Orleans | 4,857 | $3,260 | $298.03 | 42% |
| Grand Isle | 106 | $3,149 | $432.40 | 32% |
| Killian | 14 | $3,089 | $360.39 | 37% |
| New Roads | 27 | $2,790 | $361.00 | 32% |
| Ponchatoula | 49 | $2,512 | $231.70 | 39% |
| Covington | 65 | $2,427 | $204.72 | 47% |
| St. George | 70 | $2,194 | $231.63 | 40% |
| Gonzales | 37 | $2,142 | $175.66 | 44% |
| Arabi | 65 | $2,113 | $240.25 | 39% |
| Abita Springs | 19 | $2,111 | $189.00 | 42% |