Wolfe County Airbnb Market Analysis 2026: Short Term Rental Data & Vacation Rental Statistics in Kentucky, United States
Is Airbnb profitable in Wolfe County in 2026? Explore comprehensive Airbnb analytics for Wolfe County, Kentucky, United States to uncover income potential. This 2026 STR market report for Wolfe County, based on AirROI data from February 2025 to January 2026, reveals key trends in the niche market of 66 active listings.
Whether you're considering an Airbnb investment in Wolfe County, optimizing your existing vacation rental, or exploring rental arbitrage opportunities, understanding the Wolfe County Airbnb data is crucial. Leveraging the low regulation environment is key to maximizing your short term rental income potential. Let's dive into the specifics.
Key Wolfe County Airbnb Performance Metrics Overview
Monthly Airbnb Revenue Variations & Income Potential in Wolfe County (2026)
Understanding the monthly revenue variations for Airbnb listings in Wolfe County is key to maximizing your short term rental income potential. Seasonality significantly impacts earnings. Our analysis, based on data from the past 12 months, shows that the peak revenue month for STRs in Wolfe County is typically October, while January often presents the lowest earnings, highlighting opportunities for strategic pricing adjustments during shoulder and low seasons. Explore the typical Airbnb income in Wolfe County across different performance tiers:
- Best-in-class properties (Top 10%) achieve $6,422+ monthly, often utilizing dynamic pricing and superior guest experiences.
- Strong performing properties (Top 25%) earn $4,401 or more, indicating effective management and desirable locations/amenities.
- Typical properties (Median) generate around $2,636 per month, representing the average market performance.
- Entry-level properties (Bottom 25%) see earnings around $1,542, often with potential for optimization.
Average Monthly Airbnb Earnings Trend in Wolfe County
Wolfe County Airbnb Occupancy Rate Trends (2026)
Maximize your bookings by understanding the Wolfe County STR occupancy trends. Seasonal demand shifts significantly influence how often properties are booked. Typically, Octobersees the highest demand (peak season occupancy), while January experiences the lowest (low season). Effective strategies, like adjusting minimum stays or offering promotions, can boost occupancy during slower periods. Here's how different property tiers perform in Wolfe County:
- Best-in-class properties (Top 10%) achieve 68%+ occupancy, indicating high desirability and potentially optimized availability.
- Strong performing properties (Top 25%) maintain 53% or higher occupancy, suggesting good market fit and guest satisfaction.
- Typical properties (Median) have an occupancy rate around 39%.
- Entry-level properties (Bottom 25%) average 25% occupancy, potentially facing higher vacancy.
Average Monthly Occupancy Rate Trend in Wolfe County
Average Daily Rate (ADR) Airbnb Trends in Wolfe County (2026)
Effective short term rental pricing strategy in Wolfe County involves understanding monthly ADR fluctuations. The Average Daily Rate (ADR) for Airbnb in Wolfe County typically peaks in October and dips lowest during February. Leveraging Airbnb dynamic pricing tools or strategies based on this seasonality can significantly boost revenue. Here's a look at the typical nightly rates achieved:
- Best-in-class properties (Top 10%) command rates of $366+ per night, often due to premium features or locations.
- Strong performing properties (Top 25%) achieve nightly rates of $291 or more.
- Typical properties (Median) charge around $228 per night.
- Entry-level properties (Bottom 25%) earn around $182 per night.
Average Daily Rate (ADR) Trend by Month in Wolfe County
Get Live Wolfe County Market Intelligence 👇

Explore Real-time Analytics
Airbnb Seasonality Analysis & Trends in Wolfe County (2026)
Peak Season (October, July, November)
- Revenue averages $4,436 per month
- Occupancy rates average 49.0%
- Daily rates average $275
Shoulder Season
- Revenue averages $3,375 per month
- Occupancy maintains around 42.1%
- Daily rates hold near $241
Low Season (January, February, December)
- Revenue drops to average $2,044 per month
- Occupancy decreases to average 26.7%
- Daily rates adjust to average $236
Seasonality Insights for Wolfe County
- The Airbnb seasonality in Wolfe County shows highly seasonal trends requiring careful strategy. While the sections above show seasonal averages, it's also insightful to look at the extremes:
- During the high season, the absolute peak month showcases Wolfe County's highest earning potential, with monthly revenues capable of climbing to $5,381, occupancy reaching a high of 54.6%, and ADRs peaking at $309.
- Conversely, the slowest single month of the year, typically falling within the low season, marks the market's lowest point. In this month, revenue might dip to $1,750, occupancy could drop to 21.2%, and ADRs may adjust down to $212.
- Understanding both the seasonal averages and these monthly peaks and troughs in revenue, occupancy, and ADR is crucial for maximizing your Airbnb profit potential in Wolfe County.
Seasonal Strategies for Maximizing Profit
- Peak Season: Maximize revenue through premium pricing and potentially longer minimum stays. Ensure high availability.
- Low Season: Offer competitive pricing, special promotions (e.g., extended stay discounts), and flexible cancellation policies. Target off-season travelers like remote workers or budget-conscious guests.
- Shoulder Seasons: Implement dynamic pricing that balances peak and low rates. Target weekend travelers or specific events. Offer slightly more flexible terms than peak season.
- Regularly analyze your own performance against these Wolfe County seasonality benchmarks and adjust your pricing and availability strategy accordingly.
Best Areas for Airbnb Investment in Wolfe County (2026)
Exploring the top neighborhoods for short-term rentals in Wolfe County? This section highlights key areas, outlining why they are attractive for hosts and guests, along with notable local attractions. Consider these locations based on your target guest profile and investment strategy.
| Neighborhood / Area | Why Host Here? (Target Guests & Appeal) | Key Attractions & Landmarks |
|---|---|---|
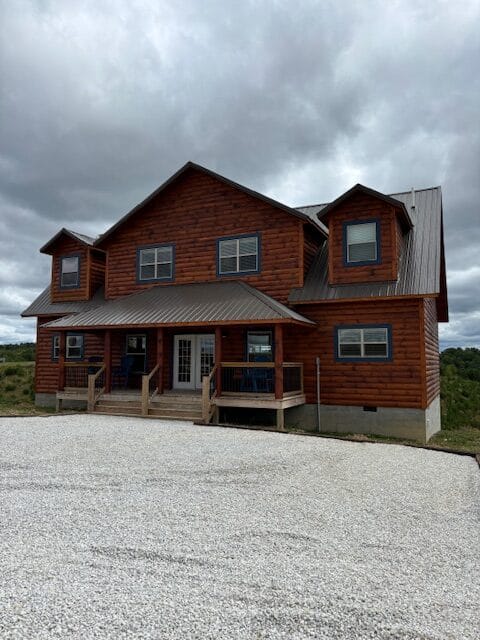
| Red River Gorge | A stunning natural area known for its sandstone cliffs, rock formations, and outdoor activities. Popular with hikers, climbers, and nature enthusiasts seeking adventure in a beautiful setting. | Natural Bridge State Resort Park, Red River Gorge Geological Area, Cliffview Resort, Daniel Boone National Forest, Cumberland Falls State Resort Park |
| Campton | The gateway to the Red River Gorge, Campton has charming local eateries and is close to various outdoor activities, attracting visitors looking for a rustic yet comfortable stay. | Wolfe County Historical Museum, Red River Gorge Cabin Rentals, Local restaurants, Hiking trails nearby |
| West Rim | This area offers breathtaking views and access to hiking trails, attracting tourists who are interested in scenic landscapes and outdoor sports. | West Rim Overlook, Hiking trails in the vicinity, Shooting Star Cabin, Local wildlife viewing |
| Pine Ridge | A peaceful area located near several attractions, great for families and those seeking a quiet getaway surrounded by nature. | Pine Ridge Trail, Local wildlife, Outdoor picnic areas |
| Moomaw Lake | A beautiful lake area appealing to families and nature lovers, perfect for those who enjoy fishing, kayaking, and lakeside activities. | Moomaw Lake Recreation Area, Fishing spots, Picnic areas, Nature trails |
| Beattyville | Close to hiking and outdoor adventures, Beattyville attracts tourists looking for lodging near popular outdoor activities. | Canoeing the Kentucky River, Nearby hiking trails, Local eateries |
| Cumberland Falls | Home to the majestic Cumberland Falls, this area attracts nature lovers and photographers, particularly during the full moon for its moonbow phenomenon. | Cumberland Falls State Resort Park, Moonbow viewing, Hiking trails, Waterfalls and scenic views |
| Natural Bridge | A popular area in the Red River Gorge, known for its hiking opportunities and spectacular natural arch, attracting both local and out-of-state tourists. | Natural Bridge State Park, Hiking trails, Observation Tower, Scenic overlooks |
Understanding Airbnb License Requirements & STR Laws in Wolfe County (2026)
While Wolfe County, Kentucky, United States currently shows low STR regulations, specific Airbnb license requirements might still exist or change. Always verify the latest short term rental regulations and Airbnb license requirements directly with local government authorities for Wolfe County to ensure full compliance before hosting.
(Source: AirROI data, 2026, finding no licensed listings among those analyzed)
Top Performing Airbnb Properties in Wolfe County (2026)
Benchmark your potential! Explore examples of top-performing Airbnb properties in Wolfe Countybased on Trailing Twelve Month (TTM) revenue. Analyze their characteristics, revenue, occupancy rate, and ADR to understand what drives success in this market.

Nerf Blasters | Arcade | Hot Tub | No Airbnb Fees
Entire Place • 4 bedrooms
Big Valley + RRG Adventure Discounts
Entire Place • 6 bedrooms

Hot tub & Wi-fi—Red River Gorge Luxury Cabin
Entire Place • 4 bedrooms

Terrapin Station • Valley View, Hot Tub, Game Room
Entire Place • 5 bedrooms
DeerRidge w/Hotub/Gameroom@RRG
Entire Place • 4 bedrooms

The Aubrey/New Build/10 miles to RRG
Entire Place • 2 bedrooms
Note: Performance varies based on location, size, amenities, seasonality, and management quality. Data reflects the past 12 months.
Top Performing Airbnb Hosts in Wolfe County (2026)
Learn from the best! This table showcases top-performing Airbnb hosts in Wolfe County based on the number of properties managed and estimated total revenue over the past year. Analyze their scale and performance metrics.
| Host Name | Properties | Grossing Revenue | Stay Reviews | Avg Rating |
|---|---|---|---|---|
| Ian | 10 | $303,832 | 96 | 4.81/5.0 |
| Allen | 6 | $297,660 | 755 | 4.97/5.0 |
| RRG Getaways | 3 | $193,575 | 327 | 4.79/5.0 |
| Tyler | 1 | $151,713 | 99 | 4.99/5.0 |
| Deborah | 9 | $134,927 | 66 | 4.52/5.0 |
| Amy | 6 | $110,133 | 46 | 4.77/5.0 |
| Kayla | 1 | $93,308 | 98 | 4.96/5.0 |
| Breck + Linda | 1 | $79,261 | 111 | 4.88/5.0 |
| Krystin | 1 | $74,764 | 83 | 4.96/5.0 |
| Alexandra | 1 | $69,968 | 12 | 4.67/5.0 |
Analyzing the strategies of top hosts, such as their property selection, pricing, and guest communication, can offer valuable lessons for optimizing your own Airbnb operations in Wolfe County.
Dive Deeper: Advanced Wolfe County STR Market Data (2026)
Ready to unlock more insights? AirROI provides access to advanced metrics and comprehensive Airbnb data for Wolfe County. Explore detailed analytics beyond this report to refine your investment strategy, optimize pricing, and maximize your vacation rental profits.
Explore Advanced MetricsWolfe County Short-Term Rental Market Composition (2026): Property & Room Types
Room Type Distribution
Property Type Distribution
Market Composition Insights for Wolfe County
- The Wolfe County Airbnb market composition is heavily skewed towards Entire Home/Apt listings, which make up 97% of the 66 active rentals. This indicates strong guest preference for privacy and space.
- Looking at the property type distribution in Wolfe County, Outdoor/Unique properties are the most common (81.8%), reflecting the local real estate landscape.
- Smaller segments like unique stays (combined 4.5%) offer potential for unique stay experiences.
Wolfe County Airbnb Room Capacity Analysis (2026): Bedroom Distribution
Distribution of Listings by Number of Bedrooms
Room Capacity Insights for Wolfe County
- The dominant room capacity in Wolfe County is 2 bedrooms listings, making up 31.8% of the market. This suggests a strong demand for properties suitable for couples or solo travelers.
- Together, 2 bedrooms and 1 bedroom properties represent 62.1% of the active Airbnb listings in Wolfe County, indicating a high concentration in these sizes.
- A significant 33.4% of listings offer 3+ bedrooms, catering to larger groups and families seeking more space in Wolfe County.
Wolfe County Vacation Rental Guest Capacity Trends (2026)
Distribution of Listings by Guest Capacity
Guest Capacity Insights for Wolfe County
- The most common guest capacity trend in Wolfe County vacation rentals is listings accommodating 8+ guests (31.8%). This suggests the primary traveler segment is likely larger groups.
- Properties designed for 8+ guests and 4 guests dominate the Wolfe County STR market, accounting for 54.5% of listings.
- 53.0% of properties accommodate 6+ guests, serving the market segment for larger families or group travel in Wolfe County.
- On average, properties in Wolfe County are equipped to host 5.3 guests.
Wolfe County Airbnb Booking Patterns (2026): Available vs. Booked Days
Available Days Distribution
Booked Days Distribution
Booking Pattern Insights for Wolfe County
- The most common availability pattern in Wolfe County falls within the 271-366 days range, representing 42.4% of listings. This suggests many properties have significant open periods on their calendars.
- Approximately 80.3% of listings show high availability (181+ days open annually), indicating potential for increased bookings or specific owner usage patterns.
- For booked days, the 91-180 days range is most frequent in Wolfe County (34.8%), reflecting common guest stay durations or potential owner blocking patterns.
- A notable 22.7% of properties secure long booking periods (181+ days booked per year), highlighting successful long-term rental strategies or significant owner usage.
Wolfe County Airbnb Minimum Stay Requirements Analysis
Distribution of Listings by Minimum Night Requirement
1 Night
14 listings
21.2% of total
2 Nights
29 listings
43.9% of total
30+ Nights
23 listings
34.8% of total
Key Insights
- The most prevalent minimum stay requirement in Wolfe County is 2 Nights, adopted by 43.9% of listings. This highlights the market's preference for shorter, flexible bookings.
- A strong majority (65.1%) of the Wolfe County Airbnb data shows acceptance of very short stays (1-2 nights), indicating a dynamic, high-turnover market.
- A significant segment (34.8%) caters to monthly stays (30+ nights) in Wolfe County, pointing to opportunities in the extended-stay market.
Recommendations
- Align with the market by considering a 2 Nights minimum stay, as 43.9% of Wolfe County hosts use this setting.
- If feasible, allowing 1-night stays, especially midweek or during low season, could capture last-minute bookings, as only 21.2% currently do.
- Explore offering discounts for stays of 30+ nights to attract the 34.8% of the market seeking extended stays.
- Adjust minimum nights based on seasonality – potentially shorter during low season and longer during peak demand periods in Wolfe County.
Wolfe County Airbnb Cancellation Policy Trends Analysis (2026)
Super Strict 30 Days
15 listings
22.7% of total
Limited
4 listings
6.1% of total
Flexible
1 listings
1.5% of total
Moderate
12 listings
18.2% of total
Firm
29 listings
43.9% of total
Strict
5 listings
7.6% of total
Cancellation Policy Insights for Wolfe County
- The prevailing Airbnb cancellation policy trend in Wolfe County is Firm, used by 43.9% of listings.
- A majority (51.5%) of hosts in Wolfe County utilize Firm or Strict policies, indicating a market where hosts prioritize booking security.
- Strict cancellation policies are quite rare (7.6%), potentially making listings with this policy less competitive unless justified by high demand or property type.
Recommendations for Hosts
- Consider adopting a Firm policy to align with the 43.9% market standard in Wolfe County.
- Using a Strict policy might deter some guests, as only 7.6% of listings use it. Evaluate if potential revenue protection outweighs possible lower booking rates.
- Regularly review your cancellation policy against competitors and market demand shifts in Wolfe County.
Wolfe County STR Booking Lead Time Analysis (2026)
Average Booking Lead Time by Month
Booking Lead Time Insights for Wolfe County
- The overall average booking lead time for vacation rentals in Wolfe County is 40 days.
- Guests book furthest in advance for stays during October (average 62 days), likely coinciding with peak travel demand or local events.
- The shortest booking windows occur for stays in January (average 21 days), indicating more last-minute travel plans during this time.
- Seasonally, Fall (52 days avg.) sees the longest lead times, while Winter (26 days avg.) has the shortest, reflecting typical travel planning cycles.
Recommendations for Hosts
- Use the overall average lead time (40 days) as a baseline for your pricing and availability strategy in Wolfe County.
- For October stays, consider implementing length-of-stay discounts or slightly higher rates for bookings made less than 62 days out to capitalize on advance planning.
- Target marketing efforts for the Fall season well in advance (at least 52 days) to capture early planners.
- Monitor your own booking lead times against these Wolfe County averages to identify opportunities for dynamic pricing adjustments.
Popular & Essential Airbnb Amenities in Wolfe County (2026)
Amenity Prevalence
Amenity Insights for Wolfe County
- Essential amenities in Wolfe County that guests expect include: Air conditioning, Coffee maker, Wifi. Lacking these (any) could significantly impact bookings.
- Popular amenities like Kitchen, Heating, Microwave are common but not universal. Offering these can provide a competitive edge.
Recommendations for Hosts
- Ensure your listing includes all essential amenities for Wolfe County: Air conditioning, Coffee maker, Wifi.
- Prioritize adding missing essentials: Air conditioning, Coffee maker, Wifi.
- Consider adding popular differentiators like Kitchen or Heating to increase appeal.
- Highlight unique or less common amenities you offer (e.g., hot tub, dedicated workspace, EV charger) in your listing description and photos.
- Regularly check competitor amenities in Wolfe County to stay competitive.
Wolfe County Airbnb Guest Demographics & Profile Analysis (2026)
Guest Profile Summary for Wolfe County
- The typical guest profile for Airbnb in Wolfe County consists of primarily domestic travelers (97%), often arriving from nearby Cincinnati, typically belonging to the Post-2000s (Gen Z/Alpha) group (50%), primarily speaking English or Spanish.
- Domestic travelers account for 97.1% of guests.
- Key international markets include United States (97.1%) and Canada (1.1%).
- Top languages spoken are English (79.9%) followed by Spanish (10%).
- A significant demographic segment is the Post-2000s (Gen Z/Alpha) group, representing 50% of guests.
Recommendations for Hosts
- Target domestic marketing efforts towards travelers from Cincinnati and Louisville.
- Tailor amenities and listing descriptions to appeal to the dominant Post-2000s (Gen Z/Alpha) demographic (e.g., highlight fast WiFi, smart home features, local guides).
- Highlight unique local experiences or amenities relevant to the primary guest profile.
- Consider seasonal promotions aligned with peak travel times for key origin markets.
Nearby Short-Term Rental Market Comparison
How does the Wolfe County Airbnb market stack up against its neighbors? Compare key performance metrics like average monthly revenue, ADR, and occupancy rates in surrounding areas to understand the broader regional STR landscape.
| Market | Active Properties | Monthly Revenue | Daily Rate | Avg. Occupancy |
|---|---|---|---|---|
| Lawrenceburg | 65 | $4,477 | $360.32 | 45% |
| Crittenden | 18 | $3,944 | $261.97 | 48% |
| Strawberry Plains | 13 | $3,880 | $222.81 | 54% |
| Walton | 22 | $3,840 | $225.35 | 58% |
| Williamstown | 204 | $3,674 | $263.96 | 49% |
| Rogers | 115 | $3,484 | $255.43 | 45% |
| Caryville | 17 | $3,478 | $410.81 | 34% |
| Corinth | 17 | $3,457 | $270.49 | 48% |
| Versailles | 61 | $3,375 | $350.32 | 44% |
| LaFollette | 157 | $3,289 | $476.63 | 32% |