Powell County Airbnb Market Analysis 2026: Short Term Rental Data & Vacation Rental Statistics in Kentucky, United States
Is Airbnb profitable in Powell County in 2026? Explore comprehensive Airbnb analytics for Powell County, Kentucky, United States to uncover income potential. This 2026 STR market report for Powell County, based on AirROI data from February 2025 to January 2026, reveals key trends in the niche market of 30 active listings.
Whether you're considering an Airbnb investment in Powell County, optimizing your existing vacation rental, or exploring rental arbitrage opportunities, understanding the Powell County Airbnb data is crucial. Leveraging the low regulation environment is key to maximizing your short term rental income potential. Let's dive into the specifics.
Key Powell County Airbnb Performance Metrics Overview
Monthly Airbnb Revenue Variations & Income Potential in Powell County (2026)
Understanding the monthly revenue variations for Airbnb listings in Powell County is key to maximizing your short term rental income potential. Seasonality significantly impacts earnings. Our analysis, based on data from the past 12 months, shows that the peak revenue month for STRs in Powell County is typically October, while January often presents the lowest earnings, highlighting opportunities for strategic pricing adjustments during shoulder and low seasons. Explore the typical Airbnb income in Powell County across different performance tiers:
- Best-in-class properties (Top 10%) achieve $4,900+ monthly, often utilizing dynamic pricing and superior guest experiences.
- Strong performing properties (Top 25%) earn $3,882 or more, indicating effective management and desirable locations/amenities.
- Typical properties (Median) generate around $2,802 per month, representing the average market performance.
- Entry-level properties (Bottom 25%) see earnings around $1,763, often with potential for optimization.
Average Monthly Airbnb Earnings Trend in Powell County
Powell County Airbnb Occupancy Rate Trends (2026)
Maximize your bookings by understanding the Powell County STR occupancy trends. Seasonal demand shifts significantly influence how often properties are booked. Typically, Octobersees the highest demand (peak season occupancy), while December experiences the lowest (low season). Effective strategies, like adjusting minimum stays or offering promotions, can boost occupancy during slower periods. Here's how different property tiers perform in Powell County:
- Best-in-class properties (Top 10%) achieve 73%+ occupancy, indicating high desirability and potentially optimized availability.
- Strong performing properties (Top 25%) maintain 60% or higher occupancy, suggesting good market fit and guest satisfaction.
- Typical properties (Median) have an occupancy rate around 45%.
- Entry-level properties (Bottom 25%) average 29% occupancy, potentially facing higher vacancy.
Average Monthly Occupancy Rate Trend in Powell County
Average Daily Rate (ADR) Airbnb Trends in Powell County (2026)
Effective short term rental pricing strategy in Powell County involves understanding monthly ADR fluctuations. The Average Daily Rate (ADR) for Airbnb in Powell County typically peaks in October and dips lowest during February. Leveraging Airbnb dynamic pricing tools or strategies based on this seasonality can significantly boost revenue. Here's a look at the typical nightly rates achieved:
- Best-in-class properties (Top 10%) command rates of $310+ per night, often due to premium features or locations.
- Strong performing properties (Top 25%) achieve nightly rates of $252 or more.
- Typical properties (Median) charge around $191 per night.
- Entry-level properties (Bottom 25%) earn around $160 per night.
Average Daily Rate (ADR) Trend by Month in Powell County
Get Live Powell County Market Intelligence 👇

Explore Real-time Analytics
Airbnb Seasonality Analysis & Trends in Powell County (2026)
Peak Season (October, March, July)
- Revenue averages $3,955 per month
- Occupancy rates average 57.1%
- Daily rates average $219
Shoulder Season
- Revenue averages $2,940 per month
- Occupancy maintains around 44.3%
- Daily rates hold near $215
Low Season (January, February, December)
- Revenue drops to average $2,060 per month
- Occupancy decreases to average 35.8%
- Daily rates adjust to average $198
Seasonality Insights for Powell County
- The Airbnb seasonality in Powell County shows highly seasonal trends requiring careful strategy. While the sections above show seasonal averages, it's also insightful to look at the extremes:
- During the high season, the absolute peak month showcases Powell County's highest earning potential, with monthly revenues capable of climbing to $4,957, occupancy reaching a high of 64.6%, and ADRs peaking at $240.
- Conversely, the slowest single month of the year, typically falling within the low season, marks the market's lowest point. In this month, revenue might dip to $1,950, occupancy could drop to 33.3%, and ADRs may adjust down to $180.
- Understanding both the seasonal averages and these monthly peaks and troughs in revenue, occupancy, and ADR is crucial for maximizing your Airbnb profit potential in Powell County.
Seasonal Strategies for Maximizing Profit
- Peak Season: Maximize revenue through premium pricing and potentially longer minimum stays. Ensure high availability.
- Low Season: Offer competitive pricing, special promotions (e.g., extended stay discounts), and flexible cancellation policies. Target off-season travelers like remote workers or budget-conscious guests.
- Shoulder Seasons: Implement dynamic pricing that balances peak and low rates. Target weekend travelers or specific events. Offer slightly more flexible terms than peak season.
- Regularly analyze your own performance against these Powell County seasonality benchmarks and adjust your pricing and availability strategy accordingly.
Best Areas for Airbnb Investment in Powell County (2026)
Exploring the top neighborhoods for short-term rentals in Powell County? This section highlights key areas, outlining why they are attractive for hosts and guests, along with notable local attractions. Consider these locations based on your target guest profile and investment strategy.
| Neighborhood / Area | Why Host Here? (Target Guests & Appeal) | Key Attractions & Landmarks |
|---|---|---|
| Red River Gorge | A stunning natural area famous for its natural sandstone arches and rock climbing. Attracts outdoor enthusiasts and families looking for adventure and beautiful scenery. | Natural Bridge State Resort Park, Cumberland Falls State Resort Park, Rock Bridge, Muir Valley, Red River Gorge Zipline |
| Daniel Boone National Forest | A vast national forest offering hiking, camping, and wildlife observation. Great for nature lovers and those seeking a peaceful retreat in the wilderness. | Cumberland Falls, Sheltowee Trace Trail, The Big South Fork, Biking and hiking trails, Scenic overlooks |
| Clay City | A quaint town located near several outdoor recreation areas and historical sites, ideal for guests looking for a homey experience while being close to nature and history. | Historic sites, Access to Red River Gorge, Local shops and restaurants, Nearby lakes, Carter Caves State Resort Park |
| Stanton | A small town that serves as a gateway to the Red River Gorge, appealing to visitors who want to access outdoor adventures without staying in a busier location. | Red River Gorge, Hiking trails, Local heritage sites, Natural beauty, Quiet townspeople |
| Campton | Known for its proximity to the Natural Bridge and outdoor activities, this town is great for visitors seeking adventure and relaxation in nature. | Natural Bridge State Park, Old Mill Springs, Hiking trails, Local eateries, Nature photography spots |
| Wolfe County | Home to some of the most breathtaking landscapes in Kentucky, Wolfe County attracts tourists interested in hiking, fishing, and exploring the beautiful outdoors. | Cumblerand Falls, Red River Gorge, Hiking and outdoor sports, Nature trails, Scenic drives |
| Frenchburg | A peaceful location surrounded by breathtaking nature, appealing to those looking to unwind and enjoy family-oriented outdoor activities. | Nature parks, Fishing spots, Scenic views, Local craft shops, Hiking trails |
| Pine Ridge | A small community that provides access to various outdoor activities and serves as a base for exploring surrounding natural attractions. | Natural Bridge State Resort Park, Hiking trails, Quiet country life, Canoeing opportunities, Community events |
Understanding Airbnb License Requirements & STR Laws in Powell County (2026)
While Powell County, Kentucky, United States currently shows low STR regulations, specific Airbnb license requirements might still exist or change. Always verify the latest short term rental regulations and Airbnb license requirements directly with local government authorities for Powell County to ensure full compliance before hosting.
(Source: AirROI data, 2026, finding no licensed listings among those analyzed)
Top Performing Airbnb Properties in Powell County (2026)
Benchmark your potential! Explore examples of top-performing Airbnb properties in Powell Countybased on Trailing Twelve Month (TTM) revenue. Analyze their characteristics, revenue, occupancy rate, and ADR to understand what drives success in this market.

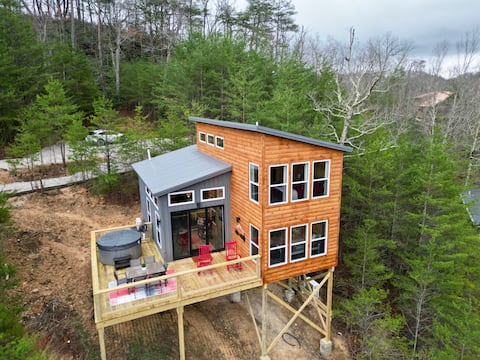
RRG Retreat w/Hot Tub, Game Room & EV Charger
Entire Place • 4 bedrooms

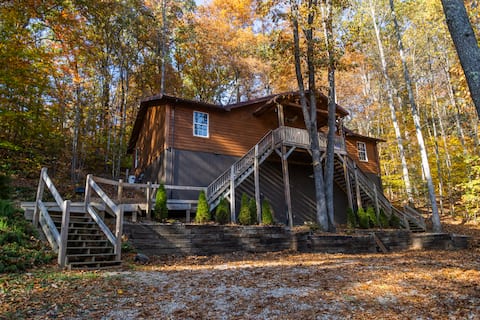
Cliffline Twilight |Cliffside Hot Tub ·RRG Retreat
Entire Place • 2 bedrooms
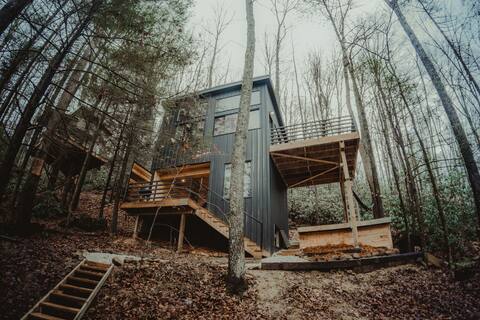
Belle Vue Lookout • Hot Tub + Stunning RRG Views |
Entire Place • 2 bedrooms
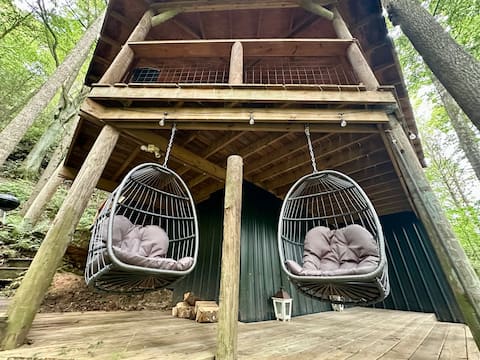
Cuckoo's Nest Cabin + RRG Adventure Discounts
Entire Place • 4 bedrooms
Moonshadow
Entire Place • 1 bedroom
Foxglove | Inside Nada Tunnel | Trails + Hot Tub
Entire Place • 2 bedrooms
Note: Performance varies based on location, size, amenities, seasonality, and management quality. Data reflects the past 12 months.
Top Performing Airbnb Hosts in Powell County (2026)
Learn from the best! This table showcases top-performing Airbnb hosts in Powell County based on the number of properties managed and estimated total revenue over the past year. Analyze their scale and performance metrics.
| Host Name | Properties | Grossing Revenue | Stay Reviews | Avg Rating |
|---|---|---|---|---|
| RRG Getaways | 7 | $302,840 | 1135 | 4.85/5.0 |
| Amy | 6 | $163,285 | 123 | 4.82/5.0 |
| Ian | 4 | $117,295 | 85 | 4.82/5.0 |
| Shane | 1 | $84,729 | 133 | 4.95/5.0 |
| Wellspring Haven | 1 | $43,771 | 72 | 5.00/5.0 |
| Gale | 1 | $41,551 | 179 | 4.85/5.0 |
| Liz | 1 | $40,897 | 84 | 4.99/5.0 |
| Alexi | 1 | $38,316 | 347 | 4.94/5.0 |
| Nancy | 1 | $36,048 | 27 | 4.56/5.0 |
| Allen | 1 | $33,628 | 96 | 4.98/5.0 |
Analyzing the strategies of top hosts, such as their property selection, pricing, and guest communication, can offer valuable lessons for optimizing your own Airbnb operations in Powell County.
Dive Deeper: Advanced Powell County STR Market Data (2026)
Ready to unlock more insights? AirROI provides access to advanced metrics and comprehensive Airbnb data for Powell County. Explore detailed analytics beyond this report to refine your investment strategy, optimize pricing, and maximize your vacation rental profits.
Explore Advanced MetricsPowell County Short-Term Rental Market Composition (2026): Property & Room Types
Room Type Distribution
Property Type Distribution
Market Composition Insights for Powell County
- The Powell County Airbnb market composition is heavily skewed towards Entire Home/Apt listings, which make up 100% of the 30 active rentals. This indicates strong guest preference for privacy and space.
- Looking at the property type distribution in Powell County, Outdoor/Unique properties are the most common (93.3%), reflecting the local real estate landscape.
Powell County Airbnb Room Capacity Analysis (2026): Bedroom Distribution
Distribution of Listings by Number of Bedrooms
Room Capacity Insights for Powell County
- The dominant room capacity in Powell County is 2 bedrooms listings, making up 46.7% of the market. This suggests a strong demand for properties suitable for couples or solo travelers.
- Together, 2 bedrooms and 1 bedroom properties represent 70.0% of the active Airbnb listings in Powell County, indicating a high concentration in these sizes.
Powell County Vacation Rental Guest Capacity Trends (2026)
Distribution of Listings by Guest Capacity
Guest Capacity Insights for Powell County
- The most common guest capacity trend in Powell County vacation rentals is listings accommodating 4 guests (46.7%). This suggests the primary traveler segment is likely small families or groups.
- Properties designed for 4 guests and 6 guests dominate the Powell County STR market, accounting for 63.4% of listings.
- 36.7% of properties accommodate 6+ guests, serving the market segment for larger families or group travel in Powell County.
- On average, properties in Powell County are equipped to host 4.8 guests.
Powell County Airbnb Booking Patterns (2026): Available vs. Booked Days
Available Days Distribution
Booked Days Distribution
Booking Pattern Insights for Powell County
- The most common availability pattern in Powell County falls within the 91-180 days range, representing 40% of listings. This suggests many properties have significant open periods on their calendars.
- Approximately 60.0% of listings show high availability (181+ days open annually), indicating potential for increased bookings or specific owner usage patterns.
- For booked days, the 181-270 days range is most frequent in Powell County (40%), reflecting common guest stay durations or potential owner blocking patterns.
- A notable 40.0% of properties secure long booking periods (181+ days booked per year), highlighting successful long-term rental strategies or significant owner usage.
Powell County Airbnb Minimum Stay Requirements Analysis
Distribution of Listings by Minimum Night Requirement
1 Night
5 listings
16.7% of total
2 Nights
17 listings
56.7% of total
30+ Nights
8 listings
26.7% of total
Key Insights
- The most prevalent minimum stay requirement in Powell County is 2 Nights, adopted by 56.7% of listings. This highlights the market's preference for shorter, flexible bookings.
- A strong majority (73.4%) of the Powell County Airbnb data shows acceptance of very short stays (1-2 nights), indicating a dynamic, high-turnover market.
- A significant segment (26.7%) caters to monthly stays (30+ nights) in Powell County, pointing to opportunities in the extended-stay market.
Recommendations
- Align with the market by considering a 2 Nights minimum stay, as 56.7% of Powell County hosts use this setting.
- If feasible, allowing 1-night stays, especially midweek or during low season, could capture last-minute bookings, as only 16.7% currently do.
- A 2-night minimum appears standard (56.7%). Consider this for weekends or peak periods.
- Explore offering discounts for stays of 30+ nights to attract the 26.7% of the market seeking extended stays.
- Adjust minimum nights based on seasonality – potentially shorter during low season and longer during peak demand periods in Powell County.
Powell County Airbnb Cancellation Policy Trends Analysis (2026)
Super Strict 30 Days
5 listings
16.7% of total
Limited
6 listings
20% of total
Flexible
1 listings
3.3% of total
Moderate
7 listings
23.3% of total
Firm
10 listings
33.3% of total
Strict
1 listings
3.3% of total
Cancellation Policy Insights for Powell County
- The prevailing Airbnb cancellation policy trend in Powell County is Firm, used by 33.3% of listings.
- There's a relatively balanced mix between guest-friendly (26.6%) and stricter (36.6%) policies, offering choices for different guest needs.
- Strict cancellation policies are quite rare (3.3%), potentially making listings with this policy less competitive unless justified by high demand or property type.
Recommendations for Hosts
- Consider adopting a Firm policy to align with the 33.3% market standard in Powell County.
- Using a Strict policy might deter some guests, as only 3.3% of listings use it. Evaluate if potential revenue protection outweighs possible lower booking rates.
- Regularly review your cancellation policy against competitors and market demand shifts in Powell County.
Powell County STR Booking Lead Time Analysis (2026)
Average Booking Lead Time by Month
Booking Lead Time Insights for Powell County
- The overall average booking lead time for vacation rentals in Powell County is 43 days.
- Guests book furthest in advance for stays during October (average 65 days), likely coinciding with peak travel demand or local events.
- The shortest booking windows occur for stays in January (average 17 days), indicating more last-minute travel plans during this time.
- Seasonally, Fall (54 days avg.) sees the longest lead times, while Winter (28 days avg.) has the shortest, reflecting typical travel planning cycles.
Recommendations for Hosts
- Use the overall average lead time (43 days) as a baseline for your pricing and availability strategy in Powell County.
- For October stays, consider implementing length-of-stay discounts or slightly higher rates for bookings made less than 65 days out to capitalize on advance planning.
- Target marketing efforts for the Fall season well in advance (at least 54 days) to capture early planners.
- Monitor your own booking lead times against these Powell County averages to identify opportunities for dynamic pricing adjustments.
Popular & Essential Airbnb Amenities in Powell County (2026)
Amenity Prevalence
Amenity Insights for Powell County
- Essential amenities in Powell County that guests expect include: Stove, Coffee maker, Smoke alarm, Kitchen, Heating. Lacking these (any) could significantly impact bookings.
- Popular amenities like Free parking on premises, Dishes and silverware, Hot water are common but not universal. Offering these can provide a competitive edge.
Recommendations for Hosts
- Ensure your listing includes all essential amenities for Powell County: Stove, Coffee maker, Smoke alarm, Kitchen, Heating.
- Prioritize adding missing essentials: Smoke alarm, Kitchen, Heating.
- Consider adding popular differentiators like Free parking on premises or Dishes and silverware to increase appeal.
- Highlight unique or less common amenities you offer (e.g., hot tub, dedicated workspace, EV charger) in your listing description and photos.
- Regularly check competitor amenities in Powell County to stay competitive.
Powell County Airbnb Guest Demographics & Profile Analysis (2026)
Guest Profile Summary for Powell County
- The typical guest profile for Airbnb in Powell County consists of primarily domestic travelers (99%), often arriving from nearby Louisville, typically belonging to the Post-2000s (Gen Z/Alpha) group (50%), primarily speaking English or Spanish.
- Domestic travelers account for 99.3% of guests.
- Key international markets include United States (99.3%) and United Kingdom (0.3%).
- Top languages spoken are English (81.3%) followed by Spanish (11.5%).
- A significant demographic segment is the Post-2000s (Gen Z/Alpha) group, representing 50% of guests.
Recommendations for Hosts
- Target domestic marketing efforts towards travelers from Louisville and Cincinnati.
- Tailor amenities and listing descriptions to appeal to the dominant Post-2000s (Gen Z/Alpha) demographic (e.g., highlight fast WiFi, smart home features, local guides).
- Highlight unique local experiences or amenities relevant to the primary guest profile.
- Consider seasonal promotions aligned with peak travel times for key origin markets.
Nearby Short-Term Rental Market Comparison
How does the Powell County Airbnb market stack up against its neighbors? Compare key performance metrics like average monthly revenue, ADR, and occupancy rates in surrounding areas to understand the broader regional STR landscape.
| Market | Active Properties | Monthly Revenue | Daily Rate | Avg. Occupancy |
|---|---|---|---|---|
| Lawrenceburg | 65 | $4,477 | $360.32 | 45% |
| Crittenden | 18 | $3,944 | $261.97 | 48% |
| Strawberry Plains | 13 | $3,880 | $222.81 | 54% |
| Walton | 22 | $3,840 | $225.35 | 58% |
| Williamstown | 204 | $3,674 | $263.96 | 49% |
| Rogers | 115 | $3,484 | $255.43 | 45% |
| Caryville | 17 | $3,478 | $410.81 | 34% |
| Corinth | 17 | $3,457 | $270.49 | 48% |
| Versailles | 61 | $3,375 | $350.32 | 44% |
| LaFollette | 157 | $3,289 | $476.63 | 32% |