Morehead Airbnb Market Analysis 2026: Short Term Rental Data & Vacation Rental Statistics in Kentucky, United States
Is Airbnb profitable in Morehead in 2026? Explore comprehensive Airbnb analytics for Morehead, Kentucky, United States to uncover income potential. This 2026 STR market report for Morehead, based on AirROI data from February 2025 to January 2026, reveals key trends in the niche market of 62 active listings.
Whether you're considering an Airbnb investment in Morehead, optimizing your existing vacation rental, or exploring rental arbitrage opportunities, understanding the Morehead Airbnb data is crucial. Leveraging the low regulation environment is key to maximizing your short term rental income potential. Let's dive into the specifics.
Key Morehead Airbnb Performance Metrics Overview
Monthly Airbnb Revenue Variations & Income Potential in Morehead (2026)
Understanding the monthly revenue variations for Airbnb listings in Morehead is key to maximizing your short term rental income potential. Seasonality significantly impacts earnings. Our analysis, based on data from the past 12 months, shows that the peak revenue month for STRs in Morehead is typically March, while February often presents the lowest earnings, highlighting opportunities for strategic pricing adjustments during shoulder and low seasons. Explore the typical Airbnb income in Morehead across different performance tiers:
- Best-in-class properties (Top 10%) achieve $3,303+ monthly, often utilizing dynamic pricing and superior guest experiences.
- Strong performing properties (Top 25%) earn $2,253 or more, indicating effective management and desirable locations/amenities.
- Typical properties (Median) generate around $1,104 per month, representing the average market performance.
- Entry-level properties (Bottom 25%) see earnings around $577, often with potential for optimization.
Average Monthly Airbnb Earnings Trend in Morehead
Morehead Airbnb Occupancy Rate Trends (2026)
Maximize your bookings by understanding the Morehead STR occupancy trends. Seasonal demand shifts significantly influence how often properties are booked. Typically, Marchsees the highest demand (peak season occupancy), while February experiences the lowest (low season). Effective strategies, like adjusting minimum stays or offering promotions, can boost occupancy during slower periods. Here's how different property tiers perform in Morehead:
- Best-in-class properties (Top 10%) achieve 67%+ occupancy, indicating high desirability and potentially optimized availability.
- Strong performing properties (Top 25%) maintain 49% or higher occupancy, suggesting good market fit and guest satisfaction.
- Typical properties (Median) have an occupancy rate around 26%.
- Entry-level properties (Bottom 25%) average 14% occupancy, potentially facing higher vacancy.
Average Monthly Occupancy Rate Trend in Morehead
Average Daily Rate (ADR) Airbnb Trends in Morehead (2026)
Effective short term rental pricing strategy in Morehead involves understanding monthly ADR fluctuations. The Average Daily Rate (ADR) for Airbnb in Morehead typically peaks in October and dips lowest during February. Leveraging Airbnb dynamic pricing tools or strategies based on this seasonality can significantly boost revenue. Here's a look at the typical nightly rates achieved:
- Best-in-class properties (Top 10%) command rates of $234+ per night, often due to premium features or locations.
- Strong performing properties (Top 25%) achieve nightly rates of $170 or more.
- Typical properties (Median) charge around $129 per night.
- Entry-level properties (Bottom 25%) earn around $108 per night.
Average Daily Rate (ADR) Trend by Month in Morehead
Get Live Morehead Market Intelligence 👇

Explore Real-time Analytics
Airbnb Seasonality Analysis & Trends in Morehead (2026)
Peak Season (March, April, July)
- Revenue averages $2,015 per month
- Occupancy rates average 42.0%
- Daily rates average $140
Shoulder Season
- Revenue averages $1,555 per month
- Occupancy maintains around 33.0%
- Daily rates hold near $147
Low Season (January, February, September)
- Revenue drops to average $1,150 per month
- Occupancy decreases to average 25.2%
- Daily rates adjust to average $143
Seasonality Insights for Morehead
- The Airbnb seasonality in Morehead shows moderate seasonality with distinct peak and low periods. While the sections above show seasonal averages, it's also insightful to look at the extremes:
- During the high season, the absolute peak month showcases Morehead's highest earning potential, with monthly revenues capable of climbing to $2,125, occupancy reaching a high of 43.2%, and ADRs peaking at $151.
- Conversely, the slowest single month of the year, typically falling within the low season, marks the market's lowest point. In this month, revenue might dip to $1,073, occupancy could drop to 22.8%, and ADRs may adjust down to $136.
- Understanding both the seasonal averages and these monthly peaks and troughs in revenue, occupancy, and ADR is crucial for maximizing your Airbnb profit potential in Morehead.
Seasonal Strategies for Maximizing Profit
- Peak Season: Maximize revenue through premium pricing and potentially longer minimum stays. Ensure high availability.
- Low Season: Offer competitive pricing, special promotions (e.g., extended stay discounts), and flexible cancellation policies. Target off-season travelers like remote workers or budget-conscious guests.
- Shoulder Seasons: Implement dynamic pricing that balances peak and low rates. Target weekend travelers or specific events. Offer slightly more flexible terms than peak season.
- Regularly analyze your own performance against these Morehead seasonality benchmarks and adjust your pricing and availability strategy accordingly.
Best Areas for Airbnb Investment in Morehead (2026)
Exploring the top neighborhoods for short-term rentals in Morehead? This section highlights key areas, outlining why they are attractive for hosts and guests, along with notable local attractions. Consider these locations based on your target guest profile and investment strategy.
| Neighborhood / Area | Why Host Here? (Target Guests & Appeal) | Key Attractions & Landmarks |
|---|---|---|
| Downtown Morehead | The central hub of Morehead with access to dining, shopping, and community events. Popular among travelers looking to explore the local culture and attend events at Morehead State University. | Morehead State University, Carter Caves State Resort Park, Morehead Cinema, Rowan County Arts Center, Daniel Boone National Forest |
| Carter County | Scenic area surrounding Morehead, known for outdoor activities such as hiking and fishing. Attracts nature lovers and families looking for a getaway experience. | Carter Caves State Resort Park, Grayson Lake State Park, Clifty Wilderness Area, Carter County History Museum, Fish Trap Lake |
| Historic Downtown Morehead | Quaint and charming area filled with historic buildings and small-town charm. Offers a unique experience to visitors looking to enjoy a slower pace of life. | Historic Rowan County Courthouse, Local shops and boutiques, Morehead Museum & Cultural Center, Kirkwood Park, Lakeside Golf Course |
| Elm Hall Area | Residential area close to the university, attracting students and visitors for its convenient access to campus events and university facilities. | Morehead State University, Academic buildings and halls, Lakeview Park, Kirkwood Park |
| Red River Gorge | A little further out, but one of the most stunning natural attractions in the region. Known for its hiking, rock climbing, and natural arches, making it popular for outdoor enthusiasts. | Natural Bridge State Resort Park, Rock Bridge, Cumberland Falls State Resort Park, Hiking trails, Camping sites |
| Southeast Morehead | A peaceful area that provides access to the outdoors while being close to the town amenities. Great for families and visitors who appreciate nature. | Redbud Park, Daniel Boone National Forest, Fishing spots, Picnic areas, Tranquil environment |
| Morehead Lake Area | This area features scenic lakes and recreational opportunities, appealing to those who enjoy water activities such as fishing, kayaking, and swimming. | Morehead Lake, Lakeside area for picnics, Water sports, Fishing spots, Scenic views |
| West Morehead | Residential neighborhoods that offer a suburban feel. Good option for groups visiting for university events, family reunions, or local festivals. | Rowan County Fairgrounds, Local parks, Nearby restaurants, Community events |
Understanding Airbnb License Requirements & STR Laws in Morehead (2026)
While Morehead, Kentucky, United States currently shows low STR regulations, specific Airbnb license requirements might still exist or change. Always verify the latest short term rental regulations and Airbnb license requirements directly with local government authorities for Morehead to ensure full compliance before hosting.
(Source: AirROI data, 2026, finding no licensed listings among those analyzed)
Top Performing Airbnb Properties in Morehead (2026)
Benchmark your potential! Explore examples of top-performing Airbnb properties in Moreheadbased on Trailing Twelve Month (TTM) revenue. Analyze their characteristics, revenue, occupancy rate, and ADR to understand what drives success in this market.
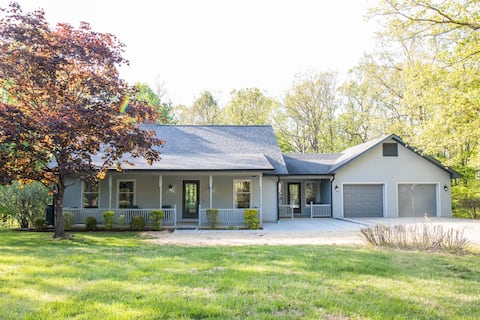
3BR 3 Bath home with hot tub next to Cave Run Lake
Entire Place • 3 bedrooms
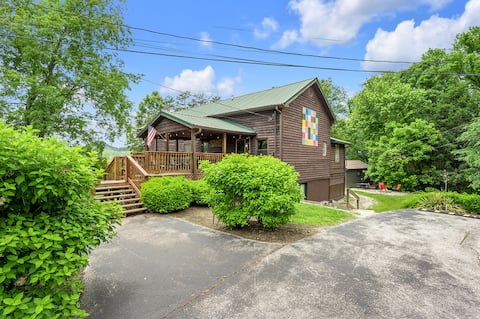
Spacious Cabin Near Cave Run Lake - Sleeps 10-12!
Entire Place • 3 bedrooms

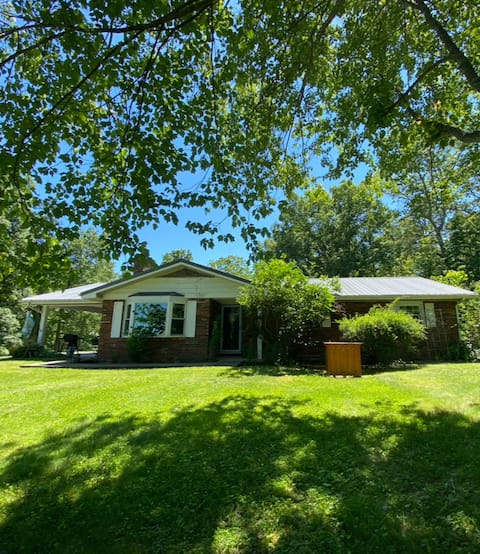
House Morehead KY 3BR 1.5 Bath
Entire Place • 3 bedrooms
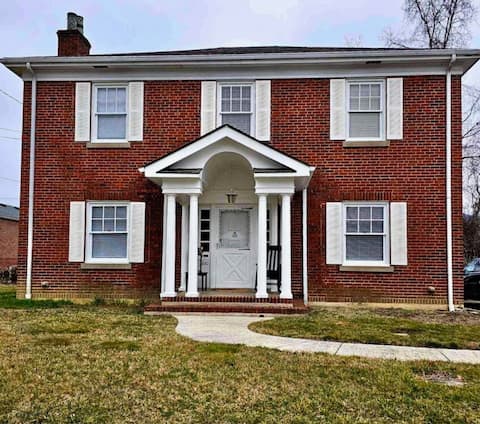
Shady Pines Sheltowee MSU Cave Run
Entire Place • 3 bedrooms

Sunset Cottage
Entire Place • 2 bedrooms
Elegant Eagle's Nest 4 bedroom, 2.5 baths
Entire Place • 4 bedrooms
Note: Performance varies based on location, size, amenities, seasonality, and management quality. Data reflects the past 12 months.
Top Performing Airbnb Hosts in Morehead (2026)
Learn from the best! This table showcases top-performing Airbnb hosts in Morehead based on the number of properties managed and estimated total revenue over the past year. Analyze their scale and performance metrics.
| Host Name | Properties | Grossing Revenue | Stay Reviews | Avg Rating |
|---|---|---|---|---|
| Katherine | 14 | $128,912 | 486 | 4.83/5.0 |
| Kasia | 5 | $90,344 | 138 | 4.83/5.0 |
| Justin | 5 | $57,417 | 129 | 4.69/5.0 |
| Sandpiper Homestays | 1 | $45,405 | 58 | 4.88/5.0 |
| Julie | 1 | $44,441 | 13 | 4.92/5.0 |
| Jill | 2 | $35,343 | 72 | 4.92/5.0 |
| Darinda | 1 | $31,044 | 203 | 4.92/5.0 |
| Angie | 1 | $29,550 | 113 | 5.00/5.0 |
| Nathan | 2 | $28,936 | 81 | 4.84/5.0 |
| Donna | 1 | $28,766 | 16 | 5.00/5.0 |
Analyzing the strategies of top hosts, such as their property selection, pricing, and guest communication, can offer valuable lessons for optimizing your own Airbnb operations in Morehead.
Dive Deeper: Advanced Morehead STR Market Data (2026)
Ready to unlock more insights? AirROI provides access to advanced metrics and comprehensive Airbnb data for Morehead. Explore detailed analytics beyond this report to refine your investment strategy, optimize pricing, and maximize your vacation rental profits.
Explore Advanced MetricsMorehead Short-Term Rental Market Composition (2026): Property & Room Types
Room Type Distribution
Property Type Distribution
Market Composition Insights for Morehead
- The Morehead Airbnb market composition is heavily skewed towards Entire Home/Apt listings, which make up 91.9% of the 62 active rentals. This indicates strong guest preference for privacy and space.
- Looking at the property type distribution in Morehead, Outdoor/Unique properties are the most common (48.4%), reflecting the local real estate landscape.
- Houses represent a significant 35.5% portion, catering likely to families or larger groups.
- Smaller segments like unique stays, hotel/boutique, others (combined 4.8%) offer potential for unique stay experiences.
Morehead Airbnb Room Capacity Analysis (2026): Bedroom Distribution
Distribution of Listings by Number of Bedrooms
Room Capacity Insights for Morehead
- The dominant room capacity in Morehead is 2 bedrooms listings, making up 41.9% of the market. This suggests a strong demand for properties suitable for couples or solo travelers.
- Together, 2 bedrooms and 1 bedroom properties represent 75.8% of the active Airbnb listings in Morehead, indicating a high concentration in these sizes.
- A significant 21.0% of listings offer 3+ bedrooms, catering to larger groups and families seeking more space in Morehead.
Morehead Vacation Rental Guest Capacity Trends (2026)
Distribution of Listings by Guest Capacity
Guest Capacity Insights for Morehead
- The most common guest capacity trend in Morehead vacation rentals is listings accommodating 4 guests (29%). This suggests the primary traveler segment is likely small families or groups.
- Properties designed for 4 guests and 6 guests dominate the Morehead STR market, accounting for 53.2% of listings.
- 41.9% of properties accommodate 6+ guests, serving the market segment for larger families or group travel in Morehead.
- On average, properties in Morehead are equipped to host 4.9 guests.
Morehead Airbnb Booking Patterns (2026): Available vs. Booked Days
Available Days Distribution
Booked Days Distribution
Booking Pattern Insights for Morehead
- The most common availability pattern in Morehead falls within the 271-366 days range, representing 59.7% of listings. This suggests many properties have significant open periods on their calendars.
- Approximately 90.3% of listings show high availability (181+ days open annually), indicating potential for increased bookings or specific owner usage patterns.
- For booked days, the 31-90 days range is most frequent in Morehead (30.6%), reflecting common guest stay durations or potential owner blocking patterns.
- A notable 11.3% of properties secure long booking periods (181+ days booked per year), highlighting successful long-term rental strategies or significant owner usage.
Morehead Airbnb Minimum Stay Requirements Analysis
Distribution of Listings by Minimum Night Requirement
1 Night
35 listings
56.5% of total
2 Nights
21 listings
33.9% of total
30+ Nights
6 listings
9.7% of total
Key Insights
- The most prevalent minimum stay requirement in Morehead is 1 Night, adopted by 56.5% of listings. This highlights the market's preference for shorter, flexible bookings.
- A strong majority (90.4%) of the Morehead Airbnb data shows acceptance of very short stays (1-2 nights), indicating a dynamic, high-turnover market.
Recommendations
- Align with the market by considering a 1 Night minimum stay, as 56.5% of Morehead hosts use this setting.
- Explore offering discounts for stays of 30+ nights to attract the 9.7% of the market seeking extended stays.
- Adjust minimum nights based on seasonality – potentially shorter during low season and longer during peak demand periods in Morehead.
Morehead Airbnb Cancellation Policy Trends Analysis (2026)
Flexible
21 listings
33.9% of total
Moderate
23 listings
37.1% of total
Firm
16 listings
25.8% of total
Strict
2 listings
3.2% of total
Cancellation Policy Insights for Morehead
- The prevailing Airbnb cancellation policy trend in Morehead is Moderate, used by 37.1% of listings.
- The market strongly favors guest-friendly terms, with 71.0% of listings offering Flexible or Moderate policies. This suggests guests in Morehead may expect booking flexibility.
- Strict cancellation policies are quite rare (3.2%), potentially making listings with this policy less competitive unless justified by high demand or property type.
Recommendations for Hosts
- Consider adopting a Moderate policy to align with the 37.1% market standard in Morehead.
- Using a Strict policy might deter some guests, as only 3.2% of listings use it. Evaluate if potential revenue protection outweighs possible lower booking rates.
- Regularly review your cancellation policy against competitors and market demand shifts in Morehead.
Morehead STR Booking Lead Time Analysis (2026)
Average Booking Lead Time by Month
Booking Lead Time Insights for Morehead
- The overall average booking lead time for vacation rentals in Morehead is 48 days.
- Guests book furthest in advance for stays during October (average 71 days), likely coinciding with peak travel demand or local events.
- The shortest booking windows occur for stays in January (average 12 days), indicating more last-minute travel plans during this time.
- Seasonally, Fall (58 days avg.) sees the longest lead times, while Winter (31 days avg.) has the shortest, reflecting typical travel planning cycles.
Recommendations for Hosts
- Use the overall average lead time (48 days) as a baseline for your pricing and availability strategy in Morehead.
- For October stays, consider implementing length-of-stay discounts or slightly higher rates for bookings made less than 71 days out to capitalize on advance planning.
- During January, focus on last-minute booking availability and promotions, as guests book with very short notice (12 days avg.).
- Target marketing efforts for the Fall season well in advance (at least 58 days) to capture early planners.
- Monitor your own booking lead times against these Morehead averages to identify opportunities for dynamic pricing adjustments.
Popular & Essential Airbnb Amenities in Morehead (2026)
Amenity Prevalence
Amenity Insights for Morehead
- Essential amenities in Morehead that guests expect include: Air conditioning, Wifi. Lacking these (any) could significantly impact bookings.
- Popular amenities like Smoke alarm, Free parking on premises, Kitchen are common but not universal. Offering these can provide a competitive edge.
Recommendations for Hosts
- Ensure your listing includes all essential amenities for Morehead: Air conditioning, Wifi.
- Prioritize adding missing essentials: Air conditioning, Wifi.
- Consider adding popular differentiators like Smoke alarm or Free parking on premises to increase appeal.
- Highlight unique or less common amenities you offer (e.g., hot tub, dedicated workspace, EV charger) in your listing description and photos.
- Regularly check competitor amenities in Morehead to stay competitive.
Morehead Airbnb Guest Demographics & Profile Analysis (2026)
Guest Profile Summary for Morehead
- The typical guest profile for Airbnb in Morehead consists of primarily domestic travelers (99%), often arriving from nearby Lexington, typically belonging to the Post-2000s (Gen Z/Alpha) group (50%), primarily speaking English or Spanish.
- Domestic travelers account for 99.3% of guests.
- Key international markets include United States (99.3%) and Canada (0.4%).
- Top languages spoken are English (84.8%) followed by Spanish (4%).
- A significant demographic segment is the Post-2000s (Gen Z/Alpha) group, representing 50% of guests.
Recommendations for Hosts
- Target domestic marketing efforts towards travelers from Lexington and Louisville.
- Tailor amenities and listing descriptions to appeal to the dominant Post-2000s (Gen Z/Alpha) demographic (e.g., highlight fast WiFi, smart home features, local guides).
- Highlight unique local experiences or amenities relevant to the primary guest profile.
- Consider seasonal promotions aligned with peak travel times for key origin markets.
Nearby Short-Term Rental Market Comparison
How does the Morehead Airbnb market stack up against its neighbors? Compare key performance metrics like average monthly revenue, ADR, and occupancy rates in surrounding areas to understand the broader regional STR landscape.
| Market | Active Properties | Monthly Revenue | Daily Rate | Avg. Occupancy |
|---|---|---|---|---|
| Sugar Grove | 16 | $6,172 | $489.99 | 43% |
| Creola | 18 | $5,899 | $403.00 | 53% |
| Hocking County | 11 | $5,712 | $508.21 | 49% |
| Rockbridge | 229 | $5,257 | $400.48 | 46% |
| Logan | 688 | $4,907 | $388.67 | 45% |
| Berne Township | 15 | $4,897 | $490.66 | 37% |
| Swan Township | 111 | $4,727 | $334.40 | 49% |
| South Bloomingville | 129 | $4,565 | $312.34 | 48% |
| Laurelville | 145 | $4,519 | $348.68 | 45% |
| Lawrenceburg | 65 | $4,477 | $360.32 | 45% |