Ludlow Airbnb Market Analysis 2026: Short Term Rental Data & Vacation Rental Statistics in Kentucky, United States
Is Airbnb profitable in Ludlow in 2026? Explore comprehensive Airbnb analytics for Ludlow, Kentucky, United States to uncover income potential. This 2026 STR market report for Ludlow, based on AirROI data from February 2025 to January 2026, reveals key trends in the niche market of 25 active listings.
Whether you're considering an Airbnb investment in Ludlow, optimizing your existing vacation rental, or exploring rental arbitrage opportunities, understanding the Ludlow Airbnb data is crucial. Leveraging the low regulation environment is key to maximizing your short term rental income potential. Let's dive into the specifics.
Key Ludlow Airbnb Performance Metrics Overview
Monthly Airbnb Revenue Variations & Income Potential in Ludlow (2026)
Understanding the monthly revenue variations for Airbnb listings in Ludlow is key to maximizing your short term rental income potential. Seasonality significantly impacts earnings. Our analysis, based on data from the past 12 months, shows that the peak revenue month for STRs in Ludlow is typically July, while January often presents the lowest earnings, highlighting opportunities for strategic pricing adjustments during shoulder and low seasons. Explore the typical Airbnb income in Ludlow across different performance tiers:
- Best-in-class properties (Top 10%) achieve $4,442+ monthly, often utilizing dynamic pricing and superior guest experiences.
- Strong performing properties (Top 25%) earn $3,016 or more, indicating effective management and desirable locations/amenities.
- Typical properties (Median) generate around $2,195 per month, representing the average market performance.
- Entry-level properties (Bottom 25%) see earnings around $1,545, often with potential for optimization.
Average Monthly Airbnb Earnings Trend in Ludlow
Ludlow Airbnb Occupancy Rate Trends (2026)
Maximize your bookings by understanding the Ludlow STR occupancy trends. Seasonal demand shifts significantly influence how often properties are booked. Typically, Julysees the highest demand (peak season occupancy), while January experiences the lowest (low season). Effective strategies, like adjusting minimum stays or offering promotions, can boost occupancy during slower periods. Here's how different property tiers perform in Ludlow:
- Best-in-class properties (Top 10%) achieve 85%+ occupancy, indicating high desirability and potentially optimized availability.
- Strong performing properties (Top 25%) maintain 72% or higher occupancy, suggesting good market fit and guest satisfaction.
- Typical properties (Median) have an occupancy rate around 59%.
- Entry-level properties (Bottom 25%) average 37% occupancy, potentially facing higher vacancy.
Average Monthly Occupancy Rate Trend in Ludlow
Average Daily Rate (ADR) Airbnb Trends in Ludlow (2026)
Effective short term rental pricing strategy in Ludlow involves understanding monthly ADR fluctuations. The Average Daily Rate (ADR) for Airbnb in Ludlow typically peaks in October and dips lowest during February. Leveraging Airbnb dynamic pricing tools or strategies based on this seasonality can significantly boost revenue. Here's a look at the typical nightly rates achieved:
- Best-in-class properties (Top 10%) command rates of $250+ per night, often due to premium features or locations.
- Strong performing properties (Top 25%) achieve nightly rates of $182 or more.
- Typical properties (Median) charge around $130 per night.
- Entry-level properties (Bottom 25%) earn around $105 per night.
Average Daily Rate (ADR) Trend by Month in Ludlow
Get Live Ludlow Market Intelligence 👇
Explore Real-time Analytics
Airbnb Seasonality Analysis & Trends in Ludlow (2026)
Peak Season (July, June, October)
- Revenue averages $3,059 per month
- Occupancy rates average 62.4%
- Daily rates average $163
Shoulder Season
- Revenue averages $2,526 per month
- Occupancy maintains around 55.7%
- Daily rates hold near $153
Low Season (January, February, April)
- Revenue drops to average $1,885 per month
- Occupancy decreases to average 50.7%
- Daily rates adjust to average $133
Seasonality Insights for Ludlow
- The Airbnb seasonality in Ludlow shows moderate seasonality with distinct peak and low periods. While the sections above show seasonal averages, it's also insightful to look at the extremes:
- During the high season, the absolute peak month showcases Ludlow's highest earning potential, with monthly revenues capable of climbing to $3,165, occupancy reaching a high of 66.2%, and ADRs peaking at $189.
- Conversely, the slowest single month of the year, typically falling within the low season, marks the market's lowest point. In this month, revenue might dip to $1,822, occupancy could drop to 41.1%, and ADRs may adjust down to $117.
- Understanding both the seasonal averages and these monthly peaks and troughs in revenue, occupancy, and ADR is crucial for maximizing your Airbnb profit potential in Ludlow.
Seasonal Strategies for Maximizing Profit
- Peak Season: Maximize revenue through premium pricing and potentially longer minimum stays. Ensure high availability.
- Low Season: Offer competitive pricing, special promotions (e.g., extended stay discounts), and flexible cancellation policies. Target off-season travelers like remote workers or budget-conscious guests.
- Shoulder Seasons: Implement dynamic pricing that balances peak and low rates. Target weekend travelers or specific events. Offer slightly more flexible terms than peak season.
- Regularly analyze your own performance against these Ludlow seasonality benchmarks and adjust your pricing and availability strategy accordingly.
Best Areas for Airbnb Investment in Ludlow (2026)
Exploring the top neighborhoods for short-term rentals in Ludlow? This section highlights key areas, outlining why they are attractive for hosts and guests, along with notable local attractions. Consider these locations based on your target guest profile and investment strategy.
| Neighborhood / Area | Why Host Here? (Target Guests & Appeal) | Key Attractions & Landmarks |
|---|---|---|
| Historic Downtown Ludlow | Charming area with historical significance and beautiful architecture. A great spot for those interested in local culture and community events. | Ludlow Historic District, Ludlow's Main Street, Local eateries and shops, Annual Ludlow Heritage Festival, Nearby Cincinnati attractions |
| Ludlow Riverfront | Scenic location along the river, perfect for visitors seeking outdoor activities and picturesque views. Popular for kayaking and riverside walks. | Ludlow Riverwalk Trail, Canoeing and kayaking opportunities, Park with picnic areas, River paddleboarding, Beautiful sunset views |
| Ludlow City Park | Family-friendly area with recreational facilities and green spaces. Ideal for families visiting Ludlow and seeking outdoor activities. | Playgrounds and sports fields, Walking trails, Picnic areas, Community events, Nature walks |
| Kentucky Eastside | A growing area with a mix of residential and commercial spaces. Ideal for those looking to invest in an up-and-coming neighborhood. | Local shops and cafes, Community events, Close to major highways, Easy access to nearby cities, Emerging art scene |
| I-75 Corridor | High visibility and accessibility make this location attractive for travelers seeking convenience. Good for short-term rentals targeting business and leisure travelers. | Major shopping centers, Restaurants and nightlife, Easy access to the interstate, Proximity to Cincinnati, Various entertainment options |
| Ludlow School District | Family-oriented community with good schools, appealing to families looking for short-term rentals during school events or relocations. | Family-friendly parks, Local schools and community events, Access to local sports facilities, Nearby shopping and dining, Proximity to educational institutions |
| Cincinnati Suburb | Close proximity to Cincinnati, attracting visitors who want to explore the city while enjoying a quieter suburban experience. | Cincinnati Zoo and Botanical Garden, Cincinnati Art Museum, Brooklyn Bridge Park, Various cultural attractions, Proximity to downtown Cincinnati |
| Ludlow Heights | Residential neighborhood with a mix of retirees and young families, providing a peaceful setting attractive to guests looking for a home-like experience. | Local cafes and shops, Community events, Quiet streets, Parks and recreation areas, Neighbors' welcoming atmosphere |
Understanding Airbnb License Requirements & STR Laws in Ludlow (2026)
While Ludlow, Kentucky, United States currently shows low STR regulations, specific Airbnb license requirements might still exist or change. Always verify the latest short term rental regulations and Airbnb license requirements directly with local government authorities for Ludlow to ensure full compliance before hosting.
(Source: AirROI data, 2026, finding no licensed listings among those analyzed)
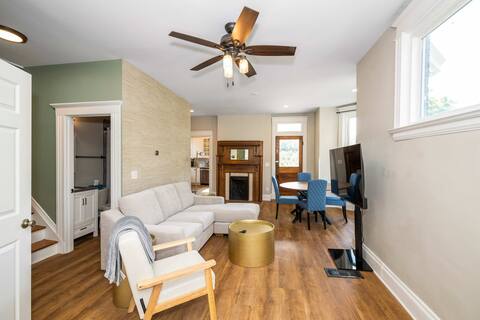
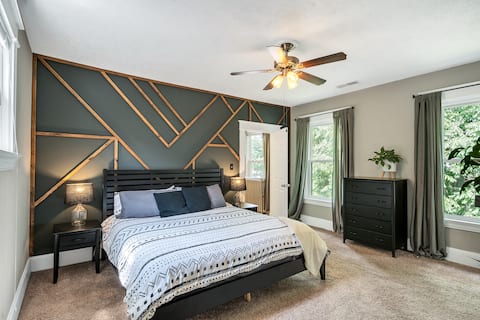
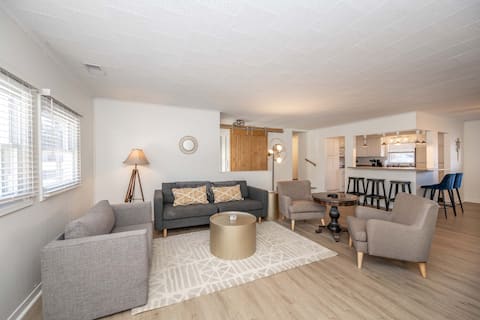
Top Performing Airbnb Properties in Ludlow (2026)
Benchmark your potential! Explore examples of top-performing Airbnb properties in Ludlowbased on Trailing Twelve Month (TTM) revenue. Analyze their characteristics, revenue, occupancy rate, and ADR to understand what drives success in this market.
Ludlow Lodge with City Views
Entire Place • 4 bedrooms
Hot Tub, Movie Theatre & great yard at Dr Duttons
Entire Place • 3 bedrooms

The Grand Elm House – Updated 4 BDR Close to City!
Entire Place • 4 bedrooms
The Grand Elm Suite 2
Entire Place • 3 bedrooms
Close to Stadiums, Downtown Cincy, & more, 1BR Apt
Entire Place • 1 bedroom

1BR Apt, Minutes to Downtown Cincy, Stadiums, Bars
Entire Place • 1 bedroom
Note: Performance varies based on location, size, amenities, seasonality, and management quality. Data reflects the past 12 months.
Top Performing Airbnb Hosts in Ludlow (2026)
Learn from the best! This table showcases top-performing Airbnb hosts in Ludlow based on the number of properties managed and estimated total revenue over the past year. Analyze their scale and performance metrics.
| Host Name | Properties | Grossing Revenue | Stay Reviews | Avg Rating |
|---|---|---|---|---|
| Grand Welcome Ohio Kentucky | 5 | $184,649 | 152 | 4.67/5.0 |
| Scot | 2 | $71,389 | 293 | 4.89/5.0 |
| Neat Suites | 3 | $63,691 | 385 | 4.84/5.0 |
| Connor | 2 | $48,878 | 1075 | 4.90/5.0 |
| Rolando | 1 | $28,244 | 259 | 4.99/5.0 |
| Jordan | 1 | $28,076 | 364 | 4.93/5.0 |
| Hayley | 1 | $27,956 | 51 | 4.94/5.0 |
| Aden Carlos | 1 | $22,636 | 204 | 4.88/5.0 |
| Gina | 1 | $18,790 | 391 | 4.91/5.0 |
| Vicky | 1 | $18,180 | 54 | 4.93/5.0 |
Analyzing the strategies of top hosts, such as their property selection, pricing, and guest communication, can offer valuable lessons for optimizing your own Airbnb operations in Ludlow.
Dive Deeper: Advanced Ludlow STR Market Data (2026)
Ready to unlock more insights? AirROI provides access to advanced metrics and comprehensive Airbnb data for Ludlow. Explore detailed analytics beyond this report to refine your investment strategy, optimize pricing, and maximize your vacation rental profits.
Explore Advanced MetricsLudlow Short-Term Rental Market Composition (2026): Property & Room Types
Room Type Distribution
Property Type Distribution
Market Composition Insights for Ludlow
- The Ludlow Airbnb market composition is heavily skewed towards Entire Home/Apt listings, which make up 100% of the 25 active rentals. This indicates strong guest preference for privacy and space.
- Looking at the property type distribution in Ludlow, House properties are the most common (52%), reflecting the local real estate landscape.
- Houses represent a significant 52% portion, catering likely to families or larger groups.
- Smaller segments like others (combined 4.0%) offer potential for unique stay experiences.
Ludlow Airbnb Room Capacity Analysis (2026): Bedroom Distribution
Distribution of Listings by Number of Bedrooms
Room Capacity Insights for Ludlow
- The dominant room capacity in Ludlow is 1 bedroom listings, making up 48% of the market. This suggests a strong demand for properties suitable for couples or solo travelers.
- Together, 1 bedroom and 2 bedrooms properties represent 72.0% of the active Airbnb listings in Ludlow, indicating a high concentration in these sizes.
- A significant 28.0% of listings offer 3+ bedrooms, catering to larger groups and families seeking more space in Ludlow.
Ludlow Vacation Rental Guest Capacity Trends (2026)
Distribution of Listings by Guest Capacity
Guest Capacity Insights for Ludlow
- The most common guest capacity trend in Ludlow vacation rentals is listings accommodating 6 guests (28%). This suggests the primary traveler segment is likely larger groups.
- Properties designed for 6 guests and 2 guests dominate the Ludlow STR market, accounting for 52.0% of listings.
- 44.0% of properties accommodate 6+ guests, serving the market segment for larger families or group travel in Ludlow.
- On average, properties in Ludlow are equipped to host 4.6 guests.
Ludlow Airbnb Booking Patterns (2026): Available vs. Booked Days
Available Days Distribution
Booked Days Distribution
Booking Pattern Insights for Ludlow
- The most common availability pattern in Ludlow falls within the 91-180 days range, representing 56% of listings. This suggests many properties have significant open periods on their calendars.
- Approximately 40.0% of listings show high availability (181+ days open annually), indicating potential for increased bookings or specific owner usage patterns.
- For booked days, the 181-270 days range is most frequent in Ludlow (52%), reflecting common guest stay durations or potential owner blocking patterns.
- A notable 60.0% of properties secure long booking periods (181+ days booked per year), highlighting successful long-term rental strategies or significant owner usage.
Ludlow Airbnb Minimum Stay Requirements Analysis
Distribution of Listings by Minimum Night Requirement
1 Night
10 listings
40% of total
2 Nights
9 listings
36% of total
7-29 Nights
2 listings
8% of total
30+ Nights
4 listings
16% of total
Key Insights
- The most prevalent minimum stay requirement in Ludlow is 1 Night, adopted by 40% of listings. This highlights the market's preference for shorter, flexible bookings.
- A strong majority (76.0%) of the Ludlow Airbnb data shows acceptance of very short stays (1-2 nights), indicating a dynamic, high-turnover market.
- A significant segment (16%) caters to monthly stays (30+ nights) in Ludlow, pointing to opportunities in the extended-stay market.
Recommendations
- Align with the market by considering a 1 Night minimum stay, as 40% of Ludlow hosts use this setting.
- Explore offering discounts for stays of 30+ nights to attract the 16% of the market seeking extended stays.
- Adjust minimum nights based on seasonality – potentially shorter during low season and longer during peak demand periods in Ludlow.
Ludlow Airbnb Cancellation Policy Trends Analysis (2026)
Flexible
2 listings
8% of total
Moderate
15 listings
60% of total
Firm
6 listings
24% of total
Strict
2 listings
8% of total
Cancellation Policy Insights for Ludlow
- The prevailing Airbnb cancellation policy trend in Ludlow is Moderate, used by 60% of listings.
- There's a relatively balanced mix between guest-friendly (68.0%) and stricter (32.0%) policies, offering choices for different guest needs.
- Strict cancellation policies are quite rare (8%), potentially making listings with this policy less competitive unless justified by high demand or property type.
Recommendations for Hosts
- Consider adopting a Moderate policy to align with the 60% market standard in Ludlow.
- Using a Strict policy might deter some guests, as only 8% of listings use it. Evaluate if potential revenue protection outweighs possible lower booking rates.
- Regularly review your cancellation policy against competitors and market demand shifts in Ludlow.
Ludlow STR Booking Lead Time Analysis (2026)
Average Booking Lead Time by Month
Booking Lead Time Insights for Ludlow
- The overall average booking lead time for vacation rentals in Ludlow is 29 days.
- Guests book furthest in advance for stays during July (average 45 days), likely coinciding with peak travel demand or local events.
- The shortest booking windows occur for stays in February (average 19 days), indicating more last-minute travel plans during this time.
- Seasonally, Summer (38 days avg.) sees the longest lead times, while Winter (26 days avg.) has the shortest, reflecting typical travel planning cycles.
Recommendations for Hosts
- Use the overall average lead time (29 days) as a baseline for your pricing and availability strategy in Ludlow.
- For July stays, consider implementing length-of-stay discounts or slightly higher rates for bookings made less than 45 days out to capitalize on advance planning.
- Target marketing efforts for the Summer season well in advance (at least 38 days) to capture early planners.
- Monitor your own booking lead times against these Ludlow averages to identify opportunities for dynamic pricing adjustments.
Popular & Essential Airbnb Amenities in Ludlow (2026)
Amenity Prevalence
Amenity Insights for Ludlow
- Essential amenities in Ludlow that guests expect include: TV, Air conditioning, Heating, Carbon monoxide alarm, Shampoo, Wifi, Smoke alarm, Cooking basics, Coffee maker, Dishes and silverware. Lacking these (any) could significantly impact bookings.
Recommendations for Hosts
- Ensure your listing includes all essential amenities for Ludlow: TV, Air conditioning, Heating, Carbon monoxide alarm, Shampoo, Wifi, Smoke alarm, Cooking basics, Coffee maker, Dishes and silverware.
- Prioritize adding missing essentials: Dishes and silverware.
- Highlight unique or less common amenities you offer (e.g., hot tub, dedicated workspace, EV charger) in your listing description and photos.
- Regularly check competitor amenities in Ludlow to stay competitive.
Ludlow Airbnb Guest Demographics & Profile Analysis (2026)
Guest Profile Summary for Ludlow
- The typical guest profile for Airbnb in Ludlow consists of primarily domestic travelers (97%), often arriving from nearby Cincinnati, typically belonging to the Post-2000s (Gen Z/Alpha) group (50%), primarily speaking English or Spanish.
- Domestic travelers account for 96.6% of guests.
- Key international markets include United States (96.6%) and United Kingdom (0.8%).
- Top languages spoken are English (80.3%) followed by Spanish (8.1%).
- A significant demographic segment is the Post-2000s (Gen Z/Alpha) group, representing 50% of guests.
Recommendations for Hosts
- Target domestic marketing efforts towards travelers from Cincinnati and Columbus.
- Tailor amenities and listing descriptions to appeal to the dominant Post-2000s (Gen Z/Alpha) demographic (e.g., highlight fast WiFi, smart home features, local guides).
- Highlight unique local experiences or amenities relevant to the primary guest profile.
- Consider seasonal promotions aligned with peak travel times for key origin markets.
Nearby Short-Term Rental Market Comparison
How does the Ludlow Airbnb market stack up against its neighbors? Compare key performance metrics like average monthly revenue, ADR, and occupancy rates in surrounding areas to understand the broader regional STR landscape.
| Market | Active Properties | Monthly Revenue | Daily Rate | Avg. Occupancy |
|---|---|---|---|---|
| Lawrenceburg | 65 | $4,477 | $360.32 | 45% |
| Crittenden | 18 | $3,944 | $261.97 | 48% |
| Walton | 22 | $3,840 | $225.35 | 58% |
| Burlington | 17 | $3,773 | $236.57 | 48% |
| Williamstown | 204 | $3,674 | $263.96 | 49% |
| Deerfield Township | 33 | $3,565 | $288.53 | 41% |
| Lebanon | 30 | $3,554 | $277.26 | 44% |
| Corinth | 17 | $3,457 | $270.49 | 48% |
| Oxford | 120 | $3,412 | $562.95 | 36% |
| Versailles | 61 | $3,375 | $350.32 | 44% |