Campton Airbnb Market Analysis 2026: Short Term Rental Data & Vacation Rental Statistics in Kentucky, United States
Is Airbnb profitable in Campton in 2026? Explore comprehensive Airbnb analytics for Campton, Kentucky, United States to uncover income potential. This 2026 STR market report for Campton, based on AirROI data from February 2025 to January 2026, reveals key trends in the niche market of 194 active listings.
Whether you're considering an Airbnb investment in Campton, optimizing your existing vacation rental, or exploring rental arbitrage opportunities, understanding the Campton Airbnb data is crucial. Leveraging the low regulation environment is key to maximizing your short term rental income potential. Let's dive into the specifics.
Key Campton Airbnb Performance Metrics Overview
Monthly Airbnb Revenue Variations & Income Potential in Campton (2026)
Understanding the monthly revenue variations for Airbnb listings in Campton is key to maximizing your short term rental income potential. Seasonality significantly impacts earnings. Our analysis, based on data from the past 12 months, shows that the peak revenue month for STRs in Campton is typically October, while January often presents the lowest earnings, highlighting opportunities for strategic pricing adjustments during shoulder and low seasons. Explore the typical Airbnb income in Campton across different performance tiers:
- Best-in-class properties (Top 10%) achieve $6,959+ monthly, often utilizing dynamic pricing and superior guest experiences.
- Strong performing properties (Top 25%) earn $4,775 or more, indicating effective management and desirable locations/amenities.
- Typical properties (Median) generate around $2,868 per month, representing the average market performance.
- Entry-level properties (Bottom 25%) see earnings around $1,591, often with potential for optimization.
Average Monthly Airbnb Earnings Trend in Campton
Campton Airbnb Occupancy Rate Trends (2026)
Maximize your bookings by understanding the Campton STR occupancy trends. Seasonal demand shifts significantly influence how often properties are booked. Typically, Octobersees the highest demand (peak season occupancy), while January experiences the lowest (low season). Effective strategies, like adjusting minimum stays or offering promotions, can boost occupancy during slower periods. Here's how different property tiers perform in Campton:
- Best-in-class properties (Top 10%) achieve 71%+ occupancy, indicating high desirability and potentially optimized availability.
- Strong performing properties (Top 25%) maintain 57% or higher occupancy, suggesting good market fit and guest satisfaction.
- Typical properties (Median) have an occupancy rate around 40%.
- Entry-level properties (Bottom 25%) average 24% occupancy, potentially facing higher vacancy.
Average Monthly Occupancy Rate Trend in Campton
Average Daily Rate (ADR) Airbnb Trends in Campton (2026)
Effective short term rental pricing strategy in Campton involves understanding monthly ADR fluctuations. The Average Daily Rate (ADR) for Airbnb in Campton typically peaks in October and dips lowest during February. Leveraging Airbnb dynamic pricing tools or strategies based on this seasonality can significantly boost revenue. Here's a look at the typical nightly rates achieved:
- Best-in-class properties (Top 10%) command rates of $443+ per night, often due to premium features or locations.
- Strong performing properties (Top 25%) achieve nightly rates of $308 or more.
- Typical properties (Median) charge around $226 per night.
- Entry-level properties (Bottom 25%) earn around $181 per night.
Average Daily Rate (ADR) Trend by Month in Campton
Get Live Campton Market Intelligence 👇

Explore Real-time Analytics
Airbnb Seasonality Analysis & Trends in Campton (2026)
Peak Season (October, July, June)
- Revenue averages $4,971 per month
- Occupancy rates average 52.8%
- Daily rates average $293
Shoulder Season
- Revenue averages $3,644 per month
- Occupancy maintains around 42.3%
- Daily rates hold near $271
Low Season (January, February, December)
- Revenue drops to average $2,086 per month
- Occupancy decreases to average 26.8%
- Daily rates adjust to average $249
Seasonality Insights for Campton
- The Airbnb seasonality in Campton shows highly seasonal trends requiring careful strategy. While the sections above show seasonal averages, it's also insightful to look at the extremes:
- During the high season, the absolute peak month showcases Campton's highest earning potential, with monthly revenues capable of climbing to $5,790, occupancy reaching a high of 59.5%, and ADRs peaking at $313.
- Conversely, the slowest single month of the year, typically falling within the low season, marks the market's lowest point. In this month, revenue might dip to $1,706, occupancy could drop to 21.3%, and ADRs may adjust down to $222.
- Understanding both the seasonal averages and these monthly peaks and troughs in revenue, occupancy, and ADR is crucial for maximizing your Airbnb profit potential in Campton.
Seasonal Strategies for Maximizing Profit
- Peak Season: Maximize revenue through premium pricing and potentially longer minimum stays. Ensure high availability.
- Low Season: Offer competitive pricing, special promotions (e.g., extended stay discounts), and flexible cancellation policies. Target off-season travelers like remote workers or budget-conscious guests.
- Shoulder Seasons: Implement dynamic pricing that balances peak and low rates. Target weekend travelers or specific events. Offer slightly more flexible terms than peak season.
- Regularly analyze your own performance against these Campton seasonality benchmarks and adjust your pricing and availability strategy accordingly.
Best Areas for Airbnb Investment in Campton (2026)
Exploring the top neighborhoods for short-term rentals in Campton? This section highlights key areas, outlining why they are attractive for hosts and guests, along with notable local attractions. Consider these locations based on your target guest profile and investment strategy.
| Neighborhood / Area | Why Host Here? (Target Guests & Appeal) | Key Attractions & Landmarks |
|---|---|---|
| Red River Gorge | One of the most popular outdoor destinations in Kentucky, known for its stunning natural beauty and hiking opportunities. It's a favorite for tourists seeking adventure and nature experiences. | Natural Bridge State Resort Park, Red River Gorge Geological Area, Rock Bridge, Sky Bridge, Cumberland Falls State Park |
| Campton Lake | A serene area perfect for fishing and relaxation, appealing to families and individuals looking for a peaceful getaway close to nature. | Campton Lake, Fishing spots, Hiking trails, Picnic areas |
| Daniel Boone National Forest | An incredible location for outdoor enthusiasts, attracting visitors interested in camping, hiking, and stunning landscapes. | Cumberland Falls, Red River Gorge, Mammoth Cave National Park, Canoeing on the Kentucky River |
| Natural Bridge State Resort Park | Famous for its natural sandstone arch and beautiful hiking trails. This area is ideal for those who want to explore the beauty of the region. | Natural Bridge, Sky Lift, Hiking Trails, Picnic Areas |
| Carter Caves State Resort Park | Known for its stunning caves and lush forests, attracting visitors who enjoy caving and outdoor recreation. | Carter Caves, Caving Tours, Hiking Trails, Fishing |
| Wilderness Road State Park | Rich in history and natural beauty, ideal for history buffs as well as outdoor lovers. | Reconstructed Fort |
| Estill County | A region with historical significance and natural beauty, appealing for those looking for a rustic getaway. | Irvine Railroad Museum, Estill County Historical Society |
| Pine Ridge | A small community known for its local charm and proximity to nature spots, making it a good area for a relaxing retreat. | Local farms, Small shops, Access to natural attractions |
Understanding Airbnb License Requirements & STR Laws in Campton (2026)
While Campton, Kentucky, United States currently shows low STR regulations, specific Airbnb license requirements might still exist or change. Always verify the latest short term rental regulations and Airbnb license requirements directly with local government authorities for Campton to ensure full compliance before hosting.
(Source: AirROI data, 2026, finding no licensed listings among those analyzed)
Top Performing Airbnb Properties in Campton (2026)
Benchmark your potential! Explore examples of top-performing Airbnb properties in Camptonbased on Trailing Twelve Month (TTM) revenue. Analyze their characteristics, revenue, occupancy rate, and ADR to understand what drives success in this market.
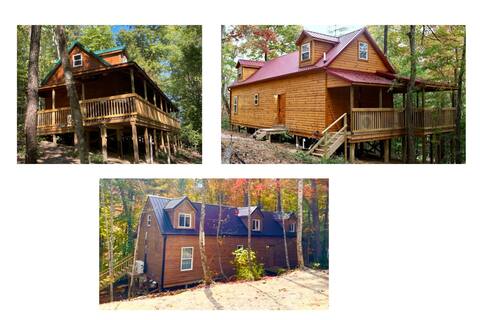
3 Cabins | 30+ | 3-Hot Tubs| DogOK | FirePit
Entire Place • 12 bedrooms

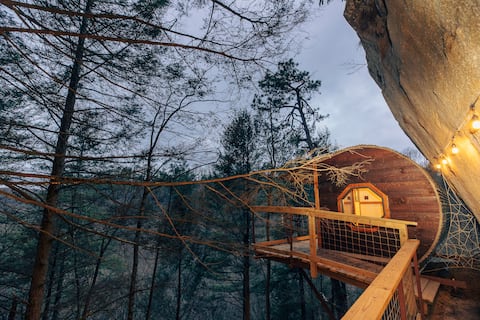
Cliff Dweller: Spend a night Suspended from the R
Entire Place • 1 bedroom
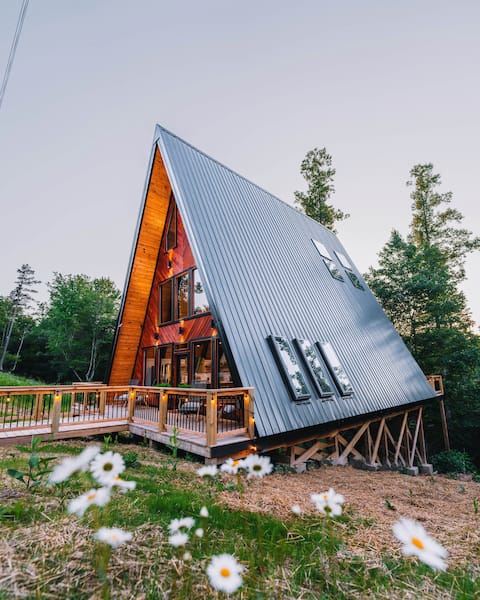
Hot Tub | A-Frame Cabin Sleeps 8 | Fire Pit | Pets
Entire Place • 3 bedrooms
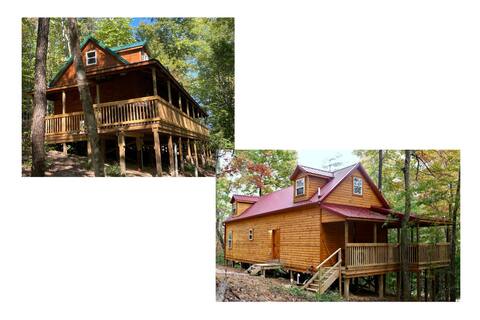
2 Cabins- Hot Tubs | Dogs OK | Hiking | Climbing
Entire Place • 8 bedrooms
Grey Dreamer a Pirate Ship in the Sky!
Entire Place • 2 bedrooms
Epic views~Privacy~HOT TUB~5 bedrooms~Pool Table
Entire Place • 5 bedrooms
Note: Performance varies based on location, size, amenities, seasonality, and management quality. Data reflects the past 12 months.
Top Performing Airbnb Hosts in Campton (2026)
Learn from the best! This table showcases top-performing Airbnb hosts in Campton based on the number of properties managed and estimated total revenue over the past year. Analyze their scale and performance metrics.
| Host Name | Properties | Grossing Revenue | Stay Reviews | Avg Rating |
|---|---|---|---|---|
| Ian | 49 | $1,193,589 | 366 | 4.74/5.0 |
| Amy | 13 | $804,822 | 606 | 4.86/5.0 |
| StayOver Cabin Rentals | 24 | $723,259 | 1013 | 4.71/5.0 |
| StayDogRentals - Jason | 5 | $492,964 | 189 | 4.92/5.0 |
| Nancy | 11 | $484,355 | 377 | 4.83/5.0 |
| Bear Branch Cabins | 11 | $448,891 | 1142 | 4.87/5.0 |
| RRG Getaways | 8 | $386,322 | 1026 | 4.79/5.0 |
| Mike | 3 | $206,744 | 169 | 4.93/5.0 |
| Lauren | 4 | $195,095 | 232 | 5.00/5.0 |
| Stacy | 4 | $166,535 | 396 | 4.85/5.0 |
Analyzing the strategies of top hosts, such as their property selection, pricing, and guest communication, can offer valuable lessons for optimizing your own Airbnb operations in Campton.
Dive Deeper: Advanced Campton STR Market Data (2026)
Ready to unlock more insights? AirROI provides access to advanced metrics and comprehensive Airbnb data for Campton. Explore detailed analytics beyond this report to refine your investment strategy, optimize pricing, and maximize your vacation rental profits.
Explore Advanced MetricsCampton Short-Term Rental Market Composition (2026): Property & Room Types
Room Type Distribution
Property Type Distribution
Market Composition Insights for Campton
- The Campton Airbnb market composition is heavily skewed towards Entire Home/Apt listings, which make up 99% of the 194 active rentals. This indicates strong guest preference for privacy and space.
- Looking at the property type distribution in Campton, Outdoor/Unique properties are the most common (80.9%), reflecting the local real estate landscape.
- Smaller segments like unique stays, hotel/boutique (combined 5.6%) offer potential for unique stay experiences.
Campton Airbnb Room Capacity Analysis (2026): Bedroom Distribution
Distribution of Listings by Number of Bedrooms
Room Capacity Insights for Campton
- The dominant room capacity in Campton is 2 bedrooms listings, making up 32.5% of the market. This suggests a strong demand for properties suitable for couples or solo travelers.
- Together, 2 bedrooms and 1 bedroom properties represent 61.4% of the active Airbnb listings in Campton, indicating a high concentration in these sizes.
- A significant 37.1% of listings offer 3+ bedrooms, catering to larger groups and families seeking more space in Campton.
Campton Vacation Rental Guest Capacity Trends (2026)
Distribution of Listings by Guest Capacity
Guest Capacity Insights for Campton
- The most common guest capacity trend in Campton vacation rentals is listings accommodating 8+ guests (27.8%). This suggests the primary traveler segment is likely larger groups.
- Properties designed for 8+ guests and 4 guests dominate the Campton STR market, accounting for 55.6% of listings.
- 46.9% of properties accommodate 6+ guests, serving the market segment for larger families or group travel in Campton.
- On average, properties in Campton are equipped to host 5.2 guests.
Campton Airbnb Booking Patterns (2026): Available vs. Booked Days
Available Days Distribution
Booked Days Distribution
Booking Pattern Insights for Campton
- The most common availability pattern in Campton falls within the 181-270 days range, representing 47.9% of listings. This suggests many properties have significant open periods on their calendars.
- Approximately 79.9% of listings show high availability (181+ days open annually), indicating potential for increased bookings or specific owner usage patterns.
- For booked days, the 91-180 days range is most frequent in Campton (47.9%), reflecting common guest stay durations or potential owner blocking patterns.
- A notable 21.7% of properties secure long booking periods (181+ days booked per year), highlighting successful long-term rental strategies or significant owner usage.
Campton Airbnb Minimum Stay Requirements Analysis
Distribution of Listings by Minimum Night Requirement
1 Night
30 listings
15.5% of total
2 Nights
77 listings
39.7% of total
3 Nights
3 listings
1.5% of total
30+ Nights
84 listings
43.3% of total
Key Insights
- The most prevalent minimum stay requirement in Campton is 30+ Nights, adopted by 43.3% of listings. This highlights the market's preference for longer commitments.
- A significant segment (43.3%) caters to monthly stays (30+ nights) in Campton, pointing to opportunities in the extended-stay market.
Recommendations
- Align with the market by considering a 30+ Nights minimum stay, as 43.3% of Campton hosts use this setting.
- If feasible, allowing 1-night stays, especially midweek or during low season, could capture last-minute bookings, as only 15.5% currently do.
- A 2-night minimum appears standard (39.7%). Consider this for weekends or peak periods.
- Explore offering discounts for stays of 30+ nights to attract the 43.3% of the market seeking extended stays.
- Adjust minimum nights based on seasonality – potentially shorter during low season and longer during peak demand periods in Campton.
Campton Airbnb Cancellation Policy Trends Analysis (2026)
Limited
19 listings
9.8% of total
Super Strict 30 Days
21 listings
10.8% of total
Flexible
11 listings
5.7% of total
Moderate
30 listings
15.5% of total
Firm
97 listings
50% of total
Strict
16 listings
8.2% of total
Cancellation Policy Insights for Campton
- The prevailing Airbnb cancellation policy trend in Campton is Firm, used by 50% of listings.
- A majority (58.2%) of hosts in Campton utilize Firm or Strict policies, indicating a market where hosts prioritize booking security.
- Strict cancellation policies are quite rare (8.2%), potentially making listings with this policy less competitive unless justified by high demand or property type.
Recommendations for Hosts
- Consider adopting a Firm policy to align with the 50% market standard in Campton.
- Using a Strict policy might deter some guests, as only 8.2% of listings use it. Evaluate if potential revenue protection outweighs possible lower booking rates.
- Regularly review your cancellation policy against competitors and market demand shifts in Campton.
Campton STR Booking Lead Time Analysis (2026)
Average Booking Lead Time by Month
Booking Lead Time Insights for Campton
- The overall average booking lead time for vacation rentals in Campton is 46 days.
- Guests book furthest in advance for stays during October (average 74 days), likely coinciding with peak travel demand or local events.
- The shortest booking windows occur for stays in January (average 23 days), indicating more last-minute travel plans during this time.
- Seasonally, Fall (62 days avg.) sees the longest lead times, while Winter (28 days avg.) has the shortest, reflecting typical travel planning cycles.
Recommendations for Hosts
- Use the overall average lead time (46 days) as a baseline for your pricing and availability strategy in Campton.
- For October stays, consider implementing length-of-stay discounts or slightly higher rates for bookings made less than 74 days out to capitalize on advance planning.
- Target marketing efforts for the Fall season well in advance (at least 62 days) to capture early planners.
- Monitor your own booking lead times against these Campton averages to identify opportunities for dynamic pricing adjustments.
Popular & Essential Airbnb Amenities in Campton (2026)
Amenity Prevalence
Amenity Insights for Campton
- Essential amenities in Campton that guests expect include: Heating, Air conditioning, Smoke alarm. Lacking these (any) could significantly impact bookings.
- Popular amenities like Refrigerator, Kitchen, Wifi are common but not universal. Offering these can provide a competitive edge.
- Warning: Wifi is not universally provided but is considered essential globally. Ensure reliable Wifi is offered.
Recommendations for Hosts
- Ensure your listing includes all essential amenities for Campton: Heating, Air conditioning, Smoke alarm.
- Prioritize adding missing essentials: Heating, Air conditioning, Smoke alarm.
- Consider adding popular differentiators like Refrigerator or Kitchen to increase appeal.
- Highlight unique or less common amenities you offer (e.g., hot tub, dedicated workspace, EV charger) in your listing description and photos.
- Regularly check competitor amenities in Campton to stay competitive.
Campton Airbnb Guest Demographics & Profile Analysis (2026)
Guest Profile Summary for Campton
- The typical guest profile for Airbnb in Campton consists of primarily domestic travelers (99%), often arriving from nearby Louisville, typically belonging to the Post-2000s (Gen Z/Alpha) group (50%), primarily speaking English or Spanish.
- Domestic travelers account for 98.6% of guests.
- Key international markets include United States (98.6%) and United Kingdom (0.4%).
- Top languages spoken are English (81.5%) followed by Spanish (7.3%).
- A significant demographic segment is the Post-2000s (Gen Z/Alpha) group, representing 50% of guests.
Recommendations for Hosts
- Target domestic marketing efforts towards travelers from Louisville and Cincinnati.
- Tailor amenities and listing descriptions to appeal to the dominant Post-2000s (Gen Z/Alpha) demographic (e.g., highlight fast WiFi, smart home features, local guides).
- Highlight unique local experiences or amenities relevant to the primary guest profile.
- Consider seasonal promotions aligned with peak travel times for key origin markets.
Nearby Short-Term Rental Market Comparison
How does the Campton Airbnb market stack up against its neighbors? Compare key performance metrics like average monthly revenue, ADR, and occupancy rates in surrounding areas to understand the broader regional STR landscape.
| Market | Active Properties | Monthly Revenue | Daily Rate | Avg. Occupancy |
|---|---|---|---|---|
| Lawrenceburg | 65 | $4,477 | $360.32 | 45% |
| Crittenden | 18 | $3,944 | $261.97 | 48% |
| Strawberry Plains | 13 | $3,880 | $222.81 | 54% |
| Walton | 22 | $3,840 | $225.35 | 58% |
| Williamstown | 204 | $3,674 | $263.96 | 49% |
| Rogers | 115 | $3,484 | $255.43 | 45% |
| Caryville | 17 | $3,478 | $410.81 | 34% |
| Corinth | 17 | $3,457 | $270.49 | 48% |
| Versailles | 61 | $3,375 | $350.32 | 44% |
| LaFollette | 157 | $3,289 | $476.63 | 32% |