Bardstown Airbnb Market Analysis 2026: Short Term Rental Data & Vacation Rental Statistics in Kentucky, United States
Is Airbnb profitable in Bardstown in 2026? Explore comprehensive Airbnb analytics for Bardstown, Kentucky, United States to uncover income potential. This 2026 STR market report for Bardstown, based on AirROI data from February 2025 to January 2026, reveals key trends in the niche market of 122 active listings.
Whether you're considering an Airbnb investment in Bardstown, optimizing your existing vacation rental, or exploring rental arbitrage opportunities, understanding the Bardstown Airbnb data is crucial. Leveraging the low regulation environment is key to maximizing your short term rental income potential. Let's dive into the specifics.
Key Bardstown Airbnb Performance Metrics Overview
Monthly Airbnb Revenue Variations & Income Potential in Bardstown (2026)
Understanding the monthly revenue variations for Airbnb listings in Bardstown is key to maximizing your short term rental income potential. Seasonality significantly impacts earnings. Our analysis, based on data from the past 12 months, shows that the peak revenue month for STRs in Bardstown is typically October, while February often presents the lowest earnings, highlighting opportunities for strategic pricing adjustments during shoulder and low seasons. Explore the typical Airbnb income in Bardstown across different performance tiers:
- Best-in-class properties (Top 10%) achieve $6,514+ monthly, often utilizing dynamic pricing and superior guest experiences.
- Strong performing properties (Top 25%) earn $4,397 or more, indicating effective management and desirable locations/amenities.
- Typical properties (Median) generate around $2,617 per month, representing the average market performance.
- Entry-level properties (Bottom 25%) see earnings around $1,568, often with potential for optimization.
Average Monthly Airbnb Earnings Trend in Bardstown
Bardstown Airbnb Occupancy Rate Trends (2026)
Maximize your bookings by understanding the Bardstown STR occupancy trends. Seasonal demand shifts significantly influence how often properties are booked. Typically, Octobersees the highest demand (peak season occupancy), while January experiences the lowest (low season). Effective strategies, like adjusting minimum stays or offering promotions, can boost occupancy during slower periods. Here's how different property tiers perform in Bardstown:
- Best-in-class properties (Top 10%) achieve 70%+ occupancy, indicating high desirability and potentially optimized availability.
- Strong performing properties (Top 25%) maintain 58% or higher occupancy, suggesting good market fit and guest satisfaction.
- Typical properties (Median) have an occupancy rate around 41%.
- Entry-level properties (Bottom 25%) average 26% occupancy, potentially facing higher vacancy.
Average Monthly Occupancy Rate Trend in Bardstown
Average Daily Rate (ADR) Airbnb Trends in Bardstown (2026)
Effective short term rental pricing strategy in Bardstown involves understanding monthly ADR fluctuations. The Average Daily Rate (ADR) for Airbnb in Bardstown typically peaks in September and dips lowest during February. Leveraging Airbnb dynamic pricing tools or strategies based on this seasonality can significantly boost revenue. Here's a look at the typical nightly rates achieved:
- Best-in-class properties (Top 10%) command rates of $429+ per night, often due to premium features or locations.
- Strong performing properties (Top 25%) achieve nightly rates of $302 or more.
- Typical properties (Median) charge around $211 per night.
- Entry-level properties (Bottom 25%) earn around $153 per night.
Average Daily Rate (ADR) Trend by Month in Bardstown
Get Live Bardstown Market Intelligence 👇

Explore Real-time Analytics
Airbnb Seasonality Analysis & Trends in Bardstown (2026)
Peak Season (October, September, July)
- Revenue averages $4,423 per month
- Occupancy rates average 52.6%
- Daily rates average $270
Shoulder Season
- Revenue averages $3,313 per month
- Occupancy maintains around 42.7%
- Daily rates hold near $251
Low Season (January, February, March)
- Revenue drops to average $2,209 per month
- Occupancy decreases to average 31.7%
- Daily rates adjust to average $228
Seasonality Insights for Bardstown
- The Airbnb seasonality in Bardstown shows highly seasonal trends requiring careful strategy. While the sections above show seasonal averages, it's also insightful to look at the extremes:
- During the high season, the absolute peak month showcases Bardstown's highest earning potential, with monthly revenues capable of climbing to $4,894, occupancy reaching a high of 58.1%, and ADRs peaking at $283.
- Conversely, the slowest single month of the year, typically falling within the low season, marks the market's lowest point. In this month, revenue might dip to $1,842, occupancy could drop to 24.5%, and ADRs may adjust down to $217.
- Understanding both the seasonal averages and these monthly peaks and troughs in revenue, occupancy, and ADR is crucial for maximizing your Airbnb profit potential in Bardstown.
Seasonal Strategies for Maximizing Profit
- Peak Season: Maximize revenue through premium pricing and potentially longer minimum stays. Ensure high availability.
- Low Season: Offer competitive pricing, special promotions (e.g., extended stay discounts), and flexible cancellation policies. Target off-season travelers like remote workers or budget-conscious guests.
- Shoulder Seasons: Implement dynamic pricing that balances peak and low rates. Target weekend travelers or specific events. Offer slightly more flexible terms than peak season.
- Regularly analyze your own performance against these Bardstown seasonality benchmarks and adjust your pricing and availability strategy accordingly.
Best Areas for Airbnb Investment in Bardstown (2026)
Exploring the top neighborhoods for short-term rentals in Bardstown? This section highlights key areas, outlining why they are attractive for hosts and guests, along with notable local attractions. Consider these locations based on your target guest profile and investment strategy.
| Neighborhood / Area | Why Host Here? (Target Guests & Appeal) | Key Attractions & Landmarks |
|---|---|---|
| Historic Bardstown | Known as the 'Bourbon Capital of the World', Bardstown offers a rich history with preserved architecture and a charming downtown area. Tourists love the small-town feel combined with cultural offerings. | Bardstown Bourbon Company, My Old Kentucky Home State Park, Old Talbott Tavern, Civil War Museum, Friedman Memorial Park |
| Bardstown Road | This area features a vibrant community with a mix of local shops, restaurants, and cafes. It attracts both tourists and locals looking for unique dining and shopping experiences. | Bardstown Road Farmers Market, Talbott's Tavern, local boutiques, Cedar-Filming Trail, Bardstown Art Gallery |
| Bourbon Trail | The Bourbon Trail passes through Bardstown, attracting whiskey lovers and tourists interested in distilleries. Investing here can cater to visitors seeking unique tasting experiences and distillery tours. | Heaven Hill Distillery, Barton 1792 Distillery, Lux Row Distillers, distillery tours, Bourbon Barrel Trove |
| Old Town | Old Town is picturesque and historical, boasting classic American architecture. This area is a favorite for tourists, especially during festival seasons, making it ripe for Airbnb hosting. | Bardstown Historical Society, Old Courthouse, festival events, local arts festival, historic markers |
| Bardstown Parks | It offers beautiful outdoor spaces for families and recreation enthusiasts. The parks attract visitors looking to experience the natural beauty of Bardstown. | Bardstown City Park, Bardstown Community Park, walking trails, playgrounds, picnic areas |
| Nelson County | This region surrounds Bardstown and offers rural experiences, attracting visitors interested in outdoor activities like hiking and exploring nature. | My Old Kentucky Home State Park, Duncansville Caves, Nelson County Winery, Nelson County Fair, local farms |
| Culinary Scene | Bardstown has a growing reputation for its culinary offerings, with several acclaimed restaurants. This attracts foodies who are looking for gourmet experiences. | The Salted Pig, The Old Talbott Tavern, local food festivals, winery events, farm-to-table dining |
| Cultural Events | Bardstown hosts a variety of cultural and musical events throughout the year, making it an attractive destination for tourists looking for entertainment and community activities. | Bardstown Arts & Crafts Festival, My Old Kentucky Home State Park events, live music venues, historical reenactments, holiday parades |
Understanding Airbnb License Requirements & STR Laws in Bardstown (2026)
While Bardstown, Kentucky, United States currently shows low STR regulations, specific Airbnb license requirements might still exist or change. Always verify the latest short term rental regulations and Airbnb license requirements directly with local government authorities for Bardstown to ensure full compliance before hosting.
(Source: AirROI data, 2026, finding no licensed listings among those analyzed)
Top Performing Airbnb Properties in Bardstown (2026)
Benchmark your potential! Explore examples of top-performing Airbnb properties in Bardstownbased on Trailing Twelve Month (TTM) revenue. Analyze their characteristics, revenue, occupancy rate, and ADR to understand what drives success in this market.

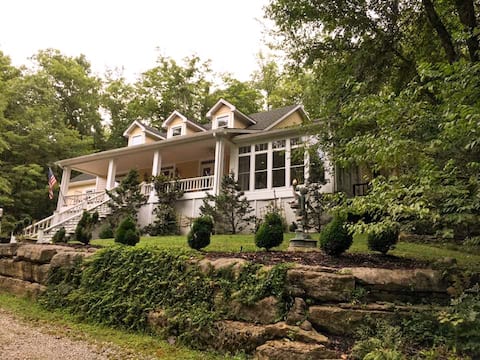
Bourbon Retreat • Hot Tub + Game
Entire Place • 5 bedrooms

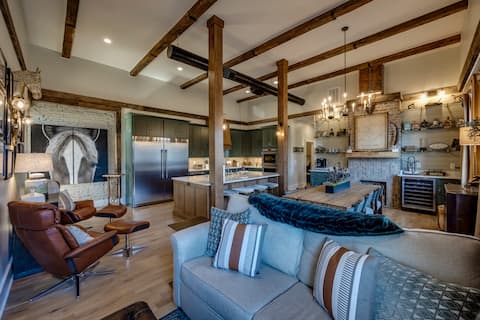
Pickleball*Hot tub*Speakeasy*Bourbon*Pet-Friendly
Entire Place • 4 bedrooms
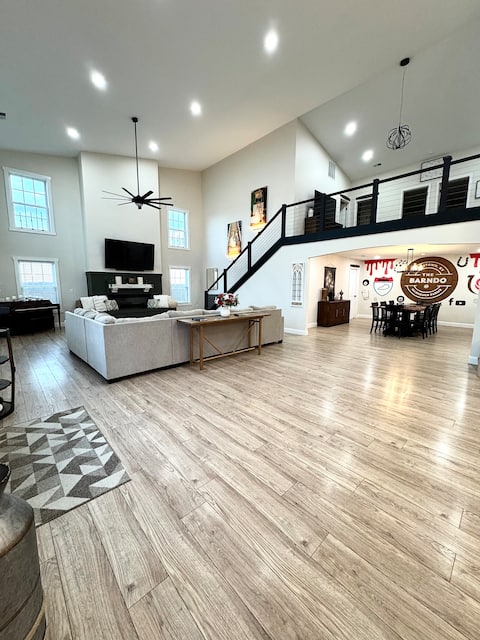
The Barndo at MF Hot tub* Bar* Game Area* 360 View
Entire Place • 5 bedrooms
Bourbon Estate™ at Meadow Creek
Entire Place • 6 bedrooms
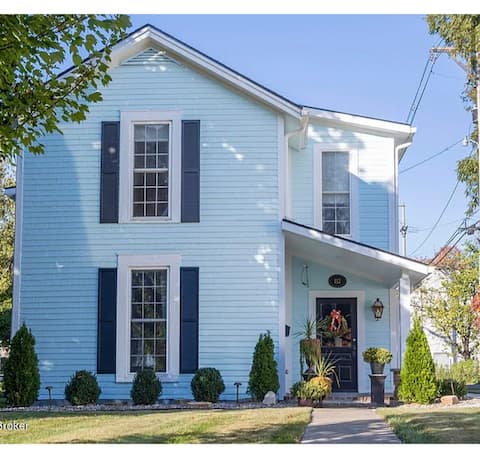
3 KingBds-Msg about Jan/Feb deals- Downtown Home!
Entire Place • 3 bedrooms
The Full Proof Penthouse (Bourbon Trail)
Entire Place • 3 bedrooms
Note: Performance varies based on location, size, amenities, seasonality, and management quality. Data reflects the past 12 months.
Top Performing Airbnb Hosts in Bardstown (2026)
Learn from the best! This table showcases top-performing Airbnb hosts in Bardstown based on the number of properties managed and estimated total revenue over the past year. Analyze their scale and performance metrics.
| Host Name | Properties | Grossing Revenue | Stay Reviews | Avg Rating |
|---|---|---|---|---|
| Bailey And Jules Mashburn | 4 | $192,487 | 172 | 4.88/5.0 |
| Margaret Sue | 6 | $168,098 | 813 | 4.92/5.0 |
| Laura | 3 | $160,402 | 215 | 4.93/5.0 |
| Kimberly | 2 | $145,521 | 185 | 4.95/5.0 |
| Melissa | 2 | $145,181 | 147 | 4.99/5.0 |
| Melissa | 1 | $131,703 | 22 | 4.91/5.0 |
| Toni | 1 | $110,580 | 128 | 4.95/5.0 |
| Eli | 3 | $100,148 | 868 | 4.81/5.0 |
| Alexis | 2 | $97,176 | 78 | 4.87/5.0 |
| Deborah | 1 | $91,897 | 49 | 4.98/5.0 |
Analyzing the strategies of top hosts, such as their property selection, pricing, and guest communication, can offer valuable lessons for optimizing your own Airbnb operations in Bardstown.
Dive Deeper: Advanced Bardstown STR Market Data (2026)
Ready to unlock more insights? AirROI provides access to advanced metrics and comprehensive Airbnb data for Bardstown. Explore detailed analytics beyond this report to refine your investment strategy, optimize pricing, and maximize your vacation rental profits.
Explore Advanced MetricsBardstown Short-Term Rental Market Composition (2026): Property & Room Types
Room Type Distribution
Property Type Distribution
Market Composition Insights for Bardstown
- The Bardstown Airbnb market composition is heavily skewed towards Entire Home/Apt listings, which make up 94.3% of the 122 active rentals. This indicates strong guest preference for privacy and space.
- Looking at the property type distribution in Bardstown, House properties are the most common (63.9%), reflecting the local real estate landscape.
- Houses represent a significant 63.9% portion, catering likely to families or larger groups.
- The presence of 5.7% Hotel/Boutique listings indicates integration with traditional hospitality.
- Smaller segments like others, outdoor/unique (combined 5.8%) offer potential for unique stay experiences.
Bardstown Airbnb Room Capacity Analysis (2026): Bedroom Distribution
Distribution of Listings by Number of Bedrooms
Room Capacity Insights for Bardstown
- The dominant room capacity in Bardstown is 3 bedrooms listings, making up 35.2% of the market. This suggests a strong demand for properties suitable for families or small groups.
- Together, 3 bedrooms and 2 bedrooms properties represent 63.1% of the active Airbnb listings in Bardstown, indicating a high concentration in these sizes.
- A significant 49.1% of listings offer 3+ bedrooms, catering to larger groups and families seeking more space in Bardstown.
Bardstown Vacation Rental Guest Capacity Trends (2026)
Distribution of Listings by Guest Capacity
Guest Capacity Insights for Bardstown
- The most common guest capacity trend in Bardstown vacation rentals is listings accommodating 6 guests (36.1%). This suggests the primary traveler segment is likely larger groups.
- Properties designed for 6 guests and 4 guests dominate the Bardstown STR market, accounting for 59.1% of listings.
- 53.3% of properties accommodate 6+ guests, serving the market segment for larger families or group travel in Bardstown.
- On average, properties in Bardstown are equipped to host 5.0 guests.
Bardstown Airbnb Booking Patterns (2026): Available vs. Booked Days
Available Days Distribution
Booked Days Distribution
Booking Pattern Insights for Bardstown
- The most common availability pattern in Bardstown falls within the 181-270 days range, representing 41% of listings. This suggests many properties have significant open periods on their calendars.
- Approximately 71.3% of listings show high availability (181+ days open annually), indicating potential for increased bookings or specific owner usage patterns.
- For booked days, the 91-180 days range is most frequent in Bardstown (41.8%), reflecting common guest stay durations or potential owner blocking patterns.
- A notable 30.3% of properties secure long booking periods (181+ days booked per year), highlighting successful long-term rental strategies or significant owner usage.
Bardstown Airbnb Minimum Stay Requirements Analysis
Distribution of Listings by Minimum Night Requirement
1 Night
47 listings
38.5% of total
2 Nights
34 listings
27.9% of total
3 Nights
1 listings
0.8% of total
4-6 Nights
1 listings
0.8% of total
30+ Nights
39 listings
32% of total
Key Insights
- The most prevalent minimum stay requirement in Bardstown is 1 Night, adopted by 38.5% of listings. This highlights the market's preference for shorter, flexible bookings.
- A strong majority (66.4%) of the Bardstown Airbnb data shows acceptance of very short stays (1-2 nights), indicating a dynamic, high-turnover market.
- A significant segment (32%) caters to monthly stays (30+ nights) in Bardstown, pointing to opportunities in the extended-stay market.
Recommendations
- Align with the market by considering a 1 Night minimum stay, as 38.5% of Bardstown hosts use this setting.
- Explore offering discounts for stays of 30+ nights to attract the 32% of the market seeking extended stays.
- Adjust minimum nights based on seasonality – potentially shorter during low season and longer during peak demand periods in Bardstown.
Bardstown Airbnb Cancellation Policy Trends Analysis (2026)
Limited
1 listings
0.8% of total
Flexible
22 listings
18% of total
Moderate
49 listings
40.2% of total
Firm
40 listings
32.8% of total
Strict
10 listings
8.2% of total
Cancellation Policy Insights for Bardstown
- The prevailing Airbnb cancellation policy trend in Bardstown is Moderate, used by 40.2% of listings.
- There's a relatively balanced mix between guest-friendly (58.2%) and stricter (41.0%) policies, offering choices for different guest needs.
- Strict cancellation policies are quite rare (8.2%), potentially making listings with this policy less competitive unless justified by high demand or property type.
Recommendations for Hosts
- Consider adopting a Moderate policy to align with the 40.2% market standard in Bardstown.
- Using a Strict policy might deter some guests, as only 8.2% of listings use it. Evaluate if potential revenue protection outweighs possible lower booking rates.
- Regularly review your cancellation policy against competitors and market demand shifts in Bardstown.
Bardstown STR Booking Lead Time Analysis (2026)
Average Booking Lead Time by Month
Booking Lead Time Insights for Bardstown
- The overall average booking lead time for vacation rentals in Bardstown is 62 days.
- Guests book furthest in advance for stays during September (average 111 days), likely coinciding with peak travel demand or local events.
- The shortest booking windows occur for stays in January (average 35 days), indicating more last-minute travel plans during this time.
- Seasonally, Fall (84 days avg.) sees the longest lead times, while Winter (41 days avg.) has the shortest, reflecting typical travel planning cycles.
Recommendations for Hosts
- Use the overall average lead time (62 days) as a baseline for your pricing and availability strategy in Bardstown.
- For September stays, consider implementing length-of-stay discounts or slightly higher rates for bookings made less than 111 days out to capitalize on advance planning.
- Target marketing efforts for the Fall season well in advance (at least 84 days) to capture early planners.
- Monitor your own booking lead times against these Bardstown averages to identify opportunities for dynamic pricing adjustments.
Popular & Essential Airbnb Amenities in Bardstown (2026)
Amenity Prevalence
Amenity Insights for Bardstown
- Essential amenities in Bardstown that guests expect include: Smoke alarm, TV, Air conditioning, Heating, Wifi, Hot water. Lacking these (any) could significantly impact bookings.
- Popular amenities like Microwave, Coffee maker, Hair dryer are common but not universal. Offering these can provide a competitive edge.
Recommendations for Hosts
- Ensure your listing includes all essential amenities for Bardstown: Smoke alarm, TV, Air conditioning, Heating, Wifi, Hot water.
- Prioritize adding missing essentials: Air conditioning, Heating, Wifi, Hot water.
- Consider adding popular differentiators like Microwave or Coffee maker to increase appeal.
- Highlight unique or less common amenities you offer (e.g., hot tub, dedicated workspace, EV charger) in your listing description and photos.
- Regularly check competitor amenities in Bardstown to stay competitive.
Bardstown Airbnb Guest Demographics & Profile Analysis (2026)
Guest Profile Summary for Bardstown
- The typical guest profile for Airbnb in Bardstown consists of primarily domestic travelers (99%), often arriving from nearby Cincinnati, typically belonging to the Post-2000s (Gen Z/Alpha) group (50%), primarily speaking English or Spanish.
- Domestic travelers account for 98.7% of guests.
- Key international markets include United States (98.7%) and United Kingdom (0.4%).
- Top languages spoken are English (88%) followed by Spanish (4.7%).
- A significant demographic segment is the Post-2000s (Gen Z/Alpha) group, representing 50% of guests.
Recommendations for Hosts
- Target domestic marketing efforts towards travelers from Cincinnati and Nashville.
- Tailor amenities and listing descriptions to appeal to the dominant Post-2000s (Gen Z/Alpha) demographic (e.g., highlight fast WiFi, smart home features, local guides).
- Highlight unique local experiences or amenities relevant to the primary guest profile.
- Consider seasonal promotions aligned with peak travel times for key origin markets.
Nearby Short-Term Rental Market Comparison
How does the Bardstown Airbnb market stack up against its neighbors? Compare key performance metrics like average monthly revenue, ADR, and occupancy rates in surrounding areas to understand the broader regional STR landscape.
| Market | Active Properties | Monthly Revenue | Daily Rate | Avg. Occupancy |
|---|---|---|---|---|
| Lawrenceburg | 65 | $4,477 | $360.32 | 45% |
| Berry Hill | 136 | $4,232 | $323.78 | 44% |
| Crittenden | 18 | $3,944 | $261.97 | 48% |
| Coxs Creek | 12 | $3,872 | $415.38 | 40% |
| Walton | 22 | $3,840 | $225.35 | 58% |
| Bee Spring | 12 | $3,834 | $471.34 | 41% |
| Nashville-Davidson | 6,085 | $3,810 | $321.42 | 45% |
| Williamstown | 204 | $3,674 | $263.96 | 49% |
| Bloomfield | 11 | $3,611 | $420.13 | 34% |
| Mt. Juliet | 54 | $3,588 | $312.34 | 44% |