Wichita Airbnb Market Analysis 2026: Short Term Rental Data & Vacation Rental Statistics in Kansas, United States
Is Airbnb profitable in Wichita in 2026? Explore comprehensive Airbnb analytics for Wichita, Kansas, United States to uncover income potential. This 2026 STR market report for Wichita, based on AirROI data from February 2025 to January 2026, reveals key trends in the market of 564 active listings.
Whether you're considering an Airbnb investment in Wichita, optimizing your existing vacation rental, or exploring rental arbitrage opportunities, understanding the Wichita Airbnb data is crucial. Leveraging the low regulation environment is key to maximizing your short term rental income potential. Let's dive into the specifics.
Key Wichita Airbnb Performance Metrics Overview
Monthly Airbnb Revenue Variations & Income Potential in Wichita (2026)
Understanding the monthly revenue variations for Airbnb listings in Wichita is key to maximizing your short term rental income potential. Seasonality significantly impacts earnings. Our analysis, based on data from the past 12 months, shows that the peak revenue month for STRs in Wichita is typically June, while February often presents the lowest earnings, highlighting opportunities for strategic pricing adjustments during shoulder and low seasons. Explore the typical Airbnb income in Wichita across different performance tiers:
- Best-in-class properties (Top 10%) achieve $4,479+ monthly, often utilizing dynamic pricing and superior guest experiences.
- Strong performing properties (Top 25%) earn $3,010 or more, indicating effective management and desirable locations/amenities.
- Typical properties (Median) generate around $1,814 per month, representing the average market performance.
- Entry-level properties (Bottom 25%) see earnings around $936, often with potential for optimization.
Average Monthly Airbnb Earnings Trend in Wichita
Wichita Airbnb Occupancy Rate Trends (2026)
Maximize your bookings by understanding the Wichita STR occupancy trends. Seasonal demand shifts significantly influence how often properties are booked. Typically, Junesees the highest demand (peak season occupancy), while January experiences the lowest (low season). Effective strategies, like adjusting minimum stays or offering promotions, can boost occupancy during slower periods. Here's how different property tiers perform in Wichita:
- Best-in-class properties (Top 10%) achieve 84%+ occupancy, indicating high desirability and potentially optimized availability.
- Strong performing properties (Top 25%) maintain 68% or higher occupancy, suggesting good market fit and guest satisfaction.
- Typical properties (Median) have an occupancy rate around 48%.
- Entry-level properties (Bottom 25%) average 27% occupancy, potentially facing higher vacancy.
Average Monthly Occupancy Rate Trend in Wichita
Average Daily Rate (ADR) Airbnb Trends in Wichita (2026)
Effective short term rental pricing strategy in Wichita involves understanding monthly ADR fluctuations. The Average Daily Rate (ADR) for Airbnb in Wichita typically peaks in October and dips lowest during February. Leveraging Airbnb dynamic pricing tools or strategies based on this seasonality can significantly boost revenue. Here's a look at the typical nightly rates achieved:
- Best-in-class properties (Top 10%) command rates of $232+ per night, often due to premium features or locations.
- Strong performing properties (Top 25%) achieve nightly rates of $165 or more.
- Typical properties (Median) charge around $111 per night.
- Entry-level properties (Bottom 25%) earn around $75 per night.
Average Daily Rate (ADR) Trend by Month in Wichita
Get Live Wichita Market Intelligence 👇

Explore Real-time Analytics
Airbnb Seasonality Analysis & Trends in Wichita (2026)
Peak Season (June, October, July)
- Revenue averages $2,704 per month
- Occupancy rates average 53.3%
- Daily rates average $141
Shoulder Season
- Revenue averages $2,267 per month
- Occupancy maintains around 48.4%
- Daily rates hold near $134
Low Season (January, February, April)
- Revenue drops to average $1,653 per month
- Occupancy decreases to average 42.5%
- Daily rates adjust to average $124
Seasonality Insights for Wichita
- The Airbnb seasonality in Wichita shows moderate seasonality with distinct peak and low periods. While the sections above show seasonal averages, it's also insightful to look at the extremes:
- During the high season, the absolute peak month showcases Wichita's highest earning potential, with monthly revenues capable of climbing to $2,755, occupancy reaching a high of 54.5%, and ADRs peaking at $144.
- Conversely, the slowest single month of the year, typically falling within the low season, marks the market's lowest point. In this month, revenue might dip to $1,515, occupancy could drop to 31.0%, and ADRs may adjust down to $116.
- Understanding both the seasonal averages and these monthly peaks and troughs in revenue, occupancy, and ADR is crucial for maximizing your Airbnb profit potential in Wichita.
Seasonal Strategies for Maximizing Profit
- Peak Season: Maximize revenue through premium pricing and potentially longer minimum stays. Ensure high availability.
- Low Season: Offer competitive pricing, special promotions (e.g., extended stay discounts), and flexible cancellation policies. Target off-season travelers like remote workers or budget-conscious guests.
- Shoulder Seasons: Implement dynamic pricing that balances peak and low rates. Target weekend travelers or specific events. Offer slightly more flexible terms than peak season.
- Regularly analyze your own performance against these Wichita seasonality benchmarks and adjust your pricing and availability strategy accordingly.
Best Areas for Airbnb Investment in Wichita (2026)
Exploring the top neighborhoods for short-term rentals in Wichita? This section highlights key areas, outlining why they are attractive for hosts and guests, along with notable local attractions. Consider these locations based on your target guest profile and investment strategy.
| Neighborhood / Area | Why Host Here? (Target Guests & Appeal) | Key Attractions & Landmarks |
|---|---|---|
| Historic Delano District | Charming historic neighborhood known for its rich history and proximity to downtown. Ideal for guests looking for a cozy, local experience with access to unique shops and restaurants. | Museum of World Treasures, Delano Park, Art Deco buildings, Botanica, The Wichita Gardens, Riverwalk, Local eateries |
| College Hill | A vibrant neighborhood filled with young professionals and families. Close to universities, parks, and local businesses, making it a popular choice for both short-term visitors and long-term stays. | College Hill Park, Wichita Art Museum, Petersen Park, Local cafes and markets, The Crown Uptown Theatre |
| Waterfront | A scenic area with luxury apartments and a variety of lakefront activities. It's attractive to visitors seeking recreational opportunities and fine dining along the water. | The Waterfront, Wichita Jewelers, Pawnee Prairie Park, Local dining options, Close to nature trails |
| Old Town | The bustling heart of Wichita's nightlife, filled with restaurants, bars, and entertainment options. A prime location for young travelers looking for a fun and lively atmosphere. | Old Town Farmers Market, Wichita Grand Opera, Nightlife spots, Small craft breweries, Cultural events |
| North Riverside | Offering a suburban feel with easy access to downtown Wichita, North Riverside is popular for families and professionals who appreciate the mix of quiet neighborhoods and city amenities. | North Riverside Park, River Vista Golf Course, Wichita Riverfront, Local shopping areas, Arts and culture venues |
| Eastborough | An affluent area known for its upscale homes and beautiful streets. It appeals to high-end travelers looking for a luxurious stay in a serene neighborhood close to the city. | Eastborough Park, Private country clubs, Luxury shopping, Art galleries and studios, Local dining |
| Midtown | Diverse and convenient, Midtown offers a mix of residential and commercial spaces, making it attractive for a wide range of visitors, from business to leisure. | Wichita State University, Local parks, Shopping options, Art and cultural venues, Food festivals |
| Southwest Wichita | A growing area with more affordable housing and a family-oriented community. It attracts visitors looking for quieter stays while still being close to attractions. | Sedgwick County Zoo, Botanica Wichita, Local shopping centers, Parks and recreational areas, Community events |
Understanding Airbnb License Requirements & STR Laws in Wichita (2026)
While Wichita, Kansas, United States currently shows low STR regulations, specific Airbnb license requirements might still exist or change. Always verify the latest short term rental regulations and Airbnb license requirements directly with local government authorities for Wichita to ensure full compliance before hosting.
(Source: AirROI data, 2026, based on 1% licensed listings)
Top Performing Airbnb Properties in Wichita (2026)
Benchmark your potential! Explore examples of top-performing Airbnb properties in Wichitabased on Trailing Twelve Month (TTM) revenue. Analyze their characteristics, revenue, occupancy rate, and ADR to understand what drives success in this market.

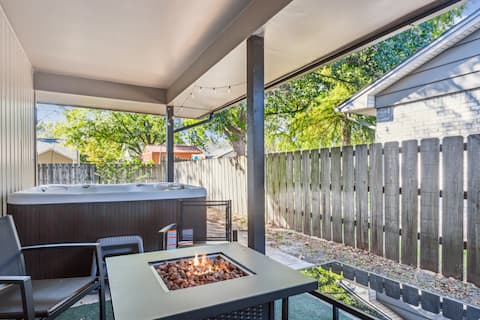
Legend of Sleepy Hollow + HotTub + L2 EV Charger
Entire Place • 4 bedrooms

Magnolia House
Entire Place • 5 bedrooms

Private Micro Resort-POOL & Spa-Fire Pit-Game Room
Entire Place • 5 bedrooms

Heated Saltwater Pool & Spa · Central Wichita Gem
Entire Place • 5 bedrooms
Quiet Place in Wichita/ Hot Tub & Cinema
Entire Place • 3 bedrooms

Spacious Home with Hot Tub, Pool Table, & Fire Pit
Entire Place • 5 bedrooms
Note: Performance varies based on location, size, amenities, seasonality, and management quality. Data reflects the past 12 months.
Top Performing Airbnb Hosts in Wichita (2026)
Learn from the best! This table showcases top-performing Airbnb hosts in Wichita based on the number of properties managed and estimated total revenue over the past year. Analyze their scale and performance metrics.
| Host Name | Properties | Grossing Revenue | Stay Reviews | Avg Rating |
|---|---|---|---|---|
| Emily | 47 | $1,050,276 | 3198 | 4.87/5.0 |
| Alexandra | 25 | $738,762 | 2237 | 4.93/5.0 |
| Jeremiah | 16 | $385,604 | 1238 | 4.80/5.0 |
| Francis | 12 | $370,055 | 718 | 4.73/5.0 |
| Jessica | 26 | $367,110 | 2134 | 4.71/5.0 |
| Jennifer | 6 | $343,266 | 809 | 4.92/5.0 |
| Lauren | 4 | $260,964 | 200 | 4.91/5.0 |
| Emily | 25 | $229,506 | 121 | 4.92/5.0 |
| Victoria | 4 | $223,205 | 240 | 4.89/5.0 |
| Jennifer | 5 | $210,430 | 294 | 4.81/5.0 |
Analyzing the strategies of top hosts, such as their property selection, pricing, and guest communication, can offer valuable lessons for optimizing your own Airbnb operations in Wichita.
Dive Deeper: Advanced Wichita STR Market Data (2026)
Ready to unlock more insights? AirROI provides access to advanced metrics and comprehensive Airbnb data for Wichita. Explore detailed analytics beyond this report to refine your investment strategy, optimize pricing, and maximize your vacation rental profits.
Explore Advanced MetricsWichita Short-Term Rental Market Composition (2026): Property & Room Types
Room Type Distribution
Property Type Distribution
Market Composition Insights for Wichita
- The Wichita Airbnb market composition is heavily skewed towards Entire Home/Apt listings, which make up 89.2% of the 564 active rentals. This indicates strong guest preference for privacy and space.
- Looking at the property type distribution in Wichita, House properties are the most common (79.4%), reflecting the local real estate landscape.
- Houses represent a significant 79.4% portion, catering likely to families or larger groups.
- Smaller segments like others, hotel/boutique (combined 2.4%) offer potential for unique stay experiences.
Wichita Airbnb Room Capacity Analysis (2026): Bedroom Distribution
Distribution of Listings by Number of Bedrooms
Room Capacity Insights for Wichita
- The dominant room capacity in Wichita is 3 bedrooms listings, making up 26.8% of the market. This suggests a strong demand for properties suitable for families or small groups.
- Together, 3 bedrooms and 1 bedroom properties represent 53.0% of the active Airbnb listings in Wichita, indicating a high concentration in these sizes.
- A significant 39.7% of listings offer 3+ bedrooms, catering to larger groups and families seeking more space in Wichita.
Wichita Vacation Rental Guest Capacity Trends (2026)
Distribution of Listings by Guest Capacity
Guest Capacity Insights for Wichita
- The most common guest capacity trend in Wichita vacation rentals is listings accommodating 8+ guests (21.6%). This suggests the primary traveler segment is likely larger groups.
- Properties designed for 8+ guests and 4 guests dominate the Wichita STR market, accounting for 41.3% of listings.
- 42.3% of properties accommodate 6+ guests, serving the market segment for larger families or group travel in Wichita.
- On average, properties in Wichita are equipped to host 4.5 guests.
Wichita Airbnb Booking Patterns (2026): Available vs. Booked Days
Available Days Distribution
Booked Days Distribution
Booking Pattern Insights for Wichita
- The most common availability pattern in Wichita falls within the 271-366 days range, representing 35.6% of listings. This suggests many properties have significant open periods on their calendars.
- Approximately 71.1% of listings show high availability (181+ days open annually), indicating potential for increased bookings or specific owner usage patterns.
- For booked days, the 91-180 days range is most frequent in Wichita (35.6%), reflecting common guest stay durations or potential owner blocking patterns.
- A notable 30.3% of properties secure long booking periods (181+ days booked per year), highlighting successful long-term rental strategies or significant owner usage.
Wichita Airbnb Minimum Stay Requirements Analysis
Distribution of Listings by Minimum Night Requirement
1 Night
205 listings
36.3% of total
2 Nights
122 listings
21.6% of total
3 Nights
13 listings
2.3% of total
4-6 Nights
23 listings
4.1% of total
7-29 Nights
73 listings
12.9% of total
30+ Nights
128 listings
22.7% of total
Key Insights
- The most prevalent minimum stay requirement in Wichita is 1 Night, adopted by 36.3% of listings. This highlights the market's preference for shorter, flexible bookings.
- A significant segment (22.7%) caters to monthly stays (30+ nights) in Wichita, pointing to opportunities in the extended-stay market.
Recommendations
- Align with the market by considering a 1 Night minimum stay, as 36.3% of Wichita hosts use this setting.
- Explore offering discounts for stays of 30+ nights to attract the 22.7% of the market seeking extended stays.
- Adjust minimum nights based on seasonality – potentially shorter during low season and longer during peak demand periods in Wichita.
Wichita Airbnb Cancellation Policy Trends Analysis (2026)
Super Strict 60 Days
3 listings
0.5% of total
Flexible
146 listings
26.1% of total
Moderate
127 listings
22.7% of total
Firm
220 listings
39.3% of total
Strict
64 listings
11.4% of total
Cancellation Policy Insights for Wichita
- The prevailing Airbnb cancellation policy trend in Wichita is Firm, used by 39.3% of listings.
- A majority (50.7%) of hosts in Wichita utilize Firm or Strict policies, indicating a market where hosts prioritize booking security.
Recommendations for Hosts
- Consider adopting a Firm policy to align with the 39.3% market standard in Wichita.
- Using a Strict policy might deter some guests, as only 11.4% of listings use it. Evaluate if potential revenue protection outweighs possible lower booking rates.
- Regularly review your cancellation policy against competitors and market demand shifts in Wichita.
Wichita STR Booking Lead Time Analysis (2026)
Average Booking Lead Time by Month
Booking Lead Time Insights for Wichita
- The overall average booking lead time for vacation rentals in Wichita is 24 days.
- Guests book furthest in advance for stays during June (average 32 days), likely coinciding with peak travel demand or local events.
- The shortest booking windows occur for stays in January (average 14 days), indicating more last-minute travel plans during this time.
- Seasonally, Summer (28 days avg.) sees the longest lead times, while Winter (18 days avg.) has the shortest, reflecting typical travel planning cycles.
Recommendations for Hosts
- Use the overall average lead time (24 days) as a baseline for your pricing and availability strategy in Wichita.
- During January, focus on last-minute booking availability and promotions, as guests book with very short notice (14 days avg.).
- Target marketing efforts for the Summer season well in advance (at least 28 days) to capture early planners.
- Monitor your own booking lead times against these Wichita averages to identify opportunities for dynamic pricing adjustments.
Popular & Essential Airbnb Amenities in Wichita (2026)
Amenity Prevalence
Amenity Insights for Wichita
- Essential amenities in Wichita that guests expect include: Air conditioning, Wifi, TV, Smoke alarm, Kitchen, Heating, Free parking on premises. Lacking these (any) could significantly impact bookings.
- Popular amenities like Hot water, Refrigerator, Dishes and silverware are common but not universal. Offering these can provide a competitive edge.
Recommendations for Hosts
- Ensure your listing includes all essential amenities for Wichita: Air conditioning, Wifi, TV, Smoke alarm, Kitchen, Heating, Free parking on premises.
- Prioritize adding missing essentials: Wifi, TV, Smoke alarm, Kitchen, Heating, Free parking on premises.
- Consider adding popular differentiators like Hot water or Refrigerator to increase appeal.
- Highlight unique or less common amenities you offer (e.g., hot tub, dedicated workspace, EV charger) in your listing description and photos.
- Regularly check competitor amenities in Wichita to stay competitive.
Wichita Airbnb Guest Demographics & Profile Analysis (2026)
Guest Profile Summary for Wichita
- The typical guest profile for Airbnb in Wichita consists of primarily domestic travelers (97%), often arriving from nearby Wichita, typically belonging to the Post-2000s (Gen Z/Alpha) group (50%), primarily speaking English or Spanish.
- Domestic travelers account for 97.3% of guests.
- Key international markets include United States (97.3%) and Canada (0.4%).
- Top languages spoken are English (77.1%) followed by Spanish (12.9%).
- A significant demographic segment is the Post-2000s (Gen Z/Alpha) group, representing 50% of guests.
Recommendations for Hosts
- Target domestic marketing efforts towards travelers from Wichita and Kansas City.
- Tailor amenities and listing descriptions to appeal to the dominant Post-2000s (Gen Z/Alpha) demographic (e.g., highlight fast WiFi, smart home features, local guides).
- Highlight unique local experiences or amenities relevant to the primary guest profile.
- Consider seasonal promotions aligned with peak travel times for key origin markets.
Nearby Short-Term Rental Market Comparison
How does the Wichita Airbnb market stack up against its neighbors? Compare key performance metrics like average monthly revenue, ADR, and occupancy rates in surrounding areas to understand the broader regional STR landscape.
| Market | Active Properties | Monthly Revenue | Daily Rate | Avg. Occupancy |
|---|---|---|---|---|
| Andover | 10 | $2,631 | $223.11 | 45% |
| Council Grove | 11 | $2,504 | $237.29 | 39% |
| Skiatook | 11 | $2,296 | $220.68 | 38% |
| Lindsborg | 27 | $2,268 | $172.27 | 47% |
| Bel Aire | 11 | $2,115 | $208.83 | 41% |
| Winfield | 18 | $2,067 | $163.16 | 49% |
| Augusta | 14 | $1,828 | $131.30 | 49% |
| Salina | 63 | $1,819 | $145.06 | 47% |
| Cottonwood Falls | 18 | $1,768 | $242.43 | 27% |
| Hesston | 11 | $1,764 | $110.18 | 54% |