WaKeeney Airbnb Market Analysis 2026: Short Term Rental Data & Vacation Rental Statistics in Kansas, United States
Is Airbnb profitable in WaKeeney in 2026? Explore comprehensive Airbnb analytics for WaKeeney, Kansas, United States to uncover income potential. This 2026 STR market report for WaKeeney, based on AirROI data from February 2025 to January 2026, reveals key trends in the niche market of 21 active listings.
Whether you're considering an Airbnb investment in WaKeeney, optimizing your existing vacation rental, or exploring rental arbitrage opportunities, understanding the WaKeeney Airbnb data is crucial. Leveraging the low regulation environment is key to maximizing your short term rental income potential. Let's dive into the specifics.
Key WaKeeney Airbnb Performance Metrics Overview
Monthly Airbnb Revenue Variations & Income Potential in WaKeeney (2026)
Understanding the monthly revenue variations for Airbnb listings in WaKeeney is key to maximizing your short term rental income potential. Seasonality significantly impacts earnings. Our analysis, based on data from the past 12 months, shows that the peak revenue month for STRs in WaKeeney is typically June, while October often presents the lowest earnings, highlighting opportunities for strategic pricing adjustments during shoulder and low seasons. Explore the typical Airbnb income in WaKeeney across different performance tiers:
- Best-in-class properties (Top 10%) achieve $2,440+ monthly, often utilizing dynamic pricing and superior guest experiences.
- Strong performing properties (Top 25%) earn $1,264 or more, indicating effective management and desirable locations/amenities.
- Typical properties (Median) generate around $803 per month, representing the average market performance.
- Entry-level properties (Bottom 25%) see earnings around $540, often with potential for optimization.
Average Monthly Airbnb Earnings Trend in WaKeeney
WaKeeney Airbnb Occupancy Rate Trends (2026)
Maximize your bookings by understanding the WaKeeney STR occupancy trends. Seasonal demand shifts significantly influence how often properties are booked. Typically, Junesees the highest demand (peak season occupancy), while October experiences the lowest (low season). Effective strategies, like adjusting minimum stays or offering promotions, can boost occupancy during slower periods. Here's how different property tiers perform in WaKeeney:
- Best-in-class properties (Top 10%) achieve 53%+ occupancy, indicating high desirability and potentially optimized availability.
- Strong performing properties (Top 25%) maintain 32% or higher occupancy, suggesting good market fit and guest satisfaction.
- Typical properties (Median) have an occupancy rate around 21%.
- Entry-level properties (Bottom 25%) average 14% occupancy, potentially facing higher vacancy.
Average Monthly Occupancy Rate Trend in WaKeeney
Average Daily Rate (ADR) Airbnb Trends in WaKeeney (2026)
Effective short term rental pricing strategy in WaKeeney involves understanding monthly ADR fluctuations. The Average Daily Rate (ADR) for Airbnb in WaKeeney typically peaks in November and dips lowest during March. Leveraging Airbnb dynamic pricing tools or strategies based on this seasonality can significantly boost revenue. Here's a look at the typical nightly rates achieved:
- Best-in-class properties (Top 10%) command rates of $158+ per night, often due to premium features or locations.
- Strong performing properties (Top 25%) achieve nightly rates of $142 or more.
- Typical properties (Median) charge around $128 per night.
- Entry-level properties (Bottom 25%) earn around $121 per night.
Average Daily Rate (ADR) Trend by Month in WaKeeney
Get Live WaKeeney Market Intelligence 👇

Explore Real-time Analytics
Airbnb Seasonality Analysis & Trends in WaKeeney (2026)
Peak Season (June, May, December)
- Revenue averages $1,425 per month
- Occupancy rates average 32.5%
- Daily rates average $134
Shoulder Season
- Revenue averages $1,246 per month
- Occupancy maintains around 27.6%
- Daily rates hold near $135
Low Season (February, April, October)
- Revenue drops to average $767 per month
- Occupancy decreases to average 19.1%
- Daily rates adjust to average $131
Seasonality Insights for WaKeeney
- The Airbnb seasonality in WaKeeney shows moderate seasonality with distinct peak and low periods. While the sections above show seasonal averages, it's also insightful to look at the extremes:
- During the high season, the absolute peak month showcases WaKeeney's highest earning potential, with monthly revenues capable of climbing to $1,449, occupancy reaching a high of 35.5%, and ADRs peaking at $142.
- Conversely, the slowest single month of the year, typically falling within the low season, marks the market's lowest point. In this month, revenue might dip to $702, occupancy could drop to 15.3%, and ADRs may adjust down to $125.
- Understanding both the seasonal averages and these monthly peaks and troughs in revenue, occupancy, and ADR is crucial for maximizing your Airbnb profit potential in WaKeeney.
Seasonal Strategies for Maximizing Profit
- Peak Season: Maximize revenue through premium pricing and potentially longer minimum stays. Ensure high availability.
- Low Season: Offer competitive pricing, special promotions (e.g., extended stay discounts), and flexible cancellation policies. Target off-season travelers like remote workers or budget-conscious guests.
- Shoulder Seasons: Implement dynamic pricing that balances peak and low rates. Target weekend travelers or specific events. Offer slightly more flexible terms than peak season.
- Regularly analyze your own performance against these WaKeeney seasonality benchmarks and adjust your pricing and availability strategy accordingly.
Best Areas for Airbnb Investment in WaKeeney (2026)
Exploring the top neighborhoods for short-term rentals in WaKeeney? This section highlights key areas, outlining why they are attractive for hosts and guests, along with notable local attractions. Consider these locations based on your target guest profile and investment strategy.
| Neighborhood / Area | Why Host Here? (Target Guests & Appeal) | Key Attractions & Landmarks |
|---|---|---|
| Downtown WaKeeney | The heart of WaKeeney, where visitors can find local shops, cafes, and cultural attractions. It's ideal for guests looking to explore the local community and history. | Trego County Historical Society Museum, Old West Trails, WaKeeney City Park |
| Lake Wilson | A popular recreational area for fishing, boating, and outdoor activities. This location attracts families and nature enthusiasts looking for a getaway. | Lake Wilson State Park, fishing spots, picnic areas, hiking trails |
| The Historic Main Street | Known for its charming architecture and local businesses. This area offers a glimpse into small-town Kansas life and is perfect for history buffs. | Historic buildings, local boutiques, restaurants, art galleries |
| WaKeeney Golf Course | Great for golf enthusiasts, with a well-maintained course that appeals to both casual players and serious golfers. Attracts visitors looking for a recreational stay. | WaKeeney Golf Course, golfing events, stunning views |
| Trego County Fairgrounds | Hosts various events throughout the year, including the county fair. It's an area that attracts visitors for events and activities. | County fair events, local exhibitions, community gatherings |
| Boot Hill Cemetery | A historical site that showcases the rich history of the region. Attracts tourists interested in the Old West and local history. | Boot Hill Cemetery, historic artifacts, guided tours |
| Pioneer Park | Offers beautiful landscapes and outdoor activities for families. This park is great for visitors who enjoy spending time outdoors. | playgrounds, walking trails, picnic areas |
| Local diners and eateries | WaKeeney has a selection of local diners that offer authentic Kansas cuisine. Perfect for food lovers and those wanting a taste of local culture. | Milton's Restaurant, The Tasting Room, local food events |
Understanding Airbnb License Requirements & STR Laws in WaKeeney (2026)
While WaKeeney, Kansas, United States currently shows low STR regulations, specific Airbnb license requirements might still exist or change. Always verify the latest short term rental regulations and Airbnb license requirements directly with local government authorities for WaKeeney to ensure full compliance before hosting.
(Source: AirROI data, 2026, finding no licensed listings among those analyzed)
Top Performing Airbnb Properties in WaKeeney (2026)
Benchmark your potential! Explore examples of top-performing Airbnb properties in WaKeeneybased on Trailing Twelve Month (TTM) revenue. Analyze their characteristics, revenue, occupancy rate, and ADR to understand what drives success in this market.
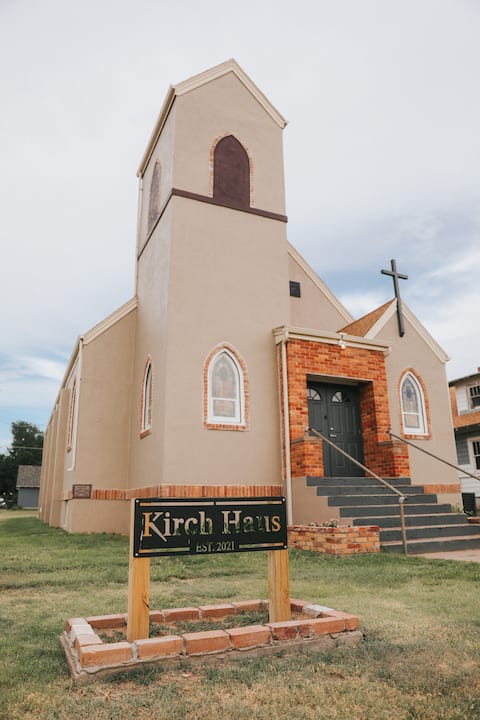
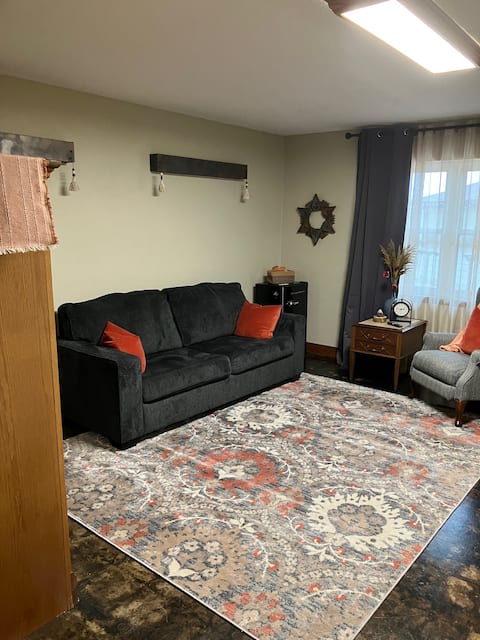
Church, in Christmas City of the High Plains
Entire Place • 5 bedrooms

High Plains Hideout 3 bedrooms 2 Baths
Entire Place • 3 bedrooms

Our Cozy Farm House
Entire Place • 5 bedrooms

1906 Cottage Garden
Entire Place • 2 bedrooms

Cheerful Updated modern 2-bedroom bungalow
Entire Place • 2 bedrooms
Prairie Rose Inn Rm#7 *Buckeye*
Private Room • N/A
Note: Performance varies based on location, size, amenities, seasonality, and management quality. Data reflects the past 12 months.
Top Performing Airbnb Hosts in WaKeeney (2026)
Learn from the best! This table showcases top-performing Airbnb hosts in WaKeeney based on the number of properties managed and estimated total revenue over the past year. Analyze their scale and performance metrics.
| Host Name | Properties | Grossing Revenue | Stay Reviews | Avg Rating |
|---|---|---|---|---|
| Prairie Rose | 16 | $114,742 | 63 | 4.94/5.0 |
| Tami | 1 | $42,057 | 90 | 5.00/5.0 |
| Nathan | 1 | $33,779 | 71 | 4.97/5.0 |
| Catherine | 1 | $25,998 | 141 | 4.96/5.0 |
| Tasha | 1 | $21,128 | 227 | 4.97/5.0 |
| Chad | 1 | $15,624 | 45 | 4.84/5.0 |
Analyzing the strategies of top hosts, such as their property selection, pricing, and guest communication, can offer valuable lessons for optimizing your own Airbnb operations in WaKeeney.
Dive Deeper: Advanced WaKeeney STR Market Data (2026)
Ready to unlock more insights? AirROI provides access to advanced metrics and comprehensive Airbnb data for WaKeeney. Explore detailed analytics beyond this report to refine your investment strategy, optimize pricing, and maximize your vacation rental profits.
Explore Advanced MetricsWaKeeney Short-Term Rental Market Composition (2026): Property & Room Types
Room Type Distribution
Property Type Distribution
Market Composition Insights for WaKeeney
- The WaKeeney Airbnb market composition is heavily skewed towards Private Room listings, which make up 76.2% of the 21 active rentals. This indicates strong guest preference for privacy and space.
- Looking at the property type distribution in WaKeeney, Others properties are the most common (81%), reflecting the local real estate landscape.
- Houses represent a significant 19% portion, catering likely to families or larger groups.
WaKeeney Airbnb Room Capacity Analysis (2026): Bedroom Distribution
Distribution of Listings by Number of Bedrooms
Room Capacity Insights for WaKeeney
- The dominant room capacity in WaKeeney is 1 bedroom listings, making up 23.8% of the market. This suggests a strong demand for properties suitable for couples or solo travelers.
- Together, 1 bedroom and 5+ bedrooms properties represent 33.3% of the active Airbnb listings in WaKeeney, indicating a high concentration in these sizes.
WaKeeney Vacation Rental Guest Capacity Trends (2026)
Distribution of Listings by Guest Capacity
Guest Capacity Insights for WaKeeney
- The most common guest capacity trend in WaKeeney vacation rentals is listings accommodating 8+ guests (14.3%). This suggests the primary traveler segment is likely larger groups.
- Properties designed for 8+ guests and 2 guests dominate the WaKeeney STR market, accounting for 28.6% of listings.
- 23.8% of properties accommodate 6+ guests, serving the market segment for larger families or group travel in WaKeeney.
- On average, properties in WaKeeney are equipped to host 2.2 guests.
WaKeeney Airbnb Booking Patterns (2026): Available vs. Booked Days
Available Days Distribution
Booked Days Distribution
Booking Pattern Insights for WaKeeney
- The most common availability pattern in WaKeeney falls within the 271-366 days range, representing 76.2% of listings. This suggests many properties have significant open periods on their calendars.
- Approximately 90.5% of listings show high availability (181+ days open annually), indicating potential for increased bookings or specific owner usage patterns.
- For booked days, the 31-90 days range is most frequent in WaKeeney (66.7%), reflecting common guest stay durations or potential owner blocking patterns.
- A notable 9.5% of properties secure long booking periods (181+ days booked per year), highlighting successful long-term rental strategies or significant owner usage.
WaKeeney Airbnb Minimum Stay Requirements Analysis
Distribution of Listings by Minimum Night Requirement
1 Night
18 listings
85.7% of total
2 Nights
2 listings
9.5% of total
30+ Nights
1 listings
4.8% of total
Key Insights
- The most prevalent minimum stay requirement in WaKeeney is 1 Night, adopted by 85.7% of listings. This highlights the market's preference for shorter, flexible bookings.
- A strong majority (95.2%) of the WaKeeney Airbnb data shows acceptance of very short stays (1-2 nights), indicating a dynamic, high-turnover market.
Recommendations
- Align with the market by considering a 1 Night minimum stay, as 85.7% of WaKeeney hosts use this setting.
- Adjust minimum nights based on seasonality – potentially shorter during low season and longer during peak demand periods in WaKeeney.
WaKeeney Airbnb Cancellation Policy Trends Analysis (2026)
Super Strict 30 Days
16 listings
76.2% of total
Flexible
1 listings
4.8% of total
Moderate
2 listings
9.5% of total
Firm
2 listings
9.5% of total
Cancellation Policy Insights for WaKeeney
- The prevailing Airbnb cancellation policy trend in WaKeeney is Super Strict 30 Days, used by 76.2% of listings.
- There's a relatively balanced mix between guest-friendly (14.3%) and stricter (9.5%) policies, offering choices for different guest needs.
Recommendations for Hosts
- Consider adopting a Super Strict 30 Days policy to align with the 76.2% market standard in WaKeeney.
- Regularly review your cancellation policy against competitors and market demand shifts in WaKeeney.
WaKeeney STR Booking Lead Time Analysis (2026)
Average Booking Lead Time by Month
Booking Lead Time Insights for WaKeeney
- The overall average booking lead time for vacation rentals in WaKeeney is 70 days.
- Guests book furthest in advance for stays during June (average 125 days), likely coinciding with peak travel demand or local events.
- The shortest booking windows occur for stays in February (average 11 days), indicating more last-minute travel plans during this time.
- Seasonally, Summer (104 days avg.) sees the longest lead times, while Winter (33 days avg.) has the shortest, reflecting typical travel planning cycles.
Recommendations for Hosts
- Use the overall average lead time (70 days) as a baseline for your pricing and availability strategy in WaKeeney.
- For June stays, consider implementing length-of-stay discounts or slightly higher rates for bookings made less than 125 days out to capitalize on advance planning.
- During February, focus on last-minute booking availability and promotions, as guests book with very short notice (11 days avg.).
- Target marketing efforts for the Summer season well in advance (at least 104 days) to capture early planners.
- Monitor your own booking lead times against these WaKeeney averages to identify opportunities for dynamic pricing adjustments.
Popular & Essential Airbnb Amenities in WaKeeney (2026)
Amenity Prevalence
No amenities with partial availability (less than 100%) were found to display in the chart. All essential amenities might be present in all listings. Check insights below.
Amenity Insights for WaKeeney
- Essential amenities in WaKeeney that guests expect include: TV, Hair dryer, Essentials, Air conditioning, Fire extinguisher, Heating, Wifi, Smoke alarm, Dryer, Washer. Lacking these (any) could significantly impact bookings.
Recommendations for Hosts
- Ensure your listing includes all essential amenities for WaKeeney: TV, Hair dryer, Essentials, Air conditioning, Fire extinguisher, Heating, Wifi, Smoke alarm, Dryer, Washer.
- Highlight unique or less common amenities you offer (e.g., hot tub, dedicated workspace, EV charger) in your listing description and photos.
- Regularly check competitor amenities in WaKeeney to stay competitive.
WaKeeney Airbnb Guest Demographics & Profile Analysis (2026)
Guest Profile Summary for WaKeeney
- The typical guest profile for Airbnb in WaKeeney consists of primarily domestic travelers (97%), often arriving from nearby Denver, typically belonging to the Post-2000s (Gen Z/Alpha) group (50%), primarily speaking English or Spanish.
- Domestic travelers account for 96.9% of guests.
- Key international markets include United States (96.9%) and DC (3.1%).
- Top languages spoken are English (71.4%) followed by Spanish (14.3%).
- A significant demographic segment is the Post-2000s (Gen Z/Alpha) group, representing 50% of guests.
Recommendations for Hosts
- Target domestic marketing efforts towards travelers from Denver and Kansas City.
- Tailor amenities and listing descriptions to appeal to the dominant Post-2000s (Gen Z/Alpha) demographic (e.g., highlight fast WiFi, smart home features, local guides).
- Highlight unique local experiences or amenities relevant to the primary guest profile.
- Consider seasonal promotions aligned with peak travel times for key origin markets.
Nearby Short-Term Rental Market Comparison
How does the WaKeeney Airbnb market stack up against its neighbors? Compare key performance metrics like average monthly revenue, ADR, and occupancy rates in surrounding areas to understand the broader regional STR landscape.
| Market | Active Properties | Monthly Revenue | Daily Rate | Avg. Occupancy |
|---|---|---|---|---|
| Johnson Lake | 10 | $3,261 | $277.06 | 52% |
| Grand Island | 60 | $2,233 | $178.62 | 49% |
| Kearney | 58 | $2,164 | $183.08 | 44% |
| Hastings | 26 | $2,068 | $183.67 | 45% |
| McCook | 11 | $1,787 | $147.04 | 43% |
| Republican City | 12 | $1,729 | $271.96 | 32% |
| Hays | 77 | $1,696 | $127.95 | 48% |
| Great Bend | 21 | $1,689 | $165.33 | 47% |
| Oakley | 11 | $1,514 | $136.89 | 37% |
| Scott City | 10 | $1,421 | $122.29 | 47% |