Waverly Airbnb Market Analysis 2026: Short Term Rental Data & Vacation Rental Statistics in Iowa, United States
Is Airbnb profitable in Waverly in 2026? Explore comprehensive Airbnb analytics for Waverly, Iowa, United States to uncover income potential. This 2026 STR market report for Waverly, based on AirROI data from February 2025 to January 2026, reveals key trends in the niche market of 23 active listings.
Whether you're considering an Airbnb investment in Waverly, optimizing your existing vacation rental, or exploring rental arbitrage opportunities, understanding the Waverly Airbnb data is crucial. Leveraging the low regulation environment is key to maximizing your short term rental income potential. Let's dive into the specifics.
Key Waverly Airbnb Performance Metrics Overview
Monthly Airbnb Revenue Variations & Income Potential in Waverly (2026)
Understanding the monthly revenue variations for Airbnb listings in Waverly is key to maximizing your short term rental income potential. Seasonality significantly impacts earnings. Our analysis, based on data from the past 12 months, shows that the peak revenue month for STRs in Waverly is typically June, while April often presents the lowest earnings, highlighting opportunities for strategic pricing adjustments during shoulder and low seasons. Explore the typical Airbnb income in Waverly across different performance tiers:
- Best-in-class properties (Top 10%) achieve $4,695+ monthly, often utilizing dynamic pricing and superior guest experiences.
- Strong performing properties (Top 25%) earn $3,262 or more, indicating effective management and desirable locations/amenities.
- Typical properties (Median) generate around $2,219 per month, representing the average market performance.
- Entry-level properties (Bottom 25%) see earnings around $1,350, often with potential for optimization.
Average Monthly Airbnb Earnings Trend in Waverly
Waverly Airbnb Occupancy Rate Trends (2026)
Maximize your bookings by understanding the Waverly STR occupancy trends. Seasonal demand shifts significantly influence how often properties are booked. Typically, Junesees the highest demand (peak season occupancy), while April experiences the lowest (low season). Effective strategies, like adjusting minimum stays or offering promotions, can boost occupancy during slower periods. Here's how different property tiers perform in Waverly:
- Best-in-class properties (Top 10%) achieve 77%+ occupancy, indicating high desirability and potentially optimized availability.
- Strong performing properties (Top 25%) maintain 61% or higher occupancy, suggesting good market fit and guest satisfaction.
- Typical properties (Median) have an occupancy rate around 45%.
- Entry-level properties (Bottom 25%) average 29% occupancy, potentially facing higher vacancy.
Average Monthly Occupancy Rate Trend in Waverly
Average Daily Rate (ADR) Airbnb Trends in Waverly (2026)
Effective short term rental pricing strategy in Waverly involves understanding monthly ADR fluctuations. The Average Daily Rate (ADR) for Airbnb in Waverly typically peaks in November and dips lowest during February. Leveraging Airbnb dynamic pricing tools or strategies based on this seasonality can significantly boost revenue. Here's a look at the typical nightly rates achieved:
- Best-in-class properties (Top 10%) command rates of $256+ per night, often due to premium features or locations.
- Strong performing properties (Top 25%) achieve nightly rates of $189 or more.
- Typical properties (Median) charge around $137 per night.
- Entry-level properties (Bottom 25%) earn around $115 per night.
Average Daily Rate (ADR) Trend by Month in Waverly
Get Live Waverly Market Intelligence 👇

Explore Real-time Analytics
Airbnb Seasonality Analysis & Trends in Waverly (2026)
Peak Season (June, July, August)
- Revenue averages $3,001 per month
- Occupancy rates average 55.4%
- Daily rates average $163
Shoulder Season
- Revenue averages $2,538 per month
- Occupancy maintains around 43.7%
- Daily rates hold near $166
Low Season (February, March, April)
- Revenue drops to average $1,907 per month
- Occupancy decreases to average 43.1%
- Daily rates adjust to average $150
Seasonality Insights for Waverly
- The Airbnb seasonality in Waverly shows moderate seasonality with distinct peak and low periods. While the sections above show seasonal averages, it's also insightful to look at the extremes:
- During the high season, the absolute peak month showcases Waverly's highest earning potential, with monthly revenues capable of climbing to $3,123, occupancy reaching a high of 57.6%, and ADRs peaking at $171.
- Conversely, the slowest single month of the year, typically falling within the low season, marks the market's lowest point. In this month, revenue might dip to $1,533, occupancy could drop to 33.9%, and ADRs may adjust down to $149.
- Understanding both the seasonal averages and these monthly peaks and troughs in revenue, occupancy, and ADR is crucial for maximizing your Airbnb profit potential in Waverly.
Seasonal Strategies for Maximizing Profit
- Peak Season: Maximize revenue through premium pricing and potentially longer minimum stays. Ensure high availability.
- Low Season: Offer competitive pricing, special promotions (e.g., extended stay discounts), and flexible cancellation policies. Target off-season travelers like remote workers or budget-conscious guests.
- Shoulder Seasons: Implement dynamic pricing that balances peak and low rates. Target weekend travelers or specific events. Offer slightly more flexible terms than peak season.
- Regularly analyze your own performance against these Waverly seasonality benchmarks and adjust your pricing and availability strategy accordingly.
Best Areas for Airbnb Investment in Waverly (2026)
Exploring the top neighborhoods for short-term rentals in Waverly? This section highlights key areas, outlining why they are attractive for hosts and guests, along with notable local attractions. Consider these locations based on your target guest profile and investment strategy.
| Neighborhood / Area | Why Host Here? (Target Guests & Appeal) | Key Attractions & Landmarks |
|---|---|---|
| Waverly Historic District | Charming area with well-preserved architecture and a strong sense of community. Great for travelers interested in history and local culture, with easy access to local shops and cafes. | Waverly Heritage Days, The Waverly Public Library, The Cedar Valley Trails |
| Pine Lake Park | A beautiful natural area perfect for outdoor activities and family gatherings. Popular among nature lovers who enjoy hiking, fishing, and camping. | Pine Lake, Hiking Trails, Picnic Areas, Fishing Spots |
| Waverly Golf Course | Ideal for golf enthusiasts and those seeking a leisurely getaway. Attracts visitors looking to relax and enjoy the outdoors. | 18-hole Golf Course, Driving Range, Clubhouse |
| Cedar River | Scenic area along the river suitable for kayaking and fishing. Popular for its tranquil environment and natural beauty, attracting outdoor adventurers. | Kayaking, Fishing, Cedar River Bike Trail |
| Local Breweries | Waverly has a growing craft beer scene, making it attractive to beer enthusiasts. Visitors can enjoy local breweries and tastings without traveling far. | Waverly Brew, Local Beer Tastings, Brewery Tours |
| Waverly Community Center | A hub for events, classes, and local gatherings, making it appealing for visitors looking to engage with the local community and participate in activities. | Art Classes, Fitness Programs, Community Events |
| University of Northern Iowa - Waverly Campus | Attracts students and visitors involved with the university, enhancing opportunities for short-term rentals for families visiting students. | Campus Tours, University Events, Cultural Activities |
| Cultural Arts District | A vibrant area with galleries, theaters, and cultural events. Appeals to those interested in arts and entertainment offerings of the local scene. | Waverly Arts Council, Local Art Galleries, Live Performances |
Understanding Airbnb License Requirements & STR Laws in Waverly (2026)
While Waverly, Iowa, United States currently shows low STR regulations, specific Airbnb license requirements might still exist or change. Always verify the latest short term rental regulations and Airbnb license requirements directly with local government authorities for Waverly to ensure full compliance before hosting.
(Source: AirROI data, 2026, finding no licensed listings among those analyzed)
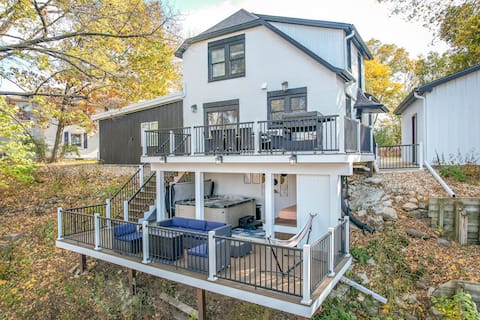
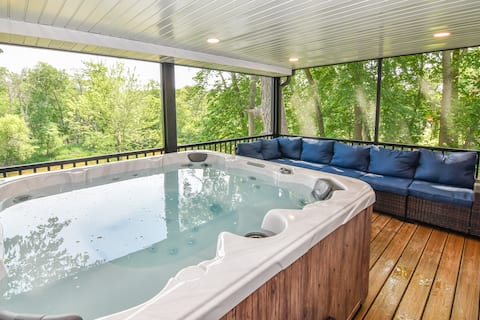
Top Performing Airbnb Properties in Waverly (2026)
Benchmark your potential! Explore examples of top-performing Airbnb properties in Waverlybased on Trailing Twelve Month (TTM) revenue. Analyze their characteristics, revenue, occupancy rate, and ADR to understand what drives success in this market.

Stunning Home! HotTub, Arcade-Special Jan Rates!
Entire Place • 3 bedrooms

Game Room + Patio: 'Bremer House Waverly Rental'
Entire Place • 4 bedrooms
Charming Home+Hot Tub+Kids Room+Walk to Downtown
Entire Place • 3 bedrooms

Ultimate Waterfront Retreat w/Private Beach & Dock
Entire Place • 3 bedrooms

Private and Relaxing Acreage in West Waverly
Entire Place • 2 bedrooms
*NEW* Riverfront Escape + Hot Tub + Pool Table
Entire Place • 4 bedrooms
Note: Performance varies based on location, size, amenities, seasonality, and management quality. Data reflects the past 12 months.
Top Performing Airbnb Hosts in Waverly (2026)
Learn from the best! This table showcases top-performing Airbnb hosts in Waverly based on the number of properties managed and estimated total revenue over the past year. Analyze their scale and performance metrics.
| Host Name | Properties | Grossing Revenue | Stay Reviews | Avg Rating |
|---|---|---|---|---|
| Alexandra | 2 | $78,571 | 181 | 4.97/5.0 |
| Judy | 2 | $76,868 | 470 | 4.92/5.0 |
| Brent | 6 | $68,415 | 24 | 4.86/5.0 |
| Evolve | 1 | $55,503 | 46 | 5.00/5.0 |
| Jennifer | 1 | $42,978 | 29 | 5.00/5.0 |
| Kris | 2 | $41,250 | 218 | 4.99/5.0 |
| Maddie | 1 | $32,746 | 140 | 4.96/5.0 |
| Haley | 1 | $29,958 | 42 | 4.98/5.0 |
| Jessica | 2 | $25,373 | 10 | 5.00/5.0 |
| Timothy | 2 | $23,847 | 88 | 4.93/5.0 |
Analyzing the strategies of top hosts, such as their property selection, pricing, and guest communication, can offer valuable lessons for optimizing your own Airbnb operations in Waverly.
Dive Deeper: Advanced Waverly STR Market Data (2026)
Ready to unlock more insights? AirROI provides access to advanced metrics and comprehensive Airbnb data for Waverly. Explore detailed analytics beyond this report to refine your investment strategy, optimize pricing, and maximize your vacation rental profits.
Explore Advanced MetricsWaverly Short-Term Rental Market Composition (2026): Property & Room Types
Room Type Distribution
Property Type Distribution
Market Composition Insights for Waverly
- The Waverly Airbnb market composition is heavily skewed towards Entire Home/Apt listings, which make up 100% of the 23 active rentals. This indicates strong guest preference for privacy and space.
- Looking at the property type distribution in Waverly, Apartment/Condo properties are the most common (56.5%), reflecting the local real estate landscape.
- Houses represent a significant 39.1% portion, catering likely to families or larger groups.
- Smaller segments like unique stays (combined 4.3%) offer potential for unique stay experiences.
Waverly Airbnb Room Capacity Analysis (2026): Bedroom Distribution
Distribution of Listings by Number of Bedrooms
Room Capacity Insights for Waverly
- The dominant room capacity in Waverly is 3 bedrooms listings, making up 47.8% of the market. This suggests a strong demand for properties suitable for families or small groups.
- Together, 3 bedrooms and 2 bedrooms properties represent 69.5% of the active Airbnb listings in Waverly, indicating a high concentration in these sizes.
- A significant 56.5% of listings offer 3+ bedrooms, catering to larger groups and families seeking more space in Waverly.
Waverly Vacation Rental Guest Capacity Trends (2026)
Distribution of Listings by Guest Capacity
Guest Capacity Insights for Waverly
- The most common guest capacity trend in Waverly vacation rentals is listings accommodating 6 guests (26.1%). This suggests the primary traveler segment is likely larger groups.
- Properties designed for 6 guests and 7 guests dominate the Waverly STR market, accounting for 43.5% of listings.
- 60.9% of properties accommodate 6+ guests, serving the market segment for larger families or group travel in Waverly.
- On average, properties in Waverly are equipped to host 5.7 guests.
Waverly Airbnb Booking Patterns (2026): Available vs. Booked Days
Available Days Distribution
Booked Days Distribution
Booking Pattern Insights for Waverly
- The most common availability pattern in Waverly falls within the 181-270 days range, representing 47.8% of listings. This suggests many properties have significant open periods on their calendars.
- Approximately 78.2% of listings show high availability (181+ days open annually), indicating potential for increased bookings or specific owner usage patterns.
- For booked days, the 91-180 days range is most frequent in Waverly (52.2%), reflecting common guest stay durations or potential owner blocking patterns.
- A notable 21.7% of properties secure long booking periods (181+ days booked per year), highlighting successful long-term rental strategies or significant owner usage.
Waverly Airbnb Minimum Stay Requirements Analysis
Distribution of Listings by Minimum Night Requirement
1 Night
4 listings
17.4% of total
2 Nights
5 listings
21.7% of total
4-6 Nights
8 listings
34.8% of total
30+ Nights
6 listings
26.1% of total
Key Insights
- The most prevalent minimum stay requirement in Waverly is 4-6 Nights, adopted by 34.8% of listings. This highlights the market's preference for longer commitments.
- A significant segment (26.1%) caters to monthly stays (30+ nights) in Waverly, pointing to opportunities in the extended-stay market.
Recommendations
- Align with the market by considering a 4-6 Nights minimum stay, as 34.8% of Waverly hosts use this setting.
- If feasible, allowing 1-night stays, especially midweek or during low season, could capture last-minute bookings, as only 17.4% currently do.
- Explore offering discounts for stays of 30+ nights to attract the 26.1% of the market seeking extended stays.
- Adjust minimum nights based on seasonality – potentially shorter during low season and longer during peak demand periods in Waverly.
Waverly Airbnb Cancellation Policy Trends Analysis (2026)
Flexible
3 listings
13% of total
Moderate
4 listings
17.4% of total
Firm
10 listings
43.5% of total
Strict
6 listings
26.1% of total
Cancellation Policy Insights for Waverly
- The prevailing Airbnb cancellation policy trend in Waverly is Firm, used by 43.5% of listings.
- A majority (69.6%) of hosts in Waverly utilize Firm or Strict policies, indicating a market where hosts prioritize booking security.
Recommendations for Hosts
- Consider adopting a Firm policy to align with the 43.5% market standard in Waverly.
- Regularly review your cancellation policy against competitors and market demand shifts in Waverly.
Waverly STR Booking Lead Time Analysis (2026)
Average Booking Lead Time by Month
Booking Lead Time Insights for Waverly
- The overall average booking lead time for vacation rentals in Waverly is 42 days.
- Guests book furthest in advance for stays during May (average 79 days), likely coinciding with peak travel demand or local events.
- The shortest booking windows occur for stays in February (average 18 days), indicating more last-minute travel plans during this time.
- Seasonally, Summer (54 days avg.) sees the longest lead times, while Winter (28 days avg.) has the shortest, reflecting typical travel planning cycles.
Recommendations for Hosts
- Use the overall average lead time (42 days) as a baseline for your pricing and availability strategy in Waverly.
- For May stays, consider implementing length-of-stay discounts or slightly higher rates for bookings made less than 79 days out to capitalize on advance planning.
- Target marketing efforts for the Summer season well in advance (at least 54 days) to capture early planners.
- Monitor your own booking lead times against these Waverly averages to identify opportunities for dynamic pricing adjustments.
Popular & Essential Airbnb Amenities in Waverly (2026)
Amenity Prevalence
Amenity Insights for Waverly
- Essential amenities in Waverly that guests expect include: Smoke alarm, TV, Wifi, Carbon monoxide alarm, Air conditioning, Free parking on premises. Lacking these (any) could significantly impact bookings.
- Popular amenities like Kitchen, Fire extinguisher, Heating are common but not universal. Offering these can provide a competitive edge.
Recommendations for Hosts
- Ensure your listing includes all essential amenities for Waverly: Smoke alarm, TV, Wifi, Carbon monoxide alarm, Air conditioning, Free parking on premises.
- Prioritize adding missing essentials: Carbon monoxide alarm, Air conditioning, Free parking on premises.
- Consider adding popular differentiators like Kitchen or Fire extinguisher to increase appeal.
- Highlight unique or less common amenities you offer (e.g., hot tub, dedicated workspace, EV charger) in your listing description and photos.
- Regularly check competitor amenities in Waverly to stay competitive.
Waverly Airbnb Guest Demographics & Profile Analysis (2026)
Guest Profile Summary for Waverly
- The typical guest profile for Airbnb in Waverly consists of primarily domestic travelers (99%), often arriving from nearby Minneapolis, typically belonging to the Post-2000s (Gen Z/Alpha) group (50%), primarily speaking English or Spanish.
- Domestic travelers account for 99.1% of guests.
- Key international markets include United States (99.1%) and Brazil (0.5%).
- Top languages spoken are English (80.6%) followed by Spanish (11.8%).
- A significant demographic segment is the Post-2000s (Gen Z/Alpha) group, representing 50% of guests.
Recommendations for Hosts
- Target domestic marketing efforts towards travelers from Minneapolis and Waverly.
- Tailor amenities and listing descriptions to appeal to the dominant Post-2000s (Gen Z/Alpha) demographic (e.g., highlight fast WiFi, smart home features, local guides).
- Highlight unique local experiences or amenities relevant to the primary guest profile.
- Consider seasonal promotions aligned with peak travel times for key origin markets.
Nearby Short-Term Rental Market Comparison
How does the Waverly Airbnb market stack up against its neighbors? Compare key performance metrics like average monthly revenue, ADR, and occupancy rates in surrounding areas to understand the broader regional STR landscape.
| Market | Active Properties | Monthly Revenue | Daily Rate | Avg. Occupancy |
|---|---|---|---|---|
| Town of Freeman | 15 | $3,468 | $254.01 | 50% |
| University Heights | 12 | $3,004 | $348.00 | 46% |
| Urbandale | 33 | $2,891 | $293.41 | 44% |
| De Soto | 27 | $2,836 | $222.10 | 42% |
| Brownsville | 11 | $2,754 | $248.54 | 44% |
| Dorchester | 11 | $2,707 | $239.53 | 42% |
| Delhi | 11 | $2,589 | $376.30 | 30% |
| West Des Moines | 105 | $2,527 | $185.38 | 51% |
| Town of Campbell | 13 | $2,485 | $168.78 | 53% |
| Dyersville | 19 | $2,379 | $248.71 | 35% |