Pella Airbnb Market Analysis 2026: Short Term Rental Data & Vacation Rental Statistics in Iowa, United States
Is Airbnb profitable in Pella in 2026? Explore comprehensive Airbnb analytics for Pella, Iowa, United States to uncover income potential. This 2026 STR market report for Pella, based on AirROI data from February 2025 to January 2026, reveals key trends in the niche market of 46 active listings.
Whether you're considering an Airbnb investment in Pella, optimizing your existing vacation rental, or exploring rental arbitrage opportunities, understanding the Pella Airbnb data is crucial. Leveraging the low regulation environment is key to maximizing your short term rental income potential. Let's dive into the specifics.
Key Pella Airbnb Performance Metrics Overview
Monthly Airbnb Revenue Variations & Income Potential in Pella (2026)
Understanding the monthly revenue variations for Airbnb listings in Pella is key to maximizing your short term rental income potential. Seasonality significantly impacts earnings. Our analysis, based on data from the past 12 months, shows that the peak revenue month for STRs in Pella is typically August, while February often presents the lowest earnings, highlighting opportunities for strategic pricing adjustments during shoulder and low seasons. Explore the typical Airbnb income in Pella across different performance tiers:
- Best-in-class properties (Top 10%) achieve $5,310+ monthly, often utilizing dynamic pricing and superior guest experiences.
- Strong performing properties (Top 25%) earn $3,211 or more, indicating effective management and desirable locations/amenities.
- Typical properties (Median) generate around $2,005 per month, representing the average market performance.
- Entry-level properties (Bottom 25%) see earnings around $1,138, often with potential for optimization.
Average Monthly Airbnb Earnings Trend in Pella
Pella Airbnb Occupancy Rate Trends (2026)
Maximize your bookings by understanding the Pella STR occupancy trends. Seasonal demand shifts significantly influence how often properties are booked. Typically, Augustsees the highest demand (peak season occupancy), while January experiences the lowest (low season). Effective strategies, like adjusting minimum stays or offering promotions, can boost occupancy during slower periods. Here's how different property tiers perform in Pella:
- Best-in-class properties (Top 10%) achieve 76%+ occupancy, indicating high desirability and potentially optimized availability.
- Strong performing properties (Top 25%) maintain 57% or higher occupancy, suggesting good market fit and guest satisfaction.
- Typical properties (Median) have an occupancy rate around 38%.
- Entry-level properties (Bottom 25%) average 25% occupancy, potentially facing higher vacancy.
Average Monthly Occupancy Rate Trend in Pella
Average Daily Rate (ADR) Airbnb Trends in Pella (2026)
Effective short term rental pricing strategy in Pella involves understanding monthly ADR fluctuations. The Average Daily Rate (ADR) for Airbnb in Pella typically peaks in May and dips lowest during February. Leveraging Airbnb dynamic pricing tools or strategies based on this seasonality can significantly boost revenue. Here's a look at the typical nightly rates achieved:
- Best-in-class properties (Top 10%) command rates of $291+ per night, often due to premium features or locations.
- Strong performing properties (Top 25%) achieve nightly rates of $224 or more.
- Typical properties (Median) charge around $181 per night.
- Entry-level properties (Bottom 25%) earn around $108 per night.
Average Daily Rate (ADR) Trend by Month in Pella
Get Live Pella Market Intelligence 👇

Explore Real-time Analytics
Airbnb Seasonality Analysis & Trends in Pella (2026)
Peak Season (August, July, September)
- Revenue averages $3,172 per month
- Occupancy rates average 53.0%
- Daily rates average $187
Shoulder Season
- Revenue averages $2,488 per month
- Occupancy maintains around 41.4%
- Daily rates hold near $188
Low Season (January, February, March)
- Revenue drops to average $1,707 per month
- Occupancy decreases to average 33.9%
- Daily rates adjust to average $173
Seasonality Insights for Pella
- The Airbnb seasonality in Pella shows highly seasonal trends requiring careful strategy. While the sections above show seasonal averages, it's also insightful to look at the extremes:
- During the high season, the absolute peak month showcases Pella's highest earning potential, with monthly revenues capable of climbing to $3,328, occupancy reaching a high of 55.6%, and ADRs peaking at $194.
- Conversely, the slowest single month of the year, typically falling within the low season, marks the market's lowest point. In this month, revenue might dip to $1,165, occupancy could drop to 29.7%, and ADRs may adjust down to $165.
- Understanding both the seasonal averages and these monthly peaks and troughs in revenue, occupancy, and ADR is crucial for maximizing your Airbnb profit potential in Pella.
Seasonal Strategies for Maximizing Profit
- Peak Season: Maximize revenue through premium pricing and potentially longer minimum stays. Ensure high availability.
- Low Season: Offer competitive pricing, special promotions (e.g., extended stay discounts), and flexible cancellation policies. Target off-season travelers like remote workers or budget-conscious guests.
- Shoulder Seasons: Implement dynamic pricing that balances peak and low rates. Target weekend travelers or specific events. Offer slightly more flexible terms than peak season.
- Regularly analyze your own performance against these Pella seasonality benchmarks and adjust your pricing and availability strategy accordingly.
Best Areas for Airbnb Investment in Pella (2026)
Exploring the top neighborhoods for short-term rentals in Pella? This section highlights key areas, outlining why they are attractive for hosts and guests, along with notable local attractions. Consider these locations based on your target guest profile and investment strategy.
| Neighborhood / Area | Why Host Here? (Target Guests & Appeal) | Key Attractions & Landmarks |
|---|---|---|
| Downtown Pella | The heart of Pella, known for its charming Dutch architecture and vibrant community events. Ideal for guests wanting a local experience with easy access to shops and restaurants. | Pella Historical Society & Museums, Molengracht Plaza, Pella Window & Door, Central Park, Tulip Time Festival |
| Lake Red Rock | A popular recreational area offering a variety of outdoor activities such as boating, fishing, and hiking. Attracts nature lovers and families looking for a relaxing getaway. | Red Rock Dam, Lake Red Rock, Coalition of the Future, Hiking Trails, Picnic Areas |
| Pella Golf & Country Club | A scenic location for golf enthusiasts and those seeking a tranquil environment. Offers a peaceful retreat while still being close to city amenities. | Pella Golf & Country Club, Beautiful Views, Community Events |
| Turtle Creek Park | A lovely park area that is great for family gatherings and picnics. This area appeals to families and those looking for outdoor fun. | Playgrounds, Walking Trails, Picnic Areas |
| Culver's of Pella | A popular dining location known for its delicious menu, attracting visitors looking for good food and casual dining experiences. | Delicious Frozen Custard, Family-Friendly Atmosphere |
| Schmidt Park | A serene park area perfect for relaxation and outdoor activities. Popular among locals and visitors looking for a quiet spot to unwind. | Walking Trails, Picnic Areas, Playgrounds |
| Pella Opera House | A historic venue hosting various cultural events and performances. Great for those interested in arts and entertainment. | Theater Performances, Art Shows, Community Events |
| Pella Dutch Market | A unique shopping experience that showcases local crafts and foods. Attracts visitors interested in local culture and produce. | Local Produce, Crafts and Gifts, Food Stalls |
Understanding Airbnb License Requirements & STR Laws in Pella (2026)
While Pella, Iowa, United States currently shows low STR regulations, specific Airbnb license requirements might still exist or change. Always verify the latest short term rental regulations and Airbnb license requirements directly with local government authorities for Pella to ensure full compliance before hosting.
(Source: AirROI data, 2026, finding no licensed listings among those analyzed)
Top Performing Airbnb Properties in Pella (2026)
Benchmark your potential! Explore examples of top-performing Airbnb properties in Pellabased on Trailing Twelve Month (TTM) revenue. Analyze their characteristics, revenue, occupancy rate, and ADR to understand what drives success in this market.
Pristine getaway for groups; 5 BR - sleeps 16+
Entire Place • 5 bedrooms
Prairie Pointe of Pella
Entire Place • 3 bedrooms
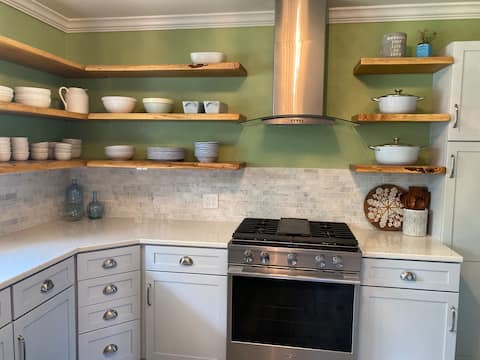
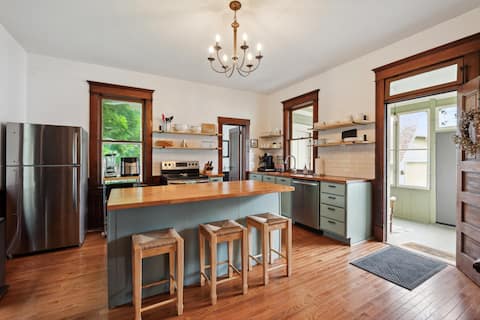
Modern Downtown Retreat In The Heart Of Pella
Entire Place • 3 bedrooms
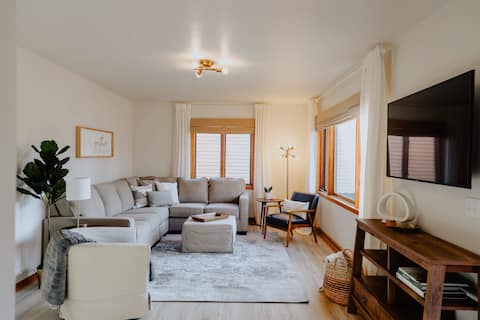
Warm, inviting home in the heart of Pella
Entire Place • 2 bedrooms
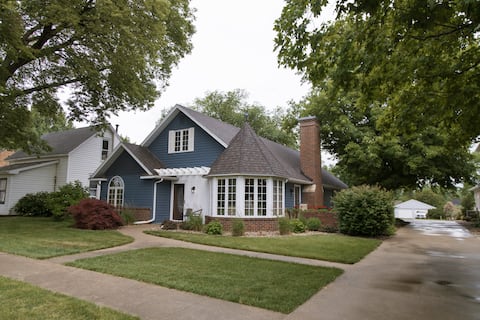
Clover leaf Cottage- Spacious DT Pella Home
Entire Place • 4 bedrooms
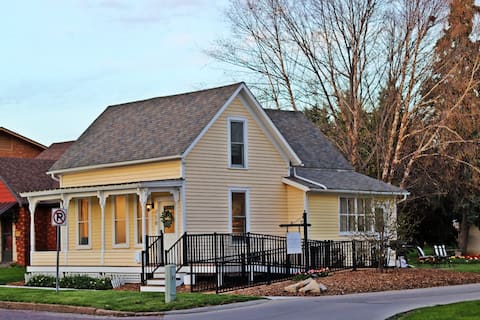
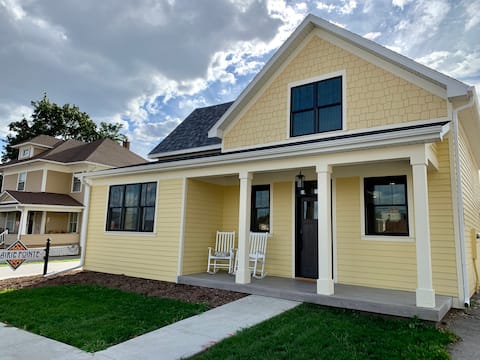
Adorable Little Yellow House, Downtown Pella, IA
Entire Place • 3 bedrooms
Note: Performance varies based on location, size, amenities, seasonality, and management quality. Data reflects the past 12 months.
Top Performing Airbnb Hosts in Pella (2026)
Learn from the best! This table showcases top-performing Airbnb hosts in Pella based on the number of properties managed and estimated total revenue over the past year. Analyze their scale and performance metrics.
| Host Name | Properties | Grossing Revenue | Stay Reviews | Avg Rating |
|---|---|---|---|---|
| Ciara | 7 | $158,730 | 199 | 4.92/5.0 |
| Andrea | 2 | $82,886 | 311 | 4.95/5.0 |
| Elizabeth | 1 | $73,994 | 136 | 5.00/5.0 |
| Lori | 1 | $68,985 | 26 | 4.92/5.0 |
| Stuart | 1 | $61,148 | 163 | 5.00/5.0 |
| Dennis And Michelle | 1 | $59,766 | 77 | 5.00/5.0 |
| Evolve | 2 | $55,310 | 27 | 4.82/5.0 |
| Sarah | 2 | $53,589 | 83 | 4.98/5.0 |
| Mike | 1 | $36,791 | 39 | 4.97/5.0 |
| Cyndi | 1 | $35,189 | 66 | 5.00/5.0 |
Analyzing the strategies of top hosts, such as their property selection, pricing, and guest communication, can offer valuable lessons for optimizing your own Airbnb operations in Pella.
Dive Deeper: Advanced Pella STR Market Data (2026)
Ready to unlock more insights? AirROI provides access to advanced metrics and comprehensive Airbnb data for Pella. Explore detailed analytics beyond this report to refine your investment strategy, optimize pricing, and maximize your vacation rental profits.
Explore Advanced MetricsPella Short-Term Rental Market Composition (2026): Property & Room Types
Room Type Distribution
Property Type Distribution
Market Composition Insights for Pella
- The Pella Airbnb market composition is heavily skewed towards Entire Home/Apt listings, which make up 87% of the 46 active rentals. This indicates strong guest preference for privacy and space.
- Looking at the property type distribution in Pella, House properties are the most common (56.5%), reflecting the local real estate landscape.
- Houses represent a significant 56.5% portion, catering likely to families or larger groups.
- Smaller segments like outdoor/unique, others (combined 6.5%) offer potential for unique stay experiences.
Pella Airbnb Room Capacity Analysis (2026): Bedroom Distribution
Distribution of Listings by Number of Bedrooms
Room Capacity Insights for Pella
- The dominant room capacity in Pella is 2 bedrooms listings, making up 30.4% of the market. This suggests a strong demand for properties suitable for couples or solo travelers.
- Together, 2 bedrooms and 3 bedrooms properties represent 56.5% of the active Airbnb listings in Pella, indicating a high concentration in these sizes.
- A significant 34.8% of listings offer 3+ bedrooms, catering to larger groups and families seeking more space in Pella.
Pella Vacation Rental Guest Capacity Trends (2026)
Distribution of Listings by Guest Capacity
Guest Capacity Insights for Pella
- The most common guest capacity trend in Pella vacation rentals is listings accommodating 8+ guests (26.1%). This suggests the primary traveler segment is likely larger groups.
- Properties designed for 8+ guests and 6 guests dominate the Pella STR market, accounting for 50.0% of listings.
- 52.2% of properties accommodate 6+ guests, serving the market segment for larger families or group travel in Pella.
- On average, properties in Pella are equipped to host 4.9 guests.
Pella Airbnb Booking Patterns (2026): Available vs. Booked Days
Available Days Distribution
Booked Days Distribution
Booking Pattern Insights for Pella
- The most common availability pattern in Pella falls within the 181-270 days range, representing 50% of listings. This suggests many properties have significant open periods on their calendars.
- Approximately 82.6% of listings show high availability (181+ days open annually), indicating potential for increased bookings or specific owner usage patterns.
- For booked days, the 91-180 days range is most frequent in Pella (52.2%), reflecting common guest stay durations or potential owner blocking patterns.
- A notable 17.3% of properties secure long booking periods (181+ days booked per year), highlighting successful long-term rental strategies or significant owner usage.
Pella Airbnb Minimum Stay Requirements Analysis
Distribution of Listings by Minimum Night Requirement
1 Night
18 listings
39.1% of total
2 Nights
18 listings
39.1% of total
4-6 Nights
3 listings
6.5% of total
30+ Nights
7 listings
15.2% of total
Key Insights
- The most prevalent minimum stay requirement in Pella is 1 Night, adopted by 39.1% of listings. This highlights the market's preference for shorter, flexible bookings.
- A strong majority (78.2%) of the Pella Airbnb data shows acceptance of very short stays (1-2 nights), indicating a dynamic, high-turnover market.
- A significant segment (15.2%) caters to monthly stays (30+ nights) in Pella, pointing to opportunities in the extended-stay market.
Recommendations
- Align with the market by considering a 1 Night minimum stay, as 39.1% of Pella hosts use this setting.
- Explore offering discounts for stays of 30+ nights to attract the 15.2% of the market seeking extended stays.
- Adjust minimum nights based on seasonality – potentially shorter during low season and longer during peak demand periods in Pella.
Pella Airbnb Cancellation Policy Trends Analysis (2026)
Flexible
6 listings
13% of total
Moderate
10 listings
21.7% of total
Firm
23 listings
50% of total
Strict
7 listings
15.2% of total
Cancellation Policy Insights for Pella
- The prevailing Airbnb cancellation policy trend in Pella is Firm, used by 50% of listings.
- A majority (65.2%) of hosts in Pella utilize Firm or Strict policies, indicating a market where hosts prioritize booking security.
Recommendations for Hosts
- Consider adopting a Firm policy to align with the 50% market standard in Pella.
- Regularly review your cancellation policy against competitors and market demand shifts in Pella.
Pella STR Booking Lead Time Analysis (2026)
Average Booking Lead Time by Month
Booking Lead Time Insights for Pella
- The overall average booking lead time for vacation rentals in Pella is 58 days.
- Guests book furthest in advance for stays during May (average 115 days), likely coinciding with peak travel demand or local events.
- The shortest booking windows occur for stays in February (average 30 days), indicating more last-minute travel plans during this time.
- Seasonally, Spring (80 days avg.) sees the longest lead times, while Winter (44 days avg.) has the shortest, reflecting typical travel planning cycles.
Recommendations for Hosts
- Use the overall average lead time (58 days) as a baseline for your pricing and availability strategy in Pella.
- For May stays, consider implementing length-of-stay discounts or slightly higher rates for bookings made less than 115 days out to capitalize on advance planning.
- Target marketing efforts for the Spring season well in advance (at least 80 days) to capture early planners.
- Monitor your own booking lead times against these Pella averages to identify opportunities for dynamic pricing adjustments.
Popular & Essential Airbnb Amenities in Pella (2026)
Amenity Prevalence
Amenity Insights for Pella
- Essential amenities in Pella that guests expect include: Wifi, Smoke alarm, Air conditioning, TV. Lacking these (any) could significantly impact bookings.
- Popular amenities like Carbon monoxide alarm, Coffee maker, Heating are common but not universal. Offering these can provide a competitive edge.
Recommendations for Hosts
- Ensure your listing includes all essential amenities for Pella: Wifi, Smoke alarm, Air conditioning, TV.
- Prioritize adding missing essentials: TV.
- Consider adding popular differentiators like Carbon monoxide alarm or Coffee maker to increase appeal.
- Highlight unique or less common amenities you offer (e.g., hot tub, dedicated workspace, EV charger) in your listing description and photos.
- Regularly check competitor amenities in Pella to stay competitive.
Pella Airbnb Guest Demographics & Profile Analysis (2026)
Guest Profile Summary for Pella
- The typical guest profile for Airbnb in Pella consists of primarily domestic travelers (98%), often arriving from nearby Omaha, typically belonging to the Post-2000s (Gen Z/Alpha) group (50%), primarily speaking English or Spanish.
- Domestic travelers account for 98.1% of guests.
- Key international markets include United States (98.1%) and United Kingdom (0.6%).
- Top languages spoken are English (85.6%) followed by Spanish (5.4%).
- A significant demographic segment is the Post-2000s (Gen Z/Alpha) group, representing 50% of guests.
Recommendations for Hosts
- Target domestic marketing efforts towards travelers from Omaha and Minneapolis.
- Tailor amenities and listing descriptions to appeal to the dominant Post-2000s (Gen Z/Alpha) demographic (e.g., highlight fast WiFi, smart home features, local guides).
- Highlight unique local experiences or amenities relevant to the primary guest profile.
- Consider seasonal promotions aligned with peak travel times for key origin markets.
Nearby Short-Term Rental Market Comparison
How does the Pella Airbnb market stack up against its neighbors? Compare key performance metrics like average monthly revenue, ADR, and occupancy rates in surrounding areas to understand the broader regional STR landscape.
| Market | Active Properties | Monthly Revenue | Daily Rate | Avg. Occupancy |
|---|---|---|---|---|
| University Heights | 12 | $3,004 | $348.00 | 46% |
| Urbandale | 33 | $2,891 | $293.41 | 44% |
| Delhi | 11 | $2,589 | $376.30 | 30% |
| West Des Moines | 105 | $2,527 | $185.38 | 51% |
| Dyersville | 19 | $2,379 | $248.71 | 35% |
| Iowa City | 155 | $2,310 | $242.10 | 44% |
| Windsor Heights | 11 | $2,243 | $169.45 | 50% |
| Penn Township | 11 | $2,154 | $221.94 | 36% |
| Ames | 109 | $2,129 | $212.30 | 40% |
| Ankeny | 61 | $2,084 | $192.68 | 42% |