Cedar Rapids Airbnb Market Analysis 2026: Short Term Rental Data & Vacation Rental Statistics in Iowa, United States
Is Airbnb profitable in Cedar Rapids in 2026? Explore comprehensive Airbnb analytics for Cedar Rapids, Iowa, United States to uncover income potential. This 2026 STR market report for Cedar Rapids, based on AirROI data from February 2025 to January 2026, reveals key trends in the market of 210 active listings.
Whether you're considering an Airbnb investment in Cedar Rapids, optimizing your existing vacation rental, or exploring rental arbitrage opportunities, understanding the Cedar Rapids Airbnb data is crucial. Leveraging the low regulation environment is key to maximizing your short term rental income potential. Let's dive into the specifics.
Key Cedar Rapids Airbnb Performance Metrics Overview
Monthly Airbnb Revenue Variations & Income Potential in Cedar Rapids (2026)
Understanding the monthly revenue variations for Airbnb listings in Cedar Rapids is key to maximizing your short term rental income potential. Seasonality significantly impacts earnings. Our analysis, based on data from the past 12 months, shows that the peak revenue month for STRs in Cedar Rapids is typically November, while February often presents the lowest earnings, highlighting opportunities for strategic pricing adjustments during shoulder and low seasons. Explore the typical Airbnb income in Cedar Rapids across different performance tiers:
- Best-in-class properties (Top 10%) achieve $4,158+ monthly, often utilizing dynamic pricing and superior guest experiences.
- Strong performing properties (Top 25%) earn $3,036 or more, indicating effective management and desirable locations/amenities.
- Typical properties (Median) generate around $2,154 per month, representing the average market performance.
- Entry-level properties (Bottom 25%) see earnings around $1,311, often with potential for optimization.
Average Monthly Airbnb Earnings Trend in Cedar Rapids
Cedar Rapids Airbnb Occupancy Rate Trends (2026)
Maximize your bookings by understanding the Cedar Rapids STR occupancy trends. Seasonal demand shifts significantly influence how often properties are booked. Typically, Novembersees the highest demand (peak season occupancy), while February experiences the lowest (low season). Effective strategies, like adjusting minimum stays or offering promotions, can boost occupancy during slower periods. Here's how different property tiers perform in Cedar Rapids:
- Best-in-class properties (Top 10%) achieve 87%+ occupancy, indicating high desirability and potentially optimized availability.
- Strong performing properties (Top 25%) maintain 76% or higher occupancy, suggesting good market fit and guest satisfaction.
- Typical properties (Median) have an occupancy rate around 58%.
- Entry-level properties (Bottom 25%) average 38% occupancy, potentially facing higher vacancy.
Average Monthly Occupancy Rate Trend in Cedar Rapids
Average Daily Rate (ADR) Airbnb Trends in Cedar Rapids (2026)
Effective short term rental pricing strategy in Cedar Rapids involves understanding monthly ADR fluctuations. The Average Daily Rate (ADR) for Airbnb in Cedar Rapids typically peaks in December and dips lowest during February. Leveraging Airbnb dynamic pricing tools or strategies based on this seasonality can significantly boost revenue. Here's a look at the typical nightly rates achieved:
- Best-in-class properties (Top 10%) command rates of $205+ per night, often due to premium features or locations.
- Strong performing properties (Top 25%) achieve nightly rates of $154 or more.
- Typical properties (Median) charge around $111 per night.
- Entry-level properties (Bottom 25%) earn around $82 per night.
Average Daily Rate (ADR) Trend by Month in Cedar Rapids
Get Live Cedar Rapids Market Intelligence 👇

Explore Real-time Analytics
Airbnb Seasonality Analysis & Trends in Cedar Rapids (2026)
Peak Season (November, October, September)
- Revenue averages $2,907 per month
- Occupancy rates average 64.0%
- Daily rates average $135
Shoulder Season
- Revenue averages $2,494 per month
- Occupancy maintains around 57.2%
- Daily rates hold near $129
Low Season (February, March, April)
- Revenue drops to average $1,564 per month
- Occupancy decreases to average 45.9%
- Daily rates adjust to average $114
Seasonality Insights for Cedar Rapids
- The Airbnb seasonality in Cedar Rapids shows highly seasonal trends requiring careful strategy. While the sections above show seasonal averages, it's also insightful to look at the extremes:
- During the high season, the absolute peak month showcases Cedar Rapids's highest earning potential, with monthly revenues capable of climbing to $3,065, occupancy reaching a high of 68.8%, and ADRs peaking at $137.
- Conversely, the slowest single month of the year, typically falling within the low season, marks the market's lowest point. In this month, revenue might dip to $1,323, occupancy could drop to 42.3%, and ADRs may adjust down to $113.
- Understanding both the seasonal averages and these monthly peaks and troughs in revenue, occupancy, and ADR is crucial for maximizing your Airbnb profit potential in Cedar Rapids.
Seasonal Strategies for Maximizing Profit
- Peak Season: Maximize revenue through premium pricing and potentially longer minimum stays. Ensure high availability.
- Low Season: Offer competitive pricing, special promotions (e.g., extended stay discounts), and flexible cancellation policies. Target off-season travelers like remote workers or budget-conscious guests.
- Shoulder Seasons: Implement dynamic pricing that balances peak and low rates. Target weekend travelers or specific events. Offer slightly more flexible terms than peak season.
- Regularly analyze your own performance against these Cedar Rapids seasonality benchmarks and adjust your pricing and availability strategy accordingly.
Best Areas for Airbnb Investment in Cedar Rapids (2026)
Exploring the top neighborhoods for short-term rentals in Cedar Rapids? This section highlights key areas, outlining why they are attractive for hosts and guests, along with notable local attractions. Consider these locations based on your target guest profile and investment strategy.
| Neighborhood / Area | Why Host Here? (Target Guests & Appeal) | Key Attractions & Landmarks |
|---|---|---|
| Downtown Cedar Rapids | The heart of the city with a mix of culture, dining, and entertainment options. Ideal for business travelers and tourists alike, offering easy access to major attractions. | Paramount Theatre, Cedar Rapids Museum of Art, NewBo City Market, Brucemore, Cedar River Trail, The Cherry Building |
| New Bohemia District | A vibrant arts and culture hub with plenty of local shops and restaurants. Attracts young people and those looking for a trendy experience with a community feel. | NewBo City Market, CSPS Hall, local craft breweries, art galleries, food trucks, live music venues |
| Legion Park Area | A residential neighborhood close to parks and schools, making it attractive for families and those needing more space for long-term stays. | Legion Park, local dining, easy access to downtown, neighborhood parks, quiet residential vibes |
| Cedar Rapids Historic District | A historic area with beautiful architecture and a charming atmosphere. Popular among visitors seeking a unique, time-honored experience. | Brucemore, Cedar Rapids Public Library, Cedar Rapids Opera Theatre, historic homes, beautiful tree-lined streets |
| West Cedar Rapids | A growing area with family-friendly amenities and parks. Good for those who want to stay close to nature while still being near the city. | Palisades-Kepler State Park, local family-friendly restaurants, shopping options, walking trails, parks |
| Ottumwa | A unique neighborhood that offers a small-town feel with easy access to urban amenities, great for tourists looking for a quieter stay. | Ottumwa Park, local shops, historic sites, cafes, scenic river views |
| North Cedar Rapids | An emerging neighborhood with affordable housing and close-knit community vibes. Attractive for budget travelers and families. | local parks, community events, shopping areas, schools |
| Southwest Cedar Rapids | Offers a suburban lifestyle with proximity to schools and parks. Ideal for longer stays and families looking for comfort. | Southwest Park, local markets, shopping centers, family-friendly activities |
Understanding Airbnb License Requirements & STR Laws in Cedar Rapids (2026)
While Cedar Rapids, Iowa, United States currently shows low STR regulations, specific Airbnb license requirements might still exist or change. Always verify the latest short term rental regulations and Airbnb license requirements directly with local government authorities for Cedar Rapids to ensure full compliance before hosting.
(Source: AirROI data, 2026, based on 0% licensed listings)
Top Performing Airbnb Properties in Cedar Rapids (2026)
Benchmark your potential! Explore examples of top-performing Airbnb properties in Cedar Rapidsbased on Trailing Twelve Month (TTM) revenue. Analyze their characteristics, revenue, occupancy rate, and ADR to understand what drives success in this market.
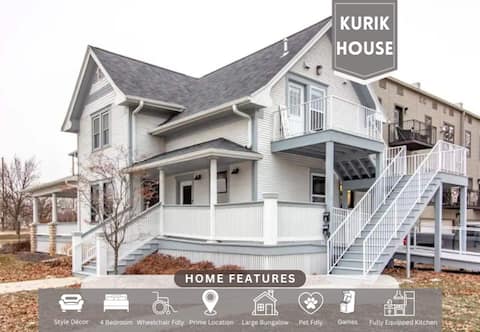
Kurik House Combined | ADA by 5 Seasons Homestays
Entire Place • 4 bedrooms
G&C Acres, our Little Slice of Heaven in Iowa
Entire Place • 3 bedrooms
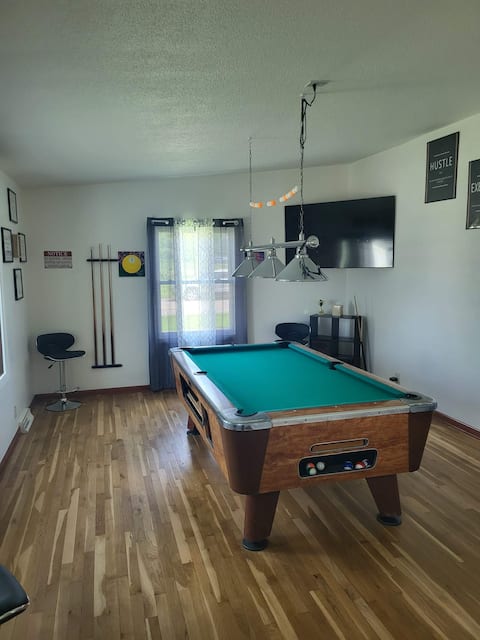
Kadia’s Place-The One With The Pool Table
Entire Place • 3 bedrooms
Modern & Homely 4 Bdr NE House by the Golf Course
Entire Place • 4 bedrooms
3 Homes In A Row - 10 Beds on C Ave!
Entire Place • 9 bedrooms
Vibrant Getaway! King Beds & 2 Baths. Sleeps 10
Entire Place • 3 bedrooms
Note: Performance varies based on location, size, amenities, seasonality, and management quality. Data reflects the past 12 months.
Top Performing Airbnb Hosts in Cedar Rapids (2026)
Learn from the best! This table showcases top-performing Airbnb hosts in Cedar Rapids based on the number of properties managed and estimated total revenue over the past year. Analyze their scale and performance metrics.
| Host Name | Properties | Grossing Revenue | Stay Reviews | Avg Rating |
|---|---|---|---|---|
| Mark | 27 | $626,698 | 1743 | 4.87/5.0 |
| Angela | 15 | $236,591 | 365 | 4.64/5.0 |
| Richard & Tim | 8 | $182,708 | 1412 | 4.97/5.0 |
| Harshad | 2 | $139,183 | 419 | 4.86/5.0 |
| Kathleen | 4 | $131,774 | 317 | 4.96/5.0 |
| Kadia | 3 | $123,380 | 201 | 4.96/5.0 |
| Renjena | 3 | $119,289 | 397 | 4.81/5.0 |
| Tabby | 4 | $104,030 | 311 | 4.98/5.0 |
| Sue | 3 | $101,129 | 456 | 4.97/5.0 |
| Dan | 2 | $98,633 | 368 | 4.92/5.0 |
Analyzing the strategies of top hosts, such as their property selection, pricing, and guest communication, can offer valuable lessons for optimizing your own Airbnb operations in Cedar Rapids.
Dive Deeper: Advanced Cedar Rapids STR Market Data (2026)
Ready to unlock more insights? AirROI provides access to advanced metrics and comprehensive Airbnb data for Cedar Rapids. Explore detailed analytics beyond this report to refine your investment strategy, optimize pricing, and maximize your vacation rental profits.
Explore Advanced MetricsCedar Rapids Short-Term Rental Market Composition (2026): Property & Room Types
Room Type Distribution
Property Type Distribution
Market Composition Insights for Cedar Rapids
- The Cedar Rapids Airbnb market composition is heavily skewed towards Entire Home/Apt listings, which make up 91.9% of the 210 active rentals. This indicates strong guest preference for privacy and space.
- Looking at the property type distribution in Cedar Rapids, House properties are the most common (64.8%), reflecting the local real estate landscape.
- Houses represent a significant 64.8% portion, catering likely to families or larger groups.
- Smaller segments like others, outdoor/unique, hotel/boutique (combined 5.2%) offer potential for unique stay experiences.
Cedar Rapids Airbnb Room Capacity Analysis (2026): Bedroom Distribution
Distribution of Listings by Number of Bedrooms
Room Capacity Insights for Cedar Rapids
- The dominant room capacity in Cedar Rapids is 2 bedrooms listings, making up 31% of the market. This suggests a strong demand for properties suitable for couples or solo travelers.
- Together, 2 bedrooms and 1 bedroom properties represent 57.2% of the active Airbnb listings in Cedar Rapids, indicating a high concentration in these sizes.
- A significant 32.4% of listings offer 3+ bedrooms, catering to larger groups and families seeking more space in Cedar Rapids.
Cedar Rapids Vacation Rental Guest Capacity Trends (2026)
Distribution of Listings by Guest Capacity
Guest Capacity Insights for Cedar Rapids
- The most common guest capacity trend in Cedar Rapids vacation rentals is listings accommodating 4 guests (23.8%). This suggests the primary traveler segment is likely small families or groups.
- Properties designed for 4 guests and 8+ guests dominate the Cedar Rapids STR market, accounting for 46.2% of listings.
- 37.6% of properties accommodate 6+ guests, serving the market segment for larger families or group travel in Cedar Rapids.
- On average, properties in Cedar Rapids are equipped to host 4.6 guests.
Cedar Rapids Airbnb Booking Patterns (2026): Available vs. Booked Days
Available Days Distribution
Booked Days Distribution
Booking Pattern Insights for Cedar Rapids
- The most common availability pattern in Cedar Rapids falls within the 91-180 days range, representing 38.1% of listings. This suggests many properties have significant open periods on their calendars.
- Approximately 53.8% of listings show high availability (181+ days open annually), indicating potential for increased bookings or specific owner usage patterns.
- For booked days, the 181-270 days range is most frequent in Cedar Rapids (36.2%), reflecting common guest stay durations or potential owner blocking patterns.
- A notable 46.7% of properties secure long booking periods (181+ days booked per year), highlighting successful long-term rental strategies or significant owner usage.
Cedar Rapids Airbnb Minimum Stay Requirements Analysis
Distribution of Listings by Minimum Night Requirement
1 Night
74 listings
35.2% of total
2 Nights
61 listings
29% of total
3 Nights
8 listings
3.8% of total
4-6 Nights
5 listings
2.4% of total
7-29 Nights
16 listings
7.6% of total
30+ Nights
46 listings
21.9% of total
Key Insights
- The most prevalent minimum stay requirement in Cedar Rapids is 1 Night, adopted by 35.2% of listings. This highlights the market's preference for shorter, flexible bookings.
- A strong majority (64.2%) of the Cedar Rapids Airbnb data shows acceptance of very short stays (1-2 nights), indicating a dynamic, high-turnover market.
- A significant segment (21.9%) caters to monthly stays (30+ nights) in Cedar Rapids, pointing to opportunities in the extended-stay market.
Recommendations
- Align with the market by considering a 1 Night minimum stay, as 35.2% of Cedar Rapids hosts use this setting.
- Explore offering discounts for stays of 30+ nights to attract the 21.9% of the market seeking extended stays.
- Adjust minimum nights based on seasonality – potentially shorter during low season and longer during peak demand periods in Cedar Rapids.
Cedar Rapids Airbnb Cancellation Policy Trends Analysis (2026)
Flexible
78 listings
37.1% of total
Moderate
74 listings
35.2% of total
Firm
50 listings
23.8% of total
Strict
8 listings
3.8% of total
Cancellation Policy Insights for Cedar Rapids
- The prevailing Airbnb cancellation policy trend in Cedar Rapids is Flexible, used by 37.1% of listings.
- The market strongly favors guest-friendly terms, with 72.3% of listings offering Flexible or Moderate policies. This suggests guests in Cedar Rapids may expect booking flexibility.
- Strict cancellation policies are quite rare (3.8%), potentially making listings with this policy less competitive unless justified by high demand or property type.
Recommendations for Hosts
- Consider adopting a Flexible policy to align with the 37.1% market standard in Cedar Rapids.
- Using a Strict policy might deter some guests, as only 3.8% of listings use it. Evaluate if potential revenue protection outweighs possible lower booking rates.
- Regularly review your cancellation policy against competitors and market demand shifts in Cedar Rapids.
Cedar Rapids STR Booking Lead Time Analysis (2026)
Average Booking Lead Time by Month
Booking Lead Time Insights for Cedar Rapids
- The overall average booking lead time for vacation rentals in Cedar Rapids is 34 days.
- Guests book furthest in advance for stays during June (average 50 days), likely coinciding with peak travel demand or local events.
- The shortest booking windows occur for stays in January (average 17 days), indicating more last-minute travel plans during this time.
- Seasonally, Summer (43 days avg.) sees the longest lead times, while Winter (22 days avg.) has the shortest, reflecting typical travel planning cycles.
Recommendations for Hosts
- Use the overall average lead time (34 days) as a baseline for your pricing and availability strategy in Cedar Rapids.
- For June stays, consider implementing length-of-stay discounts or slightly higher rates for bookings made less than 50 days out to capitalize on advance planning.
- Target marketing efforts for the Summer season well in advance (at least 43 days) to capture early planners.
- Monitor your own booking lead times against these Cedar Rapids averages to identify opportunities for dynamic pricing adjustments.
Popular & Essential Airbnb Amenities in Cedar Rapids (2026)
Amenity Prevalence
Amenity Insights for Cedar Rapids
- Essential amenities in Cedar Rapids that guests expect include: Wifi, Smoke alarm, Air conditioning, Heating, TV. Lacking these (any) could significantly impact bookings.
- Popular amenities like Hot water, Kitchen, Carbon monoxide alarm are common but not universal. Offering these can provide a competitive edge.
Recommendations for Hosts
- Ensure your listing includes all essential amenities for Cedar Rapids: Wifi, Smoke alarm, Air conditioning, Heating, TV.
- Prioritize adding missing essentials: Wifi, Smoke alarm, Air conditioning, Heating, TV.
- Consider adding popular differentiators like Hot water or Kitchen to increase appeal.
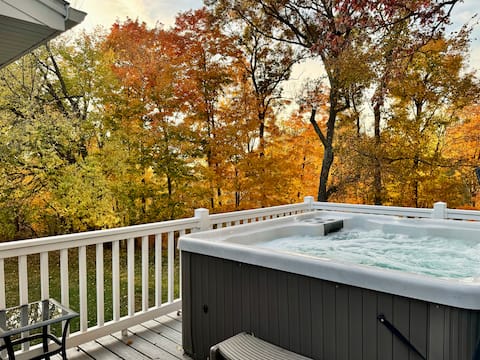
- Highlight unique or less common amenities you offer (e.g., hot tub, dedicated workspace, EV charger) in your listing description and photos.
- Regularly check competitor amenities in Cedar Rapids to stay competitive.
Cedar Rapids Airbnb Guest Demographics & Profile Analysis (2026)
Guest Profile Summary for Cedar Rapids
- The typical guest profile for Airbnb in Cedar Rapids consists of primarily domestic travelers (98%), often arriving from nearby Chicago, typically belonging to the Post-2000s (Gen Z/Alpha) group (50%), primarily speaking English or Spanish.
- Domestic travelers account for 97.6% of guests.
- Key international markets include United States (97.6%) and United Kingdom (0.5%).
- Top languages spoken are English (76.8%) followed by Spanish (11.2%).
- A significant demographic segment is the Post-2000s (Gen Z/Alpha) group, representing 50% of guests.
Recommendations for Hosts
- Target domestic marketing efforts towards travelers from Chicago and Minneapolis.
- Tailor amenities and listing descriptions to appeal to the dominant Post-2000s (Gen Z/Alpha) demographic (e.g., highlight fast WiFi, smart home features, local guides).
- Highlight unique local experiences or amenities relevant to the primary guest profile.
- Consider seasonal promotions aligned with peak travel times for key origin markets.
Nearby Short-Term Rental Market Comparison
How does the Cedar Rapids Airbnb market stack up against its neighbors? Compare key performance metrics like average monthly revenue, ADR, and occupancy rates in surrounding areas to understand the broader regional STR landscape.
| Market | Active Properties | Monthly Revenue | Daily Rate | Avg. Occupancy |
|---|---|---|---|---|
| East Galena Township | 43 | $4,168 | $345.11 | 40% |
| Guilford Township | 288 | $3,843 | $368.50 | 35% |
| University Heights | 12 | $3,004 | $348.00 | 46% |
| East Dubuque | 17 | $2,809 | $236.83 | 41% |
| Thompson Township | 17 | $2,652 | $411.44 | 30% |
| Delhi | 11 | $2,589 | $376.30 | 30% |
| Dyersville | 19 | $2,379 | $248.71 | 35% |
| Iowa City | 155 | $2,310 | $242.10 | 44% |
| Galena | 174 | $2,255 | $273.51 | 34% |
| Penn Township | 11 | $2,154 | $221.94 | 36% |