West Baden Springs Airbnb Market Analysis 2025: Short Term Rental Data & Vacation Rental Statistics in Indiana, United States
Is Airbnb profitable in West Baden Springs in 2025? Explore comprehensive Airbnb analytics for West Baden Springs, Indiana, United States to uncover income potential. This 2025 STR market report for West Baden Springs, based on AirROI data from November 2024 to October 2025, reveals key trends in the niche market of 20 active listings.
Whether you're considering an Airbnb investment in West Baden Springs, optimizing your existing vacation rental, or exploring rental arbitrage opportunities, understanding the West Baden Springs Airbnb data is crucial. Leveraging the low regulation environment is key to maximizing your short term rental income potential. Let's dive into the specifics.
Key West Baden Springs Airbnb Performance Metrics Overview
Monthly Airbnb Revenue Variations & Income Potential in West Baden Springs (2025)
Understanding the monthly revenue variations for Airbnb listings in West Baden Springs is key to maximizing your short term rental income potential. Seasonality significantly impacts earnings. Our analysis, based on data from the past 12 months, shows that the peak revenue month for STRs in West Baden Springs is typically July, while January often presents the lowest earnings, highlighting opportunities for strategic pricing adjustments during shoulder and low seasons. Explore the typical Airbnb income in West Baden Springs across different performance tiers:
- Best-in-class properties (Top 10%) achieve $9,675+ monthly, often utilizing dynamic pricing and superior guest experiences.
- Strong performing properties (Top 25%) earn $6,191 or more, indicating effective management and desirable locations/amenities.
- Typical properties (Median) generate around $1,967 per month, representing the average market performance.
- Entry-level properties (Bottom 25%) see earnings around $997, often with potential for optimization.
Average Monthly Airbnb Earnings Trend in West Baden Springs
West Baden Springs Airbnb Occupancy Rate Trends (2025)
Maximize your bookings by understanding the West Baden Springs STR occupancy trends. Seasonal demand shifts significantly influence how often properties are booked. Typically, Augustsees the highest demand (peak season occupancy), while February experiences the lowest (low season). Effective strategies, like adjusting minimum stays or offering promotions, can boost occupancy during slower periods. Here's how different property tiers perform in West Baden Springs:
- Best-in-class properties (Top 10%) achieve 63%+ occupancy, indicating high desirability and potentially optimized availability.
- Strong performing properties (Top 25%) maintain 37% or higher occupancy, suggesting good market fit and guest satisfaction.
- Typical properties (Median) have an occupancy rate around 23%.
- Entry-level properties (Bottom 25%) average 13% occupancy, potentially facing higher vacancy.
Average Monthly Occupancy Rate Trend in West Baden Springs
Average Daily Rate (ADR) Airbnb Trends in West Baden Springs (2025)
Effective short term rental pricing strategy in West Baden Springs involves understanding monthly ADR fluctuations. The Average Daily Rate (ADR) for Airbnb in West Baden Springs typically peaks in October and dips lowest during February. Leveraging Airbnb dynamic pricing tools or strategies based on this seasonality can significantly boost revenue. Here's a look at the typical nightly rates achieved:
- Best-in-class properties (Top 10%) command rates of $779+ per night, often due to premium features or locations.
- Strong performing properties (Top 25%) achieve nightly rates of $283 or more.
- Typical properties (Median) charge around $172 per night.
- Entry-level properties (Bottom 25%) earn around $130 per night.
Average Daily Rate (ADR) Trend by Month in West Baden Springs
Get Live West Baden Springs Market Intelligence 👇

Explore Real-time Analytics
Airbnb Seasonality Analysis & Trends in West Baden Springs (2025)
Peak Season (July, August, June)
- Revenue averages $6,136 per month
- Occupancy rates average 36.4%
- Daily rates average $364
Shoulder Season
- Revenue averages $3,613 per month
- Occupancy maintains around 29.5%
- Daily rates hold near $298
Low Season (January, February, March)
- Revenue drops to average $1,906 per month
- Occupancy decreases to average 24.4%
- Daily rates adjust to average $250
Seasonality Insights for West Baden Springs
- The Airbnb seasonality in West Baden Springs shows highly seasonal trends requiring careful strategy. While the sections above show seasonal averages, it's also insightful to look at the extremes:
- During the high season, the absolute peak month showcases West Baden Springs's highest earning potential, with monthly revenues capable of climbing to $6,945, occupancy reaching a high of 39.5%, and ADRs peaking at $374.
- Conversely, the slowest single month of the year, typically falling within the low season, marks the market's lowest point. In this month, revenue might dip to $1,723, occupancy could drop to 20.2%, and ADRs may adjust down to $244.
- Understanding both the seasonal averages and these monthly peaks and troughs in revenue, occupancy, and ADR is crucial for maximizing your Airbnb profit potential in West Baden Springs.
Seasonal Strategies for Maximizing Profit
- Peak Season: Maximize revenue through premium pricing and potentially longer minimum stays. Ensure high availability.
- Low Season: Offer competitive pricing, special promotions (e.g., extended stay discounts), and flexible cancellation policies. Target off-season travelers like remote workers or budget-conscious guests.
- Shoulder Seasons: Implement dynamic pricing that balances peak and low rates. Target weekend travelers or specific events. Offer slightly more flexible terms than peak season.
- Regularly analyze your own performance against these West Baden Springs seasonality benchmarks and adjust your pricing and availability strategy accordingly.
Best Areas for Airbnb Investment in West Baden Springs (2025)
Exploring the top neighborhoods for short-term rentals in West Baden Springs? This section highlights key areas, outlining why they are attractive for hosts and guests, along with notable local attractions. Consider these locations based on your target guest profile and investment strategy.
| Neighborhood / Area | Why Host Here? (Target Guests & Appeal) | Key Attractions & Landmarks |
|---|---|---|
| West Baden Springs Historic Hotel District | Known for its iconic architecture and historic significance, this area attracts visitors looking for a unique, luxurious experience in a historic setting. It's perfect for tourists wanting to explore the rich history of the area. | West Baden Springs Hotel, French Lick Springs Hotel, Hoosier National Forest, Spa and wellness centers, Golf courses |
| French Lick Resort Area | A popular destination that offers a range of family-friendly activities, from gaming to golfing. The resort is known for its elegant atmosphere, making it ideal for various travelers, including families and couples. | French Lick Casino, French Lick Springs Hotel, Golf courses, Indoor water parks, Historic tours |
| West Baden Springs Golf Club | Attracting golf enthusiasts and families, this area is perfect for those looking to enjoy outdoor activities in a scenic environment. The proximity to beautiful landscapes makes it appealing year-round. | West Baden Springs Golf Club, Golfing packages, Nature trails, Scenic views, Nearby parks |
| Culver Military Academy | A destination for families visiting students or alumni of the academy. The surroundings offer charming landscapes and recreational opportunities, drawing in those looking for a peaceful stay. | Culver Military Academy, Culver Lake, Local parks, Historic buildings, Community events |
| Milan | A quaint town that serves as a peaceful getaway for those looking to escape the bustle of larger cities. Its charm and local culture attract tourists seeking a quiet retreat. | Local boutiques, Milan Town Park, Historic sites, Cultural events, Nearby hiking trails |
| Bloomington | Home to Indiana University, this vibrant city offers cultural attractions and nightlife, appealing to visitors, students, and university events throughout the year. | Indiana University, Bloomington Farmers Market, Art galleries, Nature preserves, Live music venues |
| Indianapolis | The state capital provides a variety of attractions, from sports to arts, making it a bustling location for travelers. It's ideal for those who want to explore the city's dynamic culture. | Indianapolis Motor Speedway, Children's Museum, Indianapolis Zoo, Cultural districts, Live sports events |
| Nashville | Known for its music scene and cultural richness, Nashville attracts tourists from all over the world and offers diverse entertainment options, making it a lucrative investment location for Airbnb hosts. | Country Music Hall of Fame, Live music venues, Nashville Parthenon, Cultural festivals, Historic neighborhoods |
Understanding Airbnb License Requirements & STR Laws in West Baden Springs (2025)
While West Baden Springs, Indiana, United States currently shows low STR regulations, specific Airbnb license requirements might still exist or change. Always verify the latest short term rental regulations and Airbnb license requirements directly with local government authorities for West Baden Springs to ensure full compliance before hosting.
(Source: AirROI data, 2025, finding no licensed listings among those analyzed)
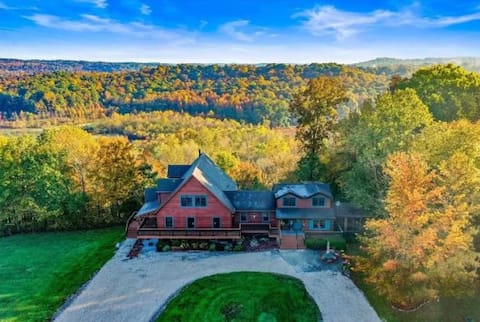
Top Performing Airbnb Properties in West Baden Springs (2025)
Benchmark your potential! Explore examples of top-performing Airbnb properties in West Baden Springsbased on Trailing Twelve Month (TTM) revenue. Analyze their characteristics, revenue, occupancy rate, and ADR to understand what drives success in this market.

Gorgeous estate formerly owned by NBA legend
Entire Place • 6 bedrooms
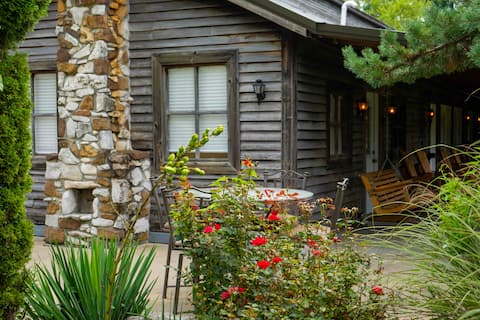
Lost River Lodge Rustic Cozy Families & Groups
Entire Place • 6 bedrooms
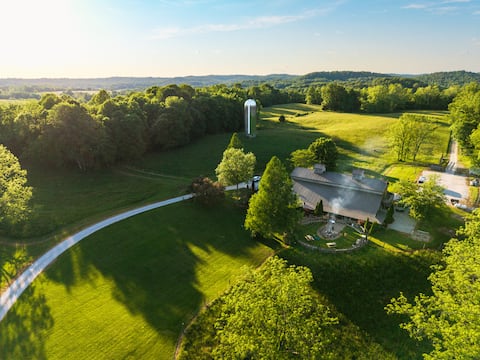
French Lick Farms: 7BR w/Hot Tub, Pond & Firepit
Entire Place • 7 bedrooms
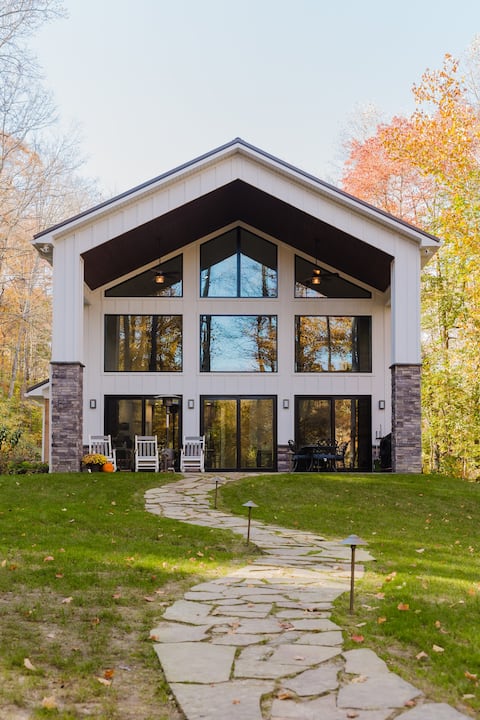
Private Lakehouse getaway with all modern comforts
Entire Place • 3 bedrooms

Dome View Renovated Bungalow
Entire Place • 2 bedrooms
Cabin stay w/2 Q on 80 acres | Hot Tub & No Fees
Entire Place • 1 bedroom
Note: Performance varies based on location, size, amenities, seasonality, and management quality. Data reflects the past 12 months.
Top Performing Airbnb Hosts in West Baden Springs (2025)
Learn from the best! This table showcases top-performing Airbnb hosts in West Baden Springs based on the number of properties managed and estimated total revenue over the past year. Analyze their scale and performance metrics.
| Host Name | Properties | Grossing Revenue | Stay Reviews | Avg Rating |
|---|---|---|---|---|
| Sherry | 4 | $151,947 | 75 | 4.91/5.0 |
| Jason | 1 | $141,824 | 40 | 4.88/5.0 |
| Stacy | 1 | $107,073 | 31 | 5.00/5.0 |
| Jason | 1 | $90,399 | 68 | 5.00/5.0 |
| Geoffrey J | 1 | $33,721 | 109 | 4.90/5.0 |
| Scott | 5 | $33,714 | 157 | 4.47/5.0 |
| Jane | 1 | $18,249 | 177 | 4.92/5.0 |
| Rebecca | 2 | $13,788 | 98 | 4.99/5.0 |
| Pat | 1 | $8,673 | 9 | 4.78/5.0 |
| Randy | 3 | $2,291 | 26 | 5.00/5.0 |
Analyzing the strategies of top hosts, such as their property selection, pricing, and guest communication, can offer valuable lessons for optimizing your own Airbnb operations in West Baden Springs.
Dive Deeper: Advanced West Baden Springs STR Market Data (2025)
Ready to unlock more insights? AirROI provides access to advanced metrics and comprehensive Airbnb data for West Baden Springs. Explore detailed analytics beyond this report to refine your investment strategy, optimize pricing, and maximize your vacation rental profits.
Explore Advanced MetricsWest Baden Springs Short-Term Rental Market Composition (2025): Property & Room Types
Room Type Distribution
Property Type Distribution
Market Composition Insights for West Baden Springs
- The West Baden Springs Airbnb market composition is heavily skewed towards Entire Home/Apt listings, which make up 100% of the 20 active rentals. This indicates strong guest preference for privacy and space.
- Looking at the property type distribution in West Baden Springs, Outdoor/Unique properties are the most common (40%), reflecting the local real estate landscape.
- Houses represent a significant 30% portion, catering likely to families or larger groups.
West Baden Springs Airbnb Room Capacity Analysis (2025): Bedroom Distribution
Distribution of Listings by Number of Bedrooms
Room Capacity Insights for West Baden Springs
- The dominant room capacity in West Baden Springs is 1 bedroom listings, making up 45% of the market. This suggests a strong demand for properties suitable for couples or solo travelers.
- Together, 1 bedroom and 2 bedrooms properties represent 70.0% of the active Airbnb listings in West Baden Springs, indicating a high concentration in these sizes.
- A significant 25.0% of listings offer 3+ bedrooms, catering to larger groups and families seeking more space in West Baden Springs.
West Baden Springs Vacation Rental Guest Capacity Trends (2025)
Distribution of Listings by Guest Capacity
Guest Capacity Insights for West Baden Springs
- The most common guest capacity trend in West Baden Springs vacation rentals is listings accommodating 2 guests (30%). This suggests the primary traveler segment is likely couples or solo travelers.
- Properties designed for 2 guests and 4 guests dominate the West Baden Springs STR market, accounting for 55.0% of listings.
- 35.0% of properties accommodate 6+ guests, serving the market segment for larger families or group travel in West Baden Springs.
- On average, properties in West Baden Springs are equipped to host 4.6 guests.
West Baden Springs Airbnb Booking Patterns (2025): Available vs. Booked Days
Available Days Distribution
Booked Days Distribution
Booking Pattern Insights for West Baden Springs
- The most common availability pattern in West Baden Springs falls within the 271-366 days range, representing 80% of listings. This suggests many properties have significant open periods on their calendars.
- Approximately 95.0% of listings show high availability (181+ days open annually), indicating potential for increased bookings or specific owner usage patterns.
- For booked days, the 31-90 days range is most frequent in West Baden Springs (60%), reflecting common guest stay durations or potential owner blocking patterns.
- A notable 5.0% of properties secure long booking periods (181+ days booked per year), highlighting successful long-term rental strategies or significant owner usage.
West Baden Springs Airbnb Minimum Stay Requirements Analysis
Distribution of Listings by Minimum Night Requirement
1 Night
8 listings
40% of total
2 Nights
8 listings
40% of total
30+ Nights
4 listings
20% of total
Key Insights
- The most prevalent minimum stay requirement in West Baden Springs is 1 Night, adopted by 40% of listings. This highlights the market's preference for shorter, flexible bookings.
- A strong majority (80.0%) of the West Baden Springs Airbnb data shows acceptance of very short stays (1-2 nights), indicating a dynamic, high-turnover market.
- A significant segment (20%) caters to monthly stays (30+ nights) in West Baden Springs, pointing to opportunities in the extended-stay market.
Recommendations
- Align with the market by considering a 1 Night minimum stay, as 40% of West Baden Springs hosts use this setting.
- Explore offering discounts for stays of 30+ nights to attract the 20% of the market seeking extended stays.
- Adjust minimum nights based on seasonality – potentially shorter during low season and longer during peak demand periods in West Baden Springs.
West Baden Springs Airbnb Cancellation Policy Trends Analysis (2025)
Limited
1 listings
5% of total
Flexible
6 listings
30% of total
Moderate
1 listings
5% of total
Firm
11 listings
55% of total
Strict
1 listings
5% of total
Cancellation Policy Insights for West Baden Springs
- The prevailing Airbnb cancellation policy trend in West Baden Springs is Firm, used by 55% of listings.
- A majority (60.0%) of hosts in West Baden Springs utilize Firm or Strict policies, indicating a market where hosts prioritize booking security.
- Strict cancellation policies are quite rare (5%), potentially making listings with this policy less competitive unless justified by high demand or property type.
Recommendations for Hosts
- Consider adopting a Firm policy to align with the 55% market standard in West Baden Springs.
- Using a Strict policy might deter some guests, as only 5% of listings use it. Evaluate if potential revenue protection outweighs possible lower booking rates.
- Regularly review your cancellation policy against competitors and market demand shifts in West Baden Springs.
West Baden Springs STR Booking Lead Time Analysis (2025)
Average Booking Lead Time by Month
Booking Lead Time Insights for West Baden Springs
- The overall average booking lead time for vacation rentals in West Baden Springs is 74 days.
- Guests book furthest in advance for stays during May (average 117 days), likely coinciding with peak travel demand or local events.
- The shortest booking windows occur for stays in February (average 23 days), indicating more last-minute travel plans during this time.
- Seasonally, Summer (88 days avg.) sees the longest lead times, while Winter (49 days avg.) has the shortest, reflecting typical travel planning cycles.
Recommendations for Hosts
- Use the overall average lead time (74 days) as a baseline for your pricing and availability strategy in West Baden Springs.
- For May stays, consider implementing length-of-stay discounts or slightly higher rates for bookings made less than 117 days out to capitalize on advance planning.
- Target marketing efforts for the Summer season well in advance (at least 88 days) to capture early planners.
- Monitor your own booking lead times against these West Baden Springs averages to identify opportunities for dynamic pricing adjustments.
Popular & Essential Airbnb Amenities in West Baden Springs (2025)
Amenity Prevalence
Amenity Insights for West Baden Springs
- Essential amenities in West Baden Springs that guests expect include: Kitchen. Lacking these (this) could significantly impact bookings.
- Popular amenities like Free parking on premises, Refrigerator, Air conditioning are common but not universal. Offering these can provide a competitive edge.
- Warning: Wifi is not universally provided but is considered essential globally. Ensure reliable Wifi is offered.
Recommendations for Hosts
- Ensure your listing includes all essential amenities for West Baden Springs: Kitchen.
- Consider adding popular differentiators like Free parking on premises or Refrigerator to increase appeal.
- Highlight unique or less common amenities you offer (e.g., hot tub, dedicated workspace, EV charger) in your listing description and photos.
- Regularly check competitor amenities in West Baden Springs to stay competitive.
West Baden Springs Airbnb Guest Demographics & Profile Analysis (2025)
Guest Profile Summary for West Baden Springs
- The typical guest profile for Airbnb in West Baden Springs consists of primarily domestic travelers (99%), often arriving from nearby Indianapolis, typically belonging to the Post-2000s (Gen Z/Alpha) group (50%), primarily speaking English or German.
- Domestic travelers account for 99.0% of guests.
- Key international markets include United States (99%) and Brazil (1%).
- Top languages spoken are English (78.6%) followed by German (7.1%).
- A significant demographic segment is the Post-2000s (Gen Z/Alpha) group, representing 50% of guests.
Recommendations for Hosts
- Target domestic marketing efforts towards travelers from Indianapolis and Cincinnati.
- Tailor amenities and listing descriptions to appeal to the dominant Post-2000s (Gen Z/Alpha) demographic (e.g., highlight fast WiFi, smart home features, local guides).
- Highlight unique local experiences or amenities relevant to the primary guest profile.
- Consider seasonal promotions aligned with peak travel times for key origin markets.
Nearby Short-Term Rental Market Comparison
How does the West Baden Springs Airbnb market stack up against its neighbors? Compare key performance metrics like average monthly revenue, ADR, and occupancy rates in surrounding areas to understand the broader regional STR landscape.
| Market | Active Properties | Monthly Revenue | Daily Rate | Avg. Occupancy |
|---|---|---|---|---|
| Bee Spring | 11 | $4,235 | $489.57 | 39% |
| Simpsonville | 20 | $3,679 | $336.33 | 43% |
| Unionville | 20 | $3,660 | $400.88 | 42% |
| Bloomfield | 12 | $3,648 | $405.85 | 32% |
| Cub Run | 26 | $3,633 | $295.96 | 46% |
| Shelbyville | 76 | $3,375 | $356.57 | 38% |
| Nashville | 245 | $3,307 | $296.38 | 40% |
| La Grange | 24 | $3,268 | $354.18 | 37% |
| Zionsville | 23 | $3,224 | $317.86 | 45% |
| Crestwood | 18 | $3,016 | $617.11 | 34% |