Wabash Airbnb Market Analysis 2026: Short Term Rental Data & Vacation Rental Statistics in Indiana, United States
Is Airbnb profitable in Wabash in 2026? Explore comprehensive Airbnb analytics for Wabash, Indiana, United States to uncover income potential. This 2026 STR market report for Wabash, based on AirROI data from February 2025 to January 2026, reveals key trends in the niche market of 31 active listings.
Whether you're considering an Airbnb investment in Wabash, optimizing your existing vacation rental, or exploring rental arbitrage opportunities, understanding the Wabash Airbnb data is crucial. Leveraging the low regulation environment is key to maximizing your short term rental income potential. Let's dive into the specifics.
Key Wabash Airbnb Performance Metrics Overview
Monthly Airbnb Revenue Variations & Income Potential in Wabash (2026)
Understanding the monthly revenue variations for Airbnb listings in Wabash is key to maximizing your short term rental income potential. Seasonality significantly impacts earnings. Our analysis, based on data from the past 12 months, shows that the peak revenue month for STRs in Wabash is typically August, while May often presents the lowest earnings, highlighting opportunities for strategic pricing adjustments during shoulder and low seasons. Explore the typical Airbnb income in Wabash across different performance tiers:
- Best-in-class properties (Top 10%) achieve $4,012+ monthly, often utilizing dynamic pricing and superior guest experiences.
- Strong performing properties (Top 25%) earn $2,442 or more, indicating effective management and desirable locations/amenities.
- Typical properties (Median) generate around $1,575 per month, representing the average market performance.
- Entry-level properties (Bottom 25%) see earnings around $822, often with potential for optimization.
Average Monthly Airbnb Earnings Trend in Wabash
Wabash Airbnb Occupancy Rate Trends (2026)
Maximize your bookings by understanding the Wabash STR occupancy trends. Seasonal demand shifts significantly influence how often properties are booked. Typically, Julysees the highest demand (peak season occupancy), while January experiences the lowest (low season). Effective strategies, like adjusting minimum stays or offering promotions, can boost occupancy during slower periods. Here's how different property tiers perform in Wabash:
- Best-in-class properties (Top 10%) achieve 74%+ occupancy, indicating high desirability and potentially optimized availability.
- Strong performing properties (Top 25%) maintain 62% or higher occupancy, suggesting good market fit and guest satisfaction.
- Typical properties (Median) have an occupancy rate around 42%.
- Entry-level properties (Bottom 25%) average 23% occupancy, potentially facing higher vacancy.
Average Monthly Occupancy Rate Trend in Wabash
Average Daily Rate (ADR) Airbnb Trends in Wabash (2026)
Effective short term rental pricing strategy in Wabash involves understanding monthly ADR fluctuations. The Average Daily Rate (ADR) for Airbnb in Wabash typically peaks in January and dips lowest during March. Leveraging Airbnb dynamic pricing tools or strategies based on this seasonality can significantly boost revenue. Here's a look at the typical nightly rates achieved:
- Best-in-class properties (Top 10%) command rates of $259+ per night, often due to premium features or locations.
- Strong performing properties (Top 25%) achieve nightly rates of $139 or more.
- Typical properties (Median) charge around $89 per night.
- Entry-level properties (Bottom 25%) earn around $68 per night.
Average Daily Rate (ADR) Trend by Month in Wabash
Get Live Wabash Market Intelligence 👇

Explore Real-time Analytics
Airbnb Seasonality Analysis & Trends in Wabash (2026)
Peak Season (August, July, October)
- Revenue averages $2,550 per month
- Occupancy rates average 56.4%
- Daily rates average $132
Shoulder Season
- Revenue averages $1,976 per month
- Occupancy maintains around 42.5%
- Daily rates hold near $130
Low Season (January, February, May)
- Revenue drops to average $1,663 per month
- Occupancy decreases to average 34.0%
- Daily rates adjust to average $130
Seasonality Insights for Wabash
- The Airbnb seasonality in Wabash shows moderate seasonality with distinct peak and low periods. While the sections above show seasonal averages, it's also insightful to look at the extremes:
- During the high season, the absolute peak month showcases Wabash's highest earning potential, with monthly revenues capable of climbing to $2,639, occupancy reaching a high of 65.5%, and ADRs peaking at $140.
- Conversely, the slowest single month of the year, typically falling within the low season, marks the market's lowest point. In this month, revenue might dip to $1,643, occupancy could drop to 26.4%, and ADRs may adjust down to $121.
- Understanding both the seasonal averages and these monthly peaks and troughs in revenue, occupancy, and ADR is crucial for maximizing your Airbnb profit potential in Wabash.
Seasonal Strategies for Maximizing Profit
- Peak Season: Maximize revenue through premium pricing and potentially longer minimum stays. Ensure high availability.
- Low Season: Offer competitive pricing, special promotions (e.g., extended stay discounts), and flexible cancellation policies. Target off-season travelers like remote workers or budget-conscious guests.
- Shoulder Seasons: Implement dynamic pricing that balances peak and low rates. Target weekend travelers or specific events. Offer slightly more flexible terms than peak season.
- Regularly analyze your own performance against these Wabash seasonality benchmarks and adjust your pricing and availability strategy accordingly.
Best Areas for Airbnb Investment in Wabash (2026)
Exploring the top neighborhoods for short-term rentals in Wabash? This section highlights key areas, outlining why they are attractive for hosts and guests, along with notable local attractions. Consider these locations based on your target guest profile and investment strategy.
| Neighborhood / Area | Why Host Here? (Target Guests & Appeal) | Key Attractions & Landmarks |
|---|---|---|
| Downtown Wabash | The heart of Wabash, featuring local businesses, restaurants, and historic sites. Ideal for guests wanting to explore the town's unique charm and culture. | Wabash County Historical Museum, Eagles Theatre, Charley Creek Gardens, Wabash Marketplace, The Connection |
| Mona Lake | A serene area perfect for families and outdoor enthusiasts. Offers recreational activities such as fishing and boating, appealing to visitors seeking nature-based experiences. | Mona Lake, Parks with family-friendly amenities, Walking trails, Fishing spots |
| Wabash River Walk | A scenic walk along the river that attracts both local residents and visitors. Great for those looking to relax and enjoy picturesque views and outdoor activities. | Wabash River Greenway, Picnic areas, Walking and biking paths, Public art installations |
| North Wabash | A residential area that offers easy access to parks and family-friendly activities. Suitable for hosting families visiting for events or vacations. | Local parks, Community events, Family attractions |
| South Wabash | Known for its quaint neighborhood charm and friendly atmosphere. Great for those looking to experience a quieter side of the town. | Community parks, Neighborhood festivals, Local eateries |
| Wabash County Fairgrounds | Hosts various events and festivals throughout the year, making it a prime location for guests attending these gatherings. | Wabash County Fair, Concerts and events, Local farmer's market |
| Historical District | Showcases Wabash’s rich history with beautiful architecture and historical sites. Attractive for history buffs and tourists interested in local heritage. | Historic buildings, Museum tours, Walking tours |
| Local Vineyards | In the countryside near Wabash, popular with visitors looking to explore the local winemaking culture and enjoy scenic views. | Wine tastings, Vineyard tours, Outdoor events |
Understanding Airbnb License Requirements & STR Laws in Wabash (2026)
While Wabash, Indiana, United States currently shows low STR regulations, specific Airbnb license requirements might still exist or change. Always verify the latest short term rental regulations and Airbnb license requirements directly with local government authorities for Wabash to ensure full compliance before hosting.
(Source: AirROI data, 2026, finding no licensed listings among those analyzed)
Top Performing Airbnb Properties in Wabash (2026)
Benchmark your potential! Explore examples of top-performing Airbnb properties in Wabashbased on Trailing Twelve Month (TTM) revenue. Analyze their characteristics, revenue, occupancy rate, and ADR to understand what drives success in this market.
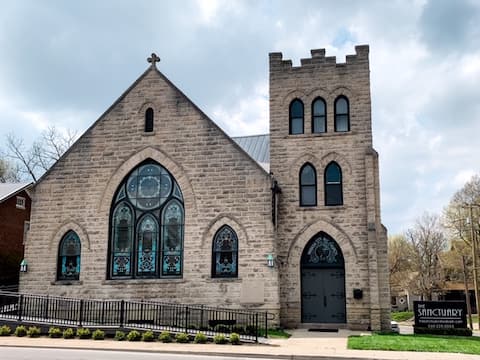
The Sanctuary"Full Facility" Close to DT Sleeps 18
Entire Place • 7 bedrooms
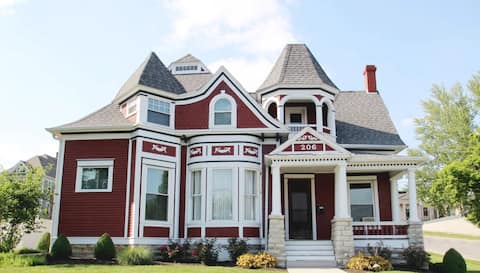
The Clarkson House - large historic home
Entire Place • 5 bedrooms
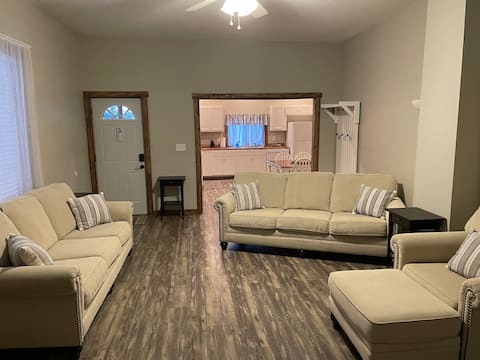
Spacious 3BR Downtown Farmhouse • Walk Anywhere
Entire Place • 3 bedrooms
K & M Suite
Private Room • 3 bedrooms

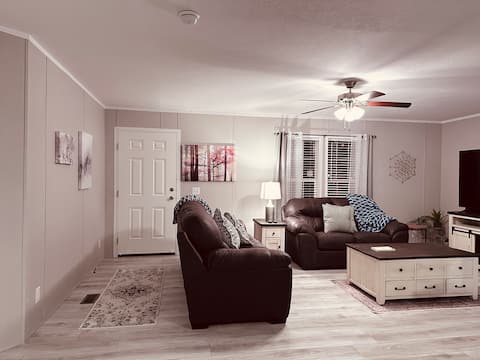
Cozy, fully renovated Wabash Cottage!
Entire Place • 2 bedrooms

The Miller Home - A Central Location
Entire Place • 2 bedrooms
Note: Performance varies based on location, size, amenities, seasonality, and management quality. Data reflects the past 12 months.
Top Performing Airbnb Hosts in Wabash (2026)
Learn from the best! This table showcases top-performing Airbnb hosts in Wabash based on the number of properties managed and estimated total revenue over the past year. Analyze their scale and performance metrics.
| Host Name | Properties | Grossing Revenue | Stay Reviews | Avg Rating |
|---|---|---|---|---|
| Jennifer | 3 | $122,653 | 138 | 4.93/5.0 |
| Kyle & Aubrey | 3 | $65,602 | 618 | 4.91/5.0 |
| Philip | 1 | $60,484 | 49 | 4.88/5.0 |
| Katlia | 4 | $56,356 | 66 | 4.89/5.0 |
| Ann | 2 | $47,315 | 154 | 4.96/5.0 |
| Jewell | 3 | $33,936 | 62 | 4.98/5.0 |
| Keishia | 5 | $30,861 | 101 | 4.90/5.0 |
| Beverly | 1 | $26,374 | 180 | 4.98/5.0 |
| Suzie | 3 | $15,697 | 60 | 4.95/5.0 |
| Mitch | 1 | $5,834 | 33 | 4.91/5.0 |
Analyzing the strategies of top hosts, such as their property selection, pricing, and guest communication, can offer valuable lessons for optimizing your own Airbnb operations in Wabash.
Dive Deeper: Advanced Wabash STR Market Data (2026)
Ready to unlock more insights? AirROI provides access to advanced metrics and comprehensive Airbnb data for Wabash. Explore detailed analytics beyond this report to refine your investment strategy, optimize pricing, and maximize your vacation rental profits.
Explore Advanced MetricsWabash Short-Term Rental Market Composition (2026): Property & Room Types
Room Type Distribution
Property Type Distribution
Market Composition Insights for Wabash
- The Wabash Airbnb market composition is heavily skewed towards Entire Home/Apt listings, which make up 90.3% of the 31 active rentals. This indicates strong guest preference for privacy and space.
- Looking at the property type distribution in Wabash, Apartment/Condo properties are the most common (54.8%), reflecting the local real estate landscape.
- Houses represent a significant 35.5% portion, catering likely to families or larger groups.
Wabash Airbnb Room Capacity Analysis (2026): Bedroom Distribution
Distribution of Listings by Number of Bedrooms
Room Capacity Insights for Wabash
- The dominant room capacity in Wabash is 2 bedrooms listings, making up 38.7% of the market. This suggests a strong demand for properties suitable for couples or solo travelers.
- Together, 2 bedrooms and 1 bedroom properties represent 74.2% of the active Airbnb listings in Wabash, indicating a high concentration in these sizes.
- A significant 22.6% of listings offer 3+ bedrooms, catering to larger groups and families seeking more space in Wabash.
Wabash Vacation Rental Guest Capacity Trends (2026)
Distribution of Listings by Guest Capacity
Guest Capacity Insights for Wabash
- The most common guest capacity trend in Wabash vacation rentals is listings accommodating 4 guests (38.7%). This suggests the primary traveler segment is likely small families or groups.
- Properties designed for 4 guests and 2 guests dominate the Wabash STR market, accounting for 61.3% of listings.
- 19.4% of properties accommodate 6+ guests, serving the market segment for larger families or group travel in Wabash.
- On average, properties in Wabash are equipped to host 4.0 guests.
Wabash Airbnb Booking Patterns (2026): Available vs. Booked Days
Available Days Distribution
Booked Days Distribution
Booking Pattern Insights for Wabash
- The most common availability pattern in Wabash falls within the 271-366 days range, representing 48.4% of listings. This suggests many properties have significant open periods on their calendars.
- Approximately 74.2% of listings show high availability (181+ days open annually), indicating potential for increased bookings or specific owner usage patterns.
- For booked days, the 181-270 days range is most frequent in Wabash (29%), reflecting common guest stay durations or potential owner blocking patterns.
- A notable 29.0% of properties secure long booking periods (181+ days booked per year), highlighting successful long-term rental strategies or significant owner usage.
Wabash Airbnb Minimum Stay Requirements Analysis
Distribution of Listings by Minimum Night Requirement
1 Night
13 listings
41.9% of total
2 Nights
3 listings
9.7% of total
7-29 Nights
5 listings
16.1% of total
30+ Nights
10 listings
32.3% of total
Key Insights
- The most prevalent minimum stay requirement in Wabash is 1 Night, adopted by 41.9% of listings. This highlights the market's preference for shorter, flexible bookings.
- A significant segment (32.3%) caters to monthly stays (30+ nights) in Wabash, pointing to opportunities in the extended-stay market.
Recommendations
- Align with the market by considering a 1 Night minimum stay, as 41.9% of Wabash hosts use this setting.
- Explore offering discounts for stays of 30+ nights to attract the 32.3% of the market seeking extended stays.
- Adjust minimum nights based on seasonality – potentially shorter during low season and longer during peak demand periods in Wabash.
Wabash Airbnb Cancellation Policy Trends Analysis (2026)
Limited
1 listings
3.2% of total
Flexible
8 listings
25.8% of total
Moderate
9 listings
29% of total
Firm
4 listings
12.9% of total
Strict
9 listings
29% of total
Cancellation Policy Insights for Wabash
- The prevailing Airbnb cancellation policy trend in Wabash is Moderate, used by 29% of listings.
- There's a relatively balanced mix between guest-friendly (54.8%) and stricter (41.9%) policies, offering choices for different guest needs.
Recommendations for Hosts
- Consider adopting a Moderate policy to align with the 29% market standard in Wabash.
- Regularly review your cancellation policy against competitors and market demand shifts in Wabash.
Wabash STR Booking Lead Time Analysis (2026)
Average Booking Lead Time by Month
Booking Lead Time Insights for Wabash
- The overall average booking lead time for vacation rentals in Wabash is 47 days.
- Guests book furthest in advance for stays during November (average 76 days), likely coinciding with peak travel demand or local events.
- The shortest booking windows occur for stays in December (average 19 days), indicating more last-minute travel plans during this time.
- Seasonally, Fall (68 days avg.) sees the longest lead times, while Winter (26 days avg.) has the shortest, reflecting typical travel planning cycles.
Recommendations for Hosts
- Use the overall average lead time (47 days) as a baseline for your pricing and availability strategy in Wabash.
- For November stays, consider implementing length-of-stay discounts or slightly higher rates for bookings made less than 76 days out to capitalize on advance planning.
- Target marketing efforts for the Fall season well in advance (at least 68 days) to capture early planners.
- Monitor your own booking lead times against these Wabash averages to identify opportunities for dynamic pricing adjustments.
Popular & Essential Airbnb Amenities in Wabash (2026)
Amenity Prevalence
Amenity Insights for Wabash
- Essential amenities in Wabash that guests expect include: Air conditioning, Wifi, Smoke alarm. Lacking these (any) could significantly impact bookings.
- Popular amenities like TV, Heating, Cooking basics are common but not universal. Offering these can provide a competitive edge.
Recommendations for Hosts
- Ensure your listing includes all essential amenities for Wabash: Air conditioning, Wifi, Smoke alarm.
- Prioritize adding missing essentials: Smoke alarm.
- Consider adding popular differentiators like TV or Heating to increase appeal.
- Highlight unique or less common amenities you offer (e.g., hot tub, dedicated workspace, EV charger) in your listing description and photos.
- Regularly check competitor amenities in Wabash to stay competitive.
Wabash Airbnb Guest Demographics & Profile Analysis (2026)
Guest Profile Summary for Wabash
- The typical guest profile for Airbnb in Wabash consists of primarily domestic travelers (98%), often arriving from nearby Columbus, typically belonging to the Post-2000s (Gen Z/Alpha) group (50%), primarily speaking English or Spanish.
- Domestic travelers account for 98.1% of guests.
- Key international markets include United States (98.1%) and Germany (0.6%).
- Top languages spoken are English (70.9%) followed by Spanish (11.6%).
- A significant demographic segment is the Post-2000s (Gen Z/Alpha) group, representing 50% of guests.
Recommendations for Hosts
- Target domestic marketing efforts towards travelers from Columbus and Bloomington.
- Tailor amenities and listing descriptions to appeal to the dominant Post-2000s (Gen Z/Alpha) demographic (e.g., highlight fast WiFi, smart home features, local guides).
- Highlight unique local experiences or amenities relevant to the primary guest profile.
- Consider seasonal promotions aligned with peak travel times for key origin markets.
Nearby Short-Term Rental Market Comparison
How does the Wabash Airbnb market stack up against its neighbors? Compare key performance metrics like average monthly revenue, ADR, and occupancy rates in surrounding areas to understand the broader regional STR landscape.
| Market | Active Properties | Monthly Revenue | Daily Rate | Avg. Occupancy |
|---|---|---|---|---|
| New Buffalo Township | 260 | $5,145 | $633.18 | 36% |
| Bertrand Township | 22 | $5,011 | $365.69 | 40% |
| Union Pier | 16 | $4,998 | $659.10 | 36% |
| Fremont | 16 | $4,898 | $436.31 | 42% |
| New Buffalo | 151 | $4,797 | $484.51 | 40% |
| Chikaming Township | 299 | $4,503 | $519.62 | 38% |
| White Pigeon Township | 10 | $4,264 | $312.31 | 50% |
| Lake Charter Township | 70 | $4,231 | $467.42 | 44% |
| LaGrange Township | 10 | $4,158 | $451.30 | 46% |
| Berrien Township | 18 | $4,155 | $354.84 | 43% |