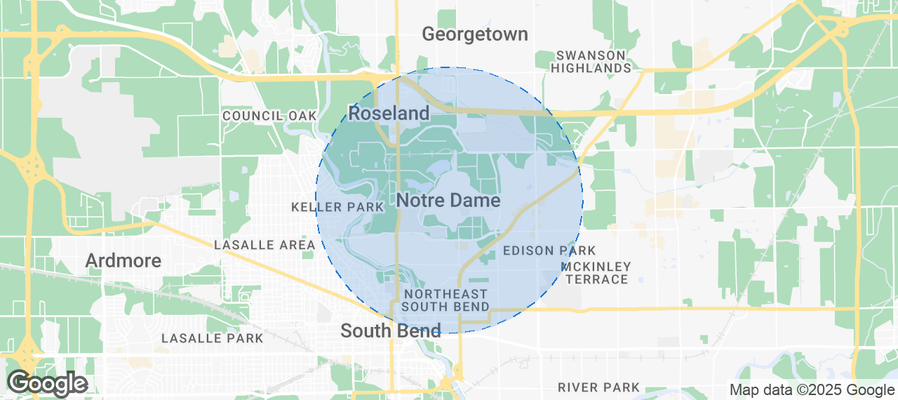
Notre Dame Airbnb Market Analysis 2026: Short Term Rental Data & Vacation Rental Statistics in Indiana, United States
Is Airbnb profitable in Notre Dame in 2026? Explore comprehensive Airbnb analytics for Notre Dame, Indiana, United States to uncover income potential. This 2026 STR market report for Notre Dame, based on AirROI data from February 2025 to January 2026, reveals key trends in the niche market of 59 active listings.
Whether you're considering an Airbnb investment in Notre Dame, optimizing your existing vacation rental, or exploring rental arbitrage opportunities, understanding the Notre Dame Airbnb data is crucial. Leveraging the low regulation environment is key to maximizing your short term rental income potential. Let's dive into the specifics.
Key Notre Dame Airbnb Performance Metrics Overview
Monthly Airbnb Revenue Variations & Income Potential in Notre Dame (2026)
Understanding the monthly revenue variations for Airbnb listings in Notre Dame is key to maximizing your short term rental income potential. Seasonality significantly impacts earnings. Our analysis, based on data from the past 12 months, shows that the peak revenue month for STRs in Notre Dame is typically August, while January often presents the lowest earnings, highlighting opportunities for strategic pricing adjustments during shoulder and low seasons. Explore the typical Airbnb income in Notre Dame across different performance tiers:
- Best-in-class properties (Top 10%) achieve $11,110+ monthly, often utilizing dynamic pricing and superior guest experiences.
- Strong performing properties (Top 25%) earn $5,896 or more, indicating effective management and desirable locations/amenities.
- Typical properties (Median) generate around $2,833 per month, representing the average market performance.
- Entry-level properties (Bottom 25%) see earnings around $1,609, often with potential for optimization.
Average Monthly Airbnb Earnings Trend in Notre Dame
Notre Dame Airbnb Occupancy Rate Trends (2026)
Maximize your bookings by understanding the Notre Dame STR occupancy trends. Seasonal demand shifts significantly influence how often properties are booked. Typically, Augustsees the highest demand (peak season occupancy), while January experiences the lowest (low season). Effective strategies, like adjusting minimum stays or offering promotions, can boost occupancy during slower periods. Here's how different property tiers perform in Notre Dame:
- Best-in-class properties (Top 10%) achieve 76%+ occupancy, indicating high desirability and potentially optimized availability.
- Strong performing properties (Top 25%) maintain 50% or higher occupancy, suggesting good market fit and guest satisfaction.
- Typical properties (Median) have an occupancy rate around 29%.
- Entry-level properties (Bottom 25%) average 17% occupancy, potentially facing higher vacancy.
Average Monthly Occupancy Rate Trend in Notre Dame
Average Daily Rate (ADR) Airbnb Trends in Notre Dame (2026)
Effective short term rental pricing strategy in Notre Dame involves understanding monthly ADR fluctuations. The Average Daily Rate (ADR) for Airbnb in Notre Dame typically peaks in October and dips lowest during March. Leveraging Airbnb dynamic pricing tools or strategies based on this seasonality can significantly boost revenue. Here's a look at the typical nightly rates achieved:
- Best-in-class properties (Top 10%) command rates of $960+ per night, often due to premium features or locations.
- Strong performing properties (Top 25%) achieve nightly rates of $580 or more.
- Typical properties (Median) charge around $319 per night.
- Entry-level properties (Bottom 25%) earn around $222 per night.
Average Daily Rate (ADR) Trend by Month in Notre Dame
Get Live Notre Dame Market Intelligence 👇
Explore Real-time Analytics
Airbnb Seasonality Analysis & Trends in Notre Dame (2026)
Peak Season (August, October, September)
- Revenue averages $7,672 per month
- Occupancy rates average 42.3%
- Daily rates average $541
Shoulder Season
- Revenue averages $4,805 per month
- Occupancy maintains around 36.6%
- Daily rates hold near $486
Low Season (January, February, March)
- Revenue drops to average $2,413 per month
- Occupancy decreases to average 28.2%
- Daily rates adjust to average $453
Seasonality Insights for Notre Dame
- The Airbnb seasonality in Notre Dame shows highly seasonal trends requiring careful strategy. While the sections above show seasonal averages, it's also insightful to look at the extremes:
- During the high season, the absolute peak month showcases Notre Dame's highest earning potential, with monthly revenues capable of climbing to $8,587, occupancy reaching a high of 50.0%, and ADRs peaking at $609.
- Conversely, the slowest single month of the year, typically falling within the low season, marks the market's lowest point. In this month, revenue might dip to $1,632, occupancy could drop to 23.2%, and ADRs may adjust down to $412.
- Understanding both the seasonal averages and these monthly peaks and troughs in revenue, occupancy, and ADR is crucial for maximizing your Airbnb profit potential in Notre Dame.
Seasonal Strategies for Maximizing Profit
- Peak Season: Maximize revenue through premium pricing and potentially longer minimum stays. Ensure high availability.
- Low Season: Offer competitive pricing, special promotions (e.g., extended stay discounts), and flexible cancellation policies. Target off-season travelers like remote workers or budget-conscious guests.
- Shoulder Seasons: Implement dynamic pricing that balances peak and low rates. Target weekend travelers or specific events. Offer slightly more flexible terms than peak season.
- Regularly analyze your own performance against these Notre Dame seasonality benchmarks and adjust your pricing and availability strategy accordingly.
Best Areas for Airbnb Investment in Notre Dame (2026)
Exploring the top neighborhoods for short-term rentals in Notre Dame? This section highlights key areas, outlining why they are attractive for hosts and guests, along with notable local attractions. Consider these locations based on your target guest profile and investment strategy.
| Neighborhood / Area | Why Host Here? (Target Guests & Appeal) | Key Attractions & Landmarks |
|---|---|---|
| South Bend Historic District | A charming area filled with well-preserved architecture and historic landmarks, attracting both tourists and visitors to the University of Notre Dame. | University of Notre Dame, Basilica of the Sacred Heart, The Snite Museum of Art, Leeper Park, Studebaker National Museum |
| Downtown South Bend | The vibrant heart of South Bend, featuring shops, restaurants, and entertainment options. It's a popular spot for visitors looking for urban experiences and nightlife. | Four Winds Field, South Bend Museum of Art, The History Museum, The Marketplace Shopping Center, Broadway Theatre |
| Near Notre Dame Campus | Ideal for families and alumni visiting the University, this area offers easy access to campus events and attractions. | Notre Dame Stadium, Touchdown Jesus, The Joyce Center, The Compton Family Ice Arena, Jordan Hall of Science |
| Mishawaka Riverwalk | A scenic area along the St. Joseph River, perfect for outdoor enthusiasts and those enjoying leisurely strolls, restaurants, and parks. | Bettye Roe Park, Central Park, Mishawaka Riverwalk, The Kamm Island Park, The Mishawaka Public Library |
| Cascades Park | A peaceful suburban area known for its greenery, parks, and family-friendly atmosphere, attracting visitors looking for a quiet getaway. | Cascades Park, Potawatomi Zoo, Rum Village Park, The Northside Neighborhood, Scorpio Park |
| Ironwood Tap Root | A popular residential area close to restaurants and shopping, appealing to both short-term and long-term visitors seeking comfort and convenience. | Ironwood Golf Course, Shopping options along Ironwood Rd, Dining at local favorites, Nearby parks, Convenience to major roads and highways |
| West Side | A diverse neighborhood with a mix of cultures, offering unique local dining and experiences, ideal for travelers looking for a true South Bend experience. | West Side Park, Local eateries, Cultural events, Community festivals, Shopping locally |
| Granger Suburbs | A suburban area known for its family-friendly environment and proximity to South Bend attractions, great for families and larger groups. | Breyer Park, The Granger Commons, Dining options, Local boutiques, Quiet residential neighborhoods |
Understanding Airbnb License Requirements & STR Laws in Notre Dame (2026)
While Notre Dame, Indiana, United States currently shows low STR regulations, specific Airbnb license requirements might still exist or change. Always verify the latest short term rental regulations and Airbnb license requirements directly with local government authorities for Notre Dame to ensure full compliance before hosting.
(Source: AirROI data, 2026, finding no licensed listings among those analyzed)
Top Performing Airbnb Properties in Notre Dame (2026)
Benchmark your potential! Explore examples of top-performing Airbnb properties in Notre Damebased on Trailing Twelve Month (TTM) revenue. Analyze their characteristics, revenue, occupancy rate, and ADR to understand what drives success in this market.

9BR Sorin's Estate w/ Pool and Paddle Tennis Court
Entire Place • 9 bedrooms
EZ walk to stadium from the Craic'n Irish BnB !
Entire Place • 3 bedrooms

HOT TUB | Game Room | Indoor Playground| Sleep 16
Entire Place • 4 bedrooms
4 Bed, 3.5 Bath home only 1.5 miles from ND campus
Entire Place • 4 bedrooms

Renovated home in idyllic setting near ND
Entire Place • 5 bedrooms
Notre Dame Haus: Pool, Game room & 5 min to campus
Entire Place • 4 bedrooms
Note: Performance varies based on location, size, amenities, seasonality, and management quality. Data reflects the past 12 months.
Top Performing Airbnb Hosts in Notre Dame (2026)
Learn from the best! This table showcases top-performing Airbnb hosts in Notre Dame based on the number of properties managed and estimated total revenue over the past year. Analyze their scale and performance metrics.
| Host Name | Properties | Grossing Revenue | Stay Reviews | Avg Rating |
|---|---|---|---|---|
| The Sorin House | 1 | $368,375 | 16 | 5.00/5.0 |
| Shane | 1 | $153,591 | 43 | 4.98/5.0 |
| Todd | 1 | $116,787 | 167 | 4.86/5.0 |
| Jocelyn | 1 | $104,901 | 14 | 4.93/5.0 |
| Jennifer | 1 | $100,437 | 31 | 4.90/5.0 |
| Second Home Stays | 1 | $80,299 | 47 | 4.70/5.0 |
| Jorge | 1 | $76,795 | 5 | 5.00/5.0 |
| Mary | 1 | $75,358 | 9 | 5.00/5.0 |
| Palvi | 1 | $69,489 | 60 | 4.90/5.0 |
| Damien | 1 | $63,349 | 8 | 4.63/5.0 |
Analyzing the strategies of top hosts, such as their property selection, pricing, and guest communication, can offer valuable lessons for optimizing your own Airbnb operations in Notre Dame.
Dive Deeper: Advanced Notre Dame STR Market Data (2026)
Ready to unlock more insights? AirROI provides access to advanced metrics and comprehensive Airbnb data for Notre Dame. Explore detailed analytics beyond this report to refine your investment strategy, optimize pricing, and maximize your vacation rental profits.
Explore Advanced MetricsNotre Dame Short-Term Rental Market Composition (2026): Property & Room Types
Room Type Distribution
Property Type Distribution
Market Composition Insights for Notre Dame
- The Notre Dame Airbnb market composition is heavily skewed towards Entire Home/Apt listings, which make up 98.3% of the 59 active rentals. This indicates strong guest preference for privacy and space.
- Looking at the property type distribution in Notre Dame, House properties are the most common (89.8%), reflecting the local real estate landscape.
- Houses represent a significant 89.8% portion, catering likely to families or larger groups.
- Smaller segments like hotel/boutique (combined 3.4%) offer potential for unique stay experiences.
Notre Dame Airbnb Room Capacity Analysis (2026): Bedroom Distribution
Distribution of Listings by Number of Bedrooms
Room Capacity Insights for Notre Dame
- The dominant room capacity in Notre Dame is 3 bedrooms listings, making up 33.9% of the market. This suggests a strong demand for properties suitable for families or small groups.
- Together, 3 bedrooms and 4 bedrooms properties represent 61.0% of the active Airbnb listings in Notre Dame, indicating a high concentration in these sizes.
- A significant 77.9% of listings offer 3+ bedrooms, catering to larger groups and families seeking more space in Notre Dame.
Notre Dame Vacation Rental Guest Capacity Trends (2026)
Distribution of Listings by Guest Capacity
Guest Capacity Insights for Notre Dame
- The most common guest capacity trend in Notre Dame vacation rentals is listings accommodating 8+ guests (59.3%). This suggests the primary traveler segment is likely larger groups.
- Properties designed for 8+ guests and 6 guests dominate the Notre Dame STR market, accounting for 79.6% of listings.
- 88.1% of properties accommodate 6+ guests, serving the market segment for larger families or group travel in Notre Dame.
- On average, properties in Notre Dame are equipped to host 7.0 guests.
Notre Dame Airbnb Booking Patterns (2026): Available vs. Booked Days
Available Days Distribution
Booked Days Distribution
Booking Pattern Insights for Notre Dame
- The most common availability pattern in Notre Dame falls within the 271-366 days range, representing 57.6% of listings. This suggests many properties have significant open periods on their calendars.
- Approximately 89.8% of listings show high availability (181+ days open annually), indicating potential for increased bookings or specific owner usage patterns.
- For booked days, the 31-90 days range is most frequent in Notre Dame (37.3%), reflecting common guest stay durations or potential owner blocking patterns.
- A notable 11.9% of properties secure long booking periods (181+ days booked per year), highlighting successful long-term rental strategies or significant owner usage.
Notre Dame Airbnb Minimum Stay Requirements Analysis
Distribution of Listings by Minimum Night Requirement
1 Night
8 listings
13.6% of total
2 Nights
31 listings
52.5% of total
30+ Nights
20 listings
33.9% of total
Key Insights
- The most prevalent minimum stay requirement in Notre Dame is 2 Nights, adopted by 52.5% of listings. This highlights the market's preference for shorter, flexible bookings.
- A strong majority (66.1%) of the Notre Dame Airbnb data shows acceptance of very short stays (1-2 nights), indicating a dynamic, high-turnover market.
- A significant segment (33.9%) caters to monthly stays (30+ nights) in Notre Dame, pointing to opportunities in the extended-stay market.
Recommendations
- Align with the market by considering a 2 Nights minimum stay, as 52.5% of Notre Dame hosts use this setting.
- If feasible, allowing 1-night stays, especially midweek or during low season, could capture last-minute bookings, as only 13.6% currently do.
- A 2-night minimum appears standard (52.5%). Consider this for weekends or peak periods.
- Explore offering discounts for stays of 30+ nights to attract the 33.9% of the market seeking extended stays.
- Adjust minimum nights based on seasonality – potentially shorter during low season and longer during peak demand periods in Notre Dame.
Notre Dame Airbnb Cancellation Policy Trends Analysis (2026)
Super Strict 30 Days
2 listings
3.4% of total
Limited
3 listings
5.1% of total
Flexible
8 listings
13.6% of total
Moderate
11 listings
18.6% of total
Firm
30 listings
50.8% of total
Strict
5 listings
8.5% of total
Cancellation Policy Insights for Notre Dame
- The prevailing Airbnb cancellation policy trend in Notre Dame is Firm, used by 50.8% of listings.
- A majority (59.3%) of hosts in Notre Dame utilize Firm or Strict policies, indicating a market where hosts prioritize booking security.
- Strict cancellation policies are quite rare (8.5%), potentially making listings with this policy less competitive unless justified by high demand or property type.
Recommendations for Hosts
- Consider adopting a Firm policy to align with the 50.8% market standard in Notre Dame.
- Using a Strict policy might deter some guests, as only 8.5% of listings use it. Evaluate if potential revenue protection outweighs possible lower booking rates.
- Regularly review your cancellation policy against competitors and market demand shifts in Notre Dame.
Notre Dame STR Booking Lead Time Analysis (2026)
Average Booking Lead Time by Month
Booking Lead Time Insights for Notre Dame
- The overall average booking lead time for vacation rentals in Notre Dame is 78 days.
- Guests book furthest in advance for stays during September (average 113 days), likely coinciding with peak travel demand or local events.
- The shortest booking windows occur for stays in March (average 14 days), indicating more last-minute travel plans during this time.
- Seasonally, Fall (104 days avg.) sees the longest lead times, while Winter (39 days avg.) has the shortest, reflecting typical travel planning cycles.
Recommendations for Hosts
- Use the overall average lead time (78 days) as a baseline for your pricing and availability strategy in Notre Dame.
- For September stays, consider implementing length-of-stay discounts or slightly higher rates for bookings made less than 113 days out to capitalize on advance planning.
- During March, focus on last-minute booking availability and promotions, as guests book with very short notice (14 days avg.).
- Target marketing efforts for the Fall season well in advance (at least 104 days) to capture early planners.
- Monitor your own booking lead times against these Notre Dame averages to identify opportunities for dynamic pricing adjustments.
Popular & Essential Airbnb Amenities in Notre Dame (2026)
Amenity Prevalence
Amenity Insights for Notre Dame
- Essential amenities in Notre Dame that guests expect include: Air conditioning, Wifi, Smoke alarm, Free parking on premises, Kitchen, TV. Lacking these (any) could significantly impact bookings.
- Popular amenities like Carbon monoxide alarm, Dishes and silverware, Bed linens are common but not universal. Offering these can provide a competitive edge.
Recommendations for Hosts
- Ensure your listing includes all essential amenities for Notre Dame: Air conditioning, Wifi, Smoke alarm, Free parking on premises, Kitchen, TV.
- Prioritize adding missing essentials: Kitchen, TV.
- Consider adding popular differentiators like Carbon monoxide alarm or Dishes and silverware to increase appeal.
- Highlight unique or less common amenities you offer (e.g., hot tub, dedicated workspace, EV charger) in your listing description and photos.
- Regularly check competitor amenities in Notre Dame to stay competitive.
Notre Dame Airbnb Guest Demographics & Profile Analysis (2026)
Guest Profile Summary for Notre Dame
- The typical guest profile for Airbnb in Notre Dame consists of primarily domestic travelers (95%), often arriving from nearby Chicago, typically belonging to the Post-2000s (Gen Z/Alpha) group (50%), primarily speaking English or Spanish.
- Domestic travelers account for 94.6% of guests.
- Key international markets include United States (94.6%) and DC (0.7%).
- Top languages spoken are English (70.6%) followed by Spanish (10.1%).
- A significant demographic segment is the Post-2000s (Gen Z/Alpha) group, representing 50% of guests.
Recommendations for Hosts
- Target domestic marketing efforts towards travelers from Chicago and Indianapolis.
- Tailor amenities and listing descriptions to appeal to the dominant Post-2000s (Gen Z/Alpha) demographic (e.g., highlight fast WiFi, smart home features, local guides).
- Highlight unique local experiences or amenities relevant to the primary guest profile.
- Consider seasonal promotions aligned with peak travel times for key origin markets.
Nearby Short-Term Rental Market Comparison
How does the Notre Dame Airbnb market stack up against its neighbors? Compare key performance metrics like average monthly revenue, ADR, and occupancy rates in surrounding areas to understand the broader regional STR landscape.
| Market | Active Properties | Monthly Revenue | Daily Rate | Avg. Occupancy |
|---|---|---|---|---|
| Laketown Township | 59 | $6,112 | $529.59 | 44% |
| Port Sheldon Township | 26 | $6,015 | $566.98 | 47% |
| Ganges Township | 69 | $5,687 | $636.25 | 38% |
| Saugatuck Township | 141 | $5,627 | $508.58 | 43% |
| Paw Paw Township | 10 | $5,458 | $418.85 | 49% |
| New Buffalo Township | 260 | $5,145 | $633.18 | 36% |
| Bertrand Township | 22 | $5,011 | $365.69 | 40% |
| Union Pier | 16 | $4,998 | $659.10 | 36% |
| Fremont | 16 | $4,898 | $436.31 | 42% |
| Fennville | 34 | $4,874 | $542.47 | 42% |