New Haven Airbnb Market Analysis 2026: Short Term Rental Data & Vacation Rental Statistics in Indiana, United States
Is Airbnb profitable in New Haven in 2026? Explore comprehensive Airbnb analytics for New Haven, Indiana, United States to uncover income potential. This 2026 STR market report for New Haven, based on AirROI data from February 2025 to January 2026, reveals key trends in the niche market of 20 active listings.
Whether you're considering an Airbnb investment in New Haven, optimizing your existing vacation rental, or exploring rental arbitrage opportunities, understanding the New Haven Airbnb data is crucial. Leveraging the low regulation environment is key to maximizing your short term rental income potential. Let's dive into the specifics.
Key New Haven Airbnb Performance Metrics Overview
Monthly Airbnb Revenue Variations & Income Potential in New Haven (2026)
Understanding the monthly revenue variations for Airbnb listings in New Haven is key to maximizing your short term rental income potential. Seasonality significantly impacts earnings. Our analysis, based on data from the past 12 months, shows that the peak revenue month for STRs in New Haven is typically September, while March often presents the lowest earnings, highlighting opportunities for strategic pricing adjustments during shoulder and low seasons. Explore the typical Airbnb income in New Haven across different performance tiers:
- Best-in-class properties (Top 10%) achieve $5,284+ monthly, often utilizing dynamic pricing and superior guest experiences.
- Strong performing properties (Top 25%) earn $3,026 or more, indicating effective management and desirable locations/amenities.
- Typical properties (Median) generate around $1,311 per month, representing the average market performance.
- Entry-level properties (Bottom 25%) see earnings around $700, often with potential for optimization.
Average Monthly Airbnb Earnings Trend in New Haven
New Haven Airbnb Occupancy Rate Trends (2026)
Maximize your bookings by understanding the New Haven STR occupancy trends. Seasonal demand shifts significantly influence how often properties are booked. Typically, Februarysees the highest demand (peak season occupancy), while March experiences the lowest (low season). Effective strategies, like adjusting minimum stays or offering promotions, can boost occupancy during slower periods. Here's how different property tiers perform in New Haven:
- Best-in-class properties (Top 10%) achieve 82%+ occupancy, indicating high desirability and potentially optimized availability.
- Strong performing properties (Top 25%) maintain 70% or higher occupancy, suggesting good market fit and guest satisfaction.
- Typical properties (Median) have an occupancy rate around 53%.
- Entry-level properties (Bottom 25%) average 26% occupancy, potentially facing higher vacancy.
Average Monthly Occupancy Rate Trend in New Haven
Average Daily Rate (ADR) Airbnb Trends in New Haven (2026)
Effective short term rental pricing strategy in New Haven involves understanding monthly ADR fluctuations. The Average Daily Rate (ADR) for Airbnb in New Haven typically peaks in December and dips lowest during February. Leveraging Airbnb dynamic pricing tools or strategies based on this seasonality can significantly boost revenue. Here's a look at the typical nightly rates achieved:
- Best-in-class properties (Top 10%) command rates of $301+ per night, often due to premium features or locations.
- Strong performing properties (Top 25%) achieve nightly rates of $158 or more.
- Typical properties (Median) charge around $102 per night.
- Entry-level properties (Bottom 25%) earn around $51 per night.
Average Daily Rate (ADR) Trend by Month in New Haven
Get Live New Haven Market Intelligence 👇

Explore Real-time Analytics
Airbnb Seasonality Analysis & Trends in New Haven (2026)
Peak Season (September, November, April)
- Revenue averages $2,520 per month
- Occupancy rates average 49.6%
- Daily rates average $134
Shoulder Season
- Revenue averages $2,208 per month
- Occupancy maintains around 57.3%
- Daily rates hold near $132
Low Season (March, May, October)
- Revenue drops to average $1,646 per month
- Occupancy decreases to average 37.9%
- Daily rates adjust to average $128
Seasonality Insights for New Haven
- The Airbnb seasonality in New Haven shows moderate seasonality with distinct peak and low periods. While the sections above show seasonal averages, it's also insightful to look at the extremes:
- During the high season, the absolute peak month showcases New Haven's highest earning potential, with monthly revenues capable of climbing to $2,585, occupancy reaching a high of 62.9%, and ADRs peaking at $147.
- Conversely, the slowest single month of the year, typically falling within the low season, marks the market's lowest point. In this month, revenue might dip to $1,464, occupancy could drop to 34.4%, and ADRs may adjust down to $114.
- Understanding both the seasonal averages and these monthly peaks and troughs in revenue, occupancy, and ADR is crucial for maximizing your Airbnb profit potential in New Haven.
Seasonal Strategies for Maximizing Profit
- Peak Season: Maximize revenue through premium pricing and potentially longer minimum stays. Ensure high availability.
- Low Season: Offer competitive pricing, special promotions (e.g., extended stay discounts), and flexible cancellation policies. Target off-season travelers like remote workers or budget-conscious guests.
- Shoulder Seasons: Implement dynamic pricing that balances peak and low rates. Target weekend travelers or specific events. Offer slightly more flexible terms than peak season.
- Regularly analyze your own performance against these New Haven seasonality benchmarks and adjust your pricing and availability strategy accordingly.
Best Areas for Airbnb Investment in New Haven (2026)
Exploring the top neighborhoods for short-term rentals in New Haven? This section highlights key areas, outlining why they are attractive for hosts and guests, along with notable local attractions. Consider these locations based on your target guest profile and investment strategy.
| Neighborhood / Area | Why Host Here? (Target Guests & Appeal) | Key Attractions & Landmarks |
|---|---|---|
| Downtown New Haven | The vibrant downtown area is home to a mix of cultural, educational, and culinary attractions. It's a hub for visitors due to its proximity to Yale University and various theaters and restaurants. | Yale University, New Haven Museum, Shubert Theatre, Wooster Square, Avery Memorial Art Museum |
| East Rock | Known for its scenic views and outdoor activities, East Rock is popular among nature lovers and those seeking tranquility, making it ideal for vacationers looking to escape the hustle of city life while still being close to downtown. | East Rock Park, Baldwin Park, The Yale Peabody Museum of Natural History, Rocky Hill, Farmington Canal Heritage Trail |
| Westville | This charming neighborhood offers a mix of historic homes and a suburban feel, attracting families and those looking for a quieter stay while still being a short drive to the city center. | The New Haven Art Gallery, Westville Village, Edgewood Park, new shopping centers, local cafes and restaurants |
| Fair Haven | Emerging as a trendy area with a growing arts scene, Fair Haven attracts creative travelers looking for an authentic local experience while offering access to vibrant local eateries and shops. | Fair Haven Park, Artspace, Café Amici, local art galleries, the Quinnipiac River |
| Wooster Square | Famous for its historic architecture and the renowned Wooster Square pizza, this area attracts both food lovers and history buffs, making it a lively and popular stay for tourists. | Wooster Square Park, Luigi's Apizza, Frank Pepe Pizzeria, local farmer's market, historic brownstones |
| New Haven Green | This historic park at the heart of the city is surrounded by landmarks, making it a popular location for visitors seeking convenience to major attractions, shops, and dining options. | New Haven Green, Trinity Church, Yale Law School, The Goffe Street Park, downtown shops and restaurants |
| East Haven | Just on the outskirts of New Haven, East Haven offers beach access and a more relaxed atmosphere, appealing to families looking for a waterfront vacation experience. | East Haven Town Beach, Woodland Park, The East Haven Historical Society, local seafood shacks, scenic salt marshes |
| The Hill | A diverse neighborhood known for its community and culture, The Hill is ideal for travelers seeking authentic experiences and interactions with local residents, along with a variety of local eateries. | The Hillhouse High School, Savin Rock, local parks, community events, unique restaurants |
Understanding Airbnb License Requirements & STR Laws in New Haven (2026)
While New Haven, Indiana, United States currently shows low STR regulations, specific Airbnb license requirements might still exist or change. Always verify the latest short term rental regulations and Airbnb license requirements directly with local government authorities for New Haven to ensure full compliance before hosting.
(Source: AirROI data, 2026, finding no licensed listings among those analyzed)
Top Performing Airbnb Properties in New Haven (2026)
Benchmark your potential! Explore examples of top-performing Airbnb properties in New Havenbased on Trailing Twelve Month (TTM) revenue. Analyze their characteristics, revenue, occupancy rate, and ADR to understand what drives success in this market.
Spacious Pet & Family-Friendly Home for 11 guests
Entire Place • 5 bedrooms
A Beautiful Family Friendly Home
Entire Place • 4 bedrooms
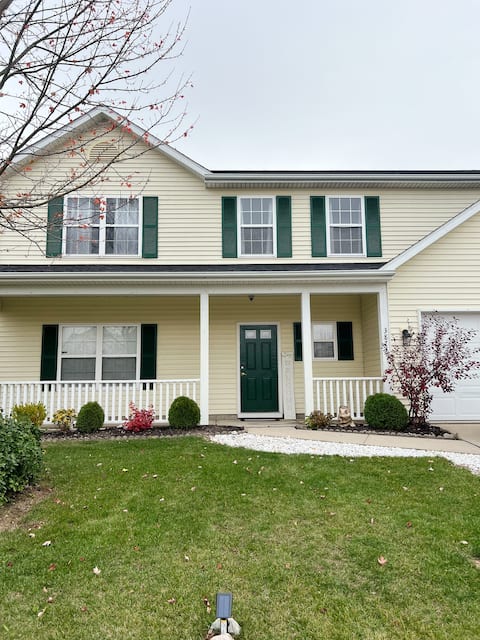
![[4-BR/Sleeps 12] Family & Friends Home in Indiana](https://a0.muscache.com/im/pictures/hosting/Hosting-U3RheVN1cHBseUxpc3Rpbmc6Njk2MzA0MTYzMjMzNDYyODgy/original/dcbdcb4c-9f3f-400c-b579-ea1b6e4186b9.jpeg?im_w=480&im_format=avif)
[4-BR/Sleeps 12] Family & Friends Home in Indiana
Entire Place • 4 bedrooms

Spacious Pet & Family-Friendly Home for 9+ Guests
Entire Place • 4 bedrooms
Doty House - Country Charm
Entire Place • 3 bedrooms

Kirkmore Kasa | Fenced Yard | Ranch Style
Entire Place • 3 bedrooms
Note: Performance varies based on location, size, amenities, seasonality, and management quality. Data reflects the past 12 months.
Top Performing Airbnb Hosts in New Haven (2026)
Learn from the best! This table showcases top-performing Airbnb hosts in New Haven based on the number of properties managed and estimated total revenue over the past year. Analyze their scale and performance metrics.
| Host Name | Properties | Grossing Revenue | Stay Reviews | Avg Rating |
|---|---|---|---|---|
| Jacinda | 2 | $101,071 | 75 | 4.88/5.0 |
| Houston | 6 | $61,449 | 61 | 4.71/5.0 |
| Millicent | 1 | $47,833 | 16 | 4.81/5.0 |
| Timeka | 1 | $39,257 | 183 | 4.59/5.0 |
| Kamal | 4 | $34,539 | 64 | 4.83/5.0 |
| Karen | 1 | $27,963 | 76 | 4.97/5.0 |
| Dee | 2 | $15,800 | 287 | 4.92/5.0 |
| Jeremy | 1 | $13,366 | 5 | 4.80/5.0 |
| Alfonzo | 1 | $10,799 | 7 | 4.71/5.0 |
| Nancy Ann | 1 | $9,641 | 45 | 4.93/5.0 |
Analyzing the strategies of top hosts, such as their property selection, pricing, and guest communication, can offer valuable lessons for optimizing your own Airbnb operations in New Haven.
Dive Deeper: Advanced New Haven STR Market Data (2026)
Ready to unlock more insights? AirROI provides access to advanced metrics and comprehensive Airbnb data for New Haven. Explore detailed analytics beyond this report to refine your investment strategy, optimize pricing, and maximize your vacation rental profits.
Explore Advanced MetricsNew Haven Short-Term Rental Market Composition (2026): Property & Room Types
Room Type Distribution
Property Type Distribution
Market Composition Insights for New Haven
- The New Haven Airbnb market composition is heavily skewed towards Entire Home/Apt listings, which make up 65% of the 20 active rentals. This indicates strong guest preference for privacy and space.
- However, a notable 35% share for Private Rooms suggests opportunities for budget-conscious travelers or hosts renting out spare rooms.
- Looking at the property type distribution in New Haven, House properties are the most common (80%), reflecting the local real estate landscape.
- Houses represent a significant 80% portion, catering likely to families or larger groups.
New Haven Airbnb Room Capacity Analysis (2026): Bedroom Distribution
Distribution of Listings by Number of Bedrooms
Room Capacity Insights for New Haven
- The dominant room capacity in New Haven is 1 bedroom listings, making up 25% of the market. This suggests a strong demand for properties suitable for couples or solo travelers.
- Together, 1 bedroom and 3 bedrooms properties represent 45.0% of the active Airbnb listings in New Haven, indicating a high concentration in these sizes.
- A significant 40.0% of listings offer 3+ bedrooms, catering to larger groups and families seeking more space in New Haven.
New Haven Vacation Rental Guest Capacity Trends (2026)
Distribution of Listings by Guest Capacity
Guest Capacity Insights for New Haven
- The most common guest capacity trend in New Haven vacation rentals is listings accommodating 8+ guests (25%). This suggests the primary traveler segment is likely larger groups.
- Properties designed for 8+ guests and 2 guests dominate the New Haven STR market, accounting for 45.0% of listings.
- 45.0% of properties accommodate 6+ guests, serving the market segment for larger families or group travel in New Haven.
- On average, properties in New Haven are equipped to host 3.9 guests.
New Haven Airbnb Booking Patterns (2026): Available vs. Booked Days
Available Days Distribution
Booked Days Distribution
Booking Pattern Insights for New Haven
- The most common availability pattern in New Haven falls within the 181-270 days range, representing 40% of listings. This suggests many properties have significant open periods on their calendars.
- Approximately 70.0% of listings show high availability (181+ days open annually), indicating potential for increased bookings or specific owner usage patterns.
- For booked days, the 91-180 days range is most frequent in New Haven (40%), reflecting common guest stay durations or potential owner blocking patterns.
- A notable 30.0% of properties secure long booking periods (181+ days booked per year), highlighting successful long-term rental strategies or significant owner usage.
New Haven Airbnb Minimum Stay Requirements Analysis
Distribution of Listings by Minimum Night Requirement
1 Night
9 listings
45% of total
2 Nights
1 listings
5% of total
3 Nights
2 listings
10% of total
4-6 Nights
5 listings
25% of total
30+ Nights
3 listings
15% of total
Key Insights
- The most prevalent minimum stay requirement in New Haven is 1 Night, adopted by 45% of listings. This highlights the market's preference for shorter, flexible bookings.
- A significant segment (15%) caters to monthly stays (30+ nights) in New Haven, pointing to opportunities in the extended-stay market.
Recommendations
- Align with the market by considering a 1 Night minimum stay, as 45% of New Haven hosts use this setting.
- Explore offering discounts for stays of 30+ nights to attract the 15% of the market seeking extended stays.
- Adjust minimum nights based on seasonality – potentially shorter during low season and longer during peak demand periods in New Haven.
New Haven Airbnb Cancellation Policy Trends Analysis (2026)
Super Strict 30 Days
1 listings
5% of total
Flexible
8 listings
40% of total
Moderate
2 listings
10% of total
Firm
7 listings
35% of total
Strict
2 listings
10% of total
Cancellation Policy Insights for New Haven
- The prevailing Airbnb cancellation policy trend in New Haven is Flexible, used by 40% of listings.
- There's a relatively balanced mix between guest-friendly (50.0%) and stricter (45.0%) policies, offering choices for different guest needs.
Recommendations for Hosts
- Consider adopting a Flexible policy to align with the 40% market standard in New Haven.
- Using a Strict policy might deter some guests, as only 10% of listings use it. Evaluate if potential revenue protection outweighs possible lower booking rates.
- Regularly review your cancellation policy against competitors and market demand shifts in New Haven.
New Haven STR Booking Lead Time Analysis (2026)
Average Booking Lead Time by Month
Booking Lead Time Insights for New Haven
- The overall average booking lead time for vacation rentals in New Haven is 19 days.
- Guests book furthest in advance for stays during December (average 36 days), likely coinciding with peak travel demand or local events.
- The shortest booking windows occur for stays in April (average 11 days), indicating more last-minute travel plans during this time.
- Seasonally, Summer (27 days avg.) sees the longest lead times, while Fall (16 days avg.) has the shortest, reflecting typical travel planning cycles.
Recommendations for Hosts
- Use the overall average lead time (19 days) as a baseline for your pricing and availability strategy in New Haven.
- For December stays, consider implementing length-of-stay discounts or slightly higher rates for bookings made less than 36 days out to capitalize on advance planning.
- During April, focus on last-minute booking availability and promotions, as guests book with very short notice (11 days avg.).
- Target marketing efforts for the Summer season well in advance (at least 27 days) to capture early planners.
- Monitor your own booking lead times against these New Haven averages to identify opportunities for dynamic pricing adjustments.
Popular & Essential Airbnb Amenities in New Haven (2026)
Amenity Prevalence
Amenity Insights for New Haven
- Essential amenities in New Haven that guests expect include: Smoke alarm, Air conditioning, Free parking on premises, Heating, Wifi, TV, Kitchen. Lacking these (any) could significantly impact bookings.
- Popular amenities like Carbon monoxide alarm, Cooking basics, Iron are common but not universal. Offering these can provide a competitive edge.
Recommendations for Hosts
- Ensure your listing includes all essential amenities for New Haven: Smoke alarm, Air conditioning, Free parking on premises, Heating, Wifi, TV, Kitchen.
- Prioritize adding missing essentials: Kitchen.
- Consider adding popular differentiators like Carbon monoxide alarm or Cooking basics to increase appeal.
- Highlight unique or less common amenities you offer (e.g., hot tub, dedicated workspace, EV charger) in your listing description and photos.
- Regularly check competitor amenities in New Haven to stay competitive.
New Haven Airbnb Guest Demographics & Profile Analysis (2026)
Guest Profile Summary for New Haven
- The typical guest profile for Airbnb in New Haven consists of primarily domestic travelers (93%), often arriving from nearby Fort Wayne, typically belonging to the Post-2000s (Gen Z/Alpha) group (50%), primarily speaking English or Spanish.
- Domestic travelers account for 92.5% of guests.
- Key international markets include United States (92.5%) and United Kingdom (1.9%).
- Top languages spoken are English (72.7%) followed by Spanish (16.4%).
- A significant demographic segment is the Post-2000s (Gen Z/Alpha) group, representing 50% of guests.
Recommendations for Hosts
- Target domestic marketing efforts towards travelers from Fort Wayne and Chippewa Lake.
- Tailor amenities and listing descriptions to appeal to the dominant Post-2000s (Gen Z/Alpha) demographic (e.g., highlight fast WiFi, smart home features, local guides).
- Highlight unique local experiences or amenities relevant to the primary guest profile.
- Consider seasonal promotions aligned with peak travel times for key origin markets.
Nearby Short-Term Rental Market Comparison
How does the New Haven Airbnb market stack up against its neighbors? Compare key performance metrics like average monthly revenue, ADR, and occupancy rates in surrounding areas to understand the broader regional STR landscape.
| Market | Active Properties | Monthly Revenue | Daily Rate | Avg. Occupancy |
|---|---|---|---|---|
| Laketown Township | 59 | $6,112 | $529.59 | 44% |
| Port Sheldon Township | 26 | $6,015 | $566.98 | 47% |
| Ganges Township | 69 | $5,687 | $636.25 | 38% |
| Saugatuck Township | 141 | $5,627 | $508.58 | 43% |
| Paw Paw Township | 10 | $5,458 | $418.85 | 49% |
| New Buffalo Township | 260 | $5,145 | $633.18 | 36% |
| Bertrand Township | 22 | $5,011 | $365.69 | 40% |
| Union Pier | 16 | $4,998 | $659.10 | 36% |
| Fremont | 16 | $4,898 | $436.31 | 42% |
| Fennville | 34 | $4,874 | $542.47 | 42% |