Nashville Airbnb Market Analysis 2026: Short Term Rental Data & Vacation Rental Statistics in Indiana, United States
Is Airbnb profitable in Nashville in 2026? Explore comprehensive Airbnb analytics for Nashville, Indiana, United States to uncover income potential. This 2026 STR market report for Nashville, based on AirROI data from February 2025 to January 2026, reveals key trends in the market of 250 active listings.
Whether you're considering an Airbnb investment in Nashville, optimizing your existing vacation rental, or exploring rental arbitrage opportunities, understanding the Nashville Airbnb data is crucial. Leveraging the low regulation environment is key to maximizing your short term rental income potential. Let's dive into the specifics.
Key Nashville Airbnb Performance Metrics Overview
Monthly Airbnb Revenue Variations & Income Potential in Nashville (2026)
Understanding the monthly revenue variations for Airbnb listings in Nashville is key to maximizing your short term rental income potential. Seasonality significantly impacts earnings. Our analysis, based on data from the past 12 months, shows that the peak revenue month for STRs in Nashville is typically October, while February often presents the lowest earnings, highlighting opportunities for strategic pricing adjustments during shoulder and low seasons. Explore the typical Airbnb income in Nashville across different performance tiers:
- Best-in-class properties (Top 10%) achieve $7,204+ monthly, often utilizing dynamic pricing and superior guest experiences.
- Strong performing properties (Top 25%) earn $5,312 or more, indicating effective management and desirable locations/amenities.
- Typical properties (Median) generate around $3,373 per month, representing the average market performance.
- Entry-level properties (Bottom 25%) see earnings around $1,781, often with potential for optimization.
Average Monthly Airbnb Earnings Trend in Nashville
Nashville Airbnb Occupancy Rate Trends (2026)
Maximize your bookings by understanding the Nashville STR occupancy trends. Seasonal demand shifts significantly influence how often properties are booked. Typically, Octobersees the highest demand (peak season occupancy), while January experiences the lowest (low season). Effective strategies, like adjusting minimum stays or offering promotions, can boost occupancy during slower periods. Here's how different property tiers perform in Nashville:
- Best-in-class properties (Top 10%) achieve 75%+ occupancy, indicating high desirability and potentially optimized availability.
- Strong performing properties (Top 25%) maintain 60% or higher occupancy, suggesting good market fit and guest satisfaction.
- Typical properties (Median) have an occupancy rate around 40%.
- Entry-level properties (Bottom 25%) average 23% occupancy, potentially facing higher vacancy.
Average Monthly Occupancy Rate Trend in Nashville
Average Daily Rate (ADR) Airbnb Trends in Nashville (2026)
Effective short term rental pricing strategy in Nashville involves understanding monthly ADR fluctuations. The Average Daily Rate (ADR) for Airbnb in Nashville typically peaks in October and dips lowest during February. Leveraging Airbnb dynamic pricing tools or strategies based on this seasonality can significantly boost revenue. Here's a look at the typical nightly rates achieved:
- Best-in-class properties (Top 10%) command rates of $491+ per night, often due to premium features or locations.
- Strong performing properties (Top 25%) achieve nightly rates of $348 or more.
- Typical properties (Median) charge around $258 per night.
- Entry-level properties (Bottom 25%) earn around $190 per night.
Average Daily Rate (ADR) Trend by Month in Nashville
Get Live Nashville Market Intelligence 👇

Explore Real-time Analytics
Airbnb Seasonality Analysis & Trends in Nashville (2026)
Peak Season (October, November, July)
- Revenue averages $5,173 per month
- Occupancy rates average 49.9%
- Daily rates average $312
Shoulder Season
- Revenue averages $3,888 per month
- Occupancy maintains around 42.5%
- Daily rates hold near $293
Low Season (January, February, April)
- Revenue drops to average $2,705 per month
- Occupancy decreases to average 34.0%
- Daily rates adjust to average $265
Seasonality Insights for Nashville
- The Airbnb seasonality in Nashville shows highly seasonal trends requiring careful strategy. While the sections above show seasonal averages, it's also insightful to look at the extremes:
- During the high season, the absolute peak month showcases Nashville's highest earning potential, with monthly revenues capable of climbing to $6,481, occupancy reaching a high of 58.0%, and ADRs peaking at $330.
- Conversely, the slowest single month of the year, typically falling within the low season, marks the market's lowest point. In this month, revenue might dip to $2,376, occupancy could drop to 26.5%, and ADRs may adjust down to $250.
- Understanding both the seasonal averages and these monthly peaks and troughs in revenue, occupancy, and ADR is crucial for maximizing your Airbnb profit potential in Nashville.
Seasonal Strategies for Maximizing Profit
- Peak Season: Maximize revenue through premium pricing and potentially longer minimum stays. Ensure high availability.
- Low Season: Offer competitive pricing, special promotions (e.g., extended stay discounts), and flexible cancellation policies. Target off-season travelers like remote workers or budget-conscious guests.
- Shoulder Seasons: Implement dynamic pricing that balances peak and low rates. Target weekend travelers or specific events. Offer slightly more flexible terms than peak season.
- Regularly analyze your own performance against these Nashville seasonality benchmarks and adjust your pricing and availability strategy accordingly.
Best Areas for Airbnb Investment in Nashville (2026)
Exploring the top neighborhoods for short-term rentals in Nashville? This section highlights key areas, outlining why they are attractive for hosts and guests, along with notable local attractions. Consider these locations based on your target guest profile and investment strategy.
| Neighborhood / Area | Why Host Here? (Target Guests & Appeal) | Key Attractions & Landmarks |
|---|---|---|
| Downtown Nashville | The heart of Nashville filled with live music venues, restaurants, and nightlife. Ideal for tourists wanting to experience the vibrant city life and the iconic music scene. | Broadway, The Grand Ole Opry, Ryman Auditorium, Museum of African American Music, Nashville City Market |
| East Nashville | A trendy neighborhood known for its artistic vibe, East Nashville is popular with locals and visitors alike, offering unique shops, eateries, and parks. | Five Points, Shelby Bottoms Greenway, The Pharmacy Burger Parlor & Beer Garden, Bongo East, Nashville Flea Market |
| Music Row | Famous for its music industry connections, Music Row is perfect for those visiting Nashville for its musical heritage. It offers exclusive studios and music-related attractions. | Country Music Hall of Fame, The Bluebird Cafe, Historic RCA Studio B, Nashville Songwriters Hall of Fame, Belmont University |
| 12 South | A charming neighborhood featuring boutique shops, coffee houses, and vibrant nightlife. Great for families and couples looking to explore local culture. | 12 South Business District, Sevier Park, Salt & Vine, Edley's Bar-B-Que, Frothy Monkey |
| The Gulch | A modern urban district with upscale dining and shopping. Attracts a younger crowd looking for a more polished Nashville experience. | The Gulch Murals, Whole Foods Market, Station Inn, Rivannah, The Thompson Hotel Rooftop |
| West End | Home to many of Nashville's top universities and healthcare facilities. Popular with business travelers and families visiting the area. | Vanderbilt University, Centennial Park, Parthenon, The Belcourt Theatre, Hattie B's Hot Chicken |
| Nashville International Airport | Ideal for short-term rentals catering to business travelers and those looking for convenient access to the airport. | Airport Plaza, Rent-A-Car Facility, Park 'N Fly, Riverfront Park, Pond Creek Park |
| Sylvan Park | A family-friendly neighborhood with parks, restaurants, and local stores. Great for longer family stays and those looking for a suburban feel. | McCabe Park, West End Farmers Market, Park Cafe, Pinewood Social, Crema Coffee Roasters |
Understanding Airbnb License Requirements & STR Laws in Nashville (2026)
While Nashville, Indiana, United States currently shows low STR regulations, specific Airbnb license requirements might still exist or change. Always verify the latest short term rental regulations and Airbnb license requirements directly with local government authorities for Nashville to ensure full compliance before hosting.
(Source: AirROI data, 2026, finding no licensed listings among those analyzed)
Top Performing Airbnb Properties in Nashville (2026)
Benchmark your potential! Explore examples of top-performing Airbnb properties in Nashvillebased on Trailing Twelve Month (TTM) revenue. Analyze their characteristics, revenue, occupancy rate, and ADR to understand what drives success in this market.
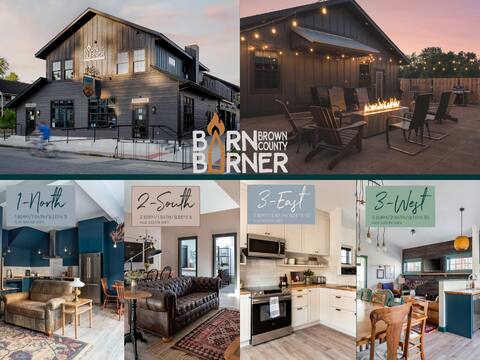
Barn Burner: Luxe Space for 29 ppl in Nashville IN
Entire Place • 9 bedrooms

Eagles Nest Lodge - Ultimate Vacation Destination
Entire Place • 5 bedrooms

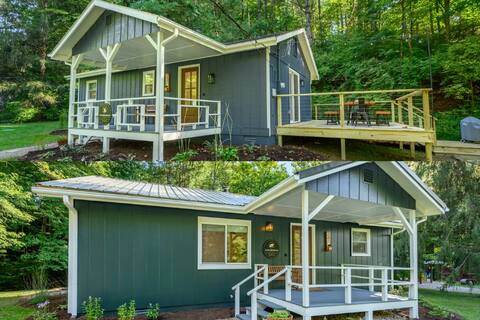
Luxury Brown County Cabin | Hot Tub & Views
Entire Place • 4 bedrooms

The Allison House • Walk to Shops + Parking
Entire Place • 7 bedrooms
The Bungalows - 2 neighboring houses & 2 hot tubs!
Entire Place • 4 bedrooms

Large home in heart of Nashville
Entire Place • 4 bedrooms
Note: Performance varies based on location, size, amenities, seasonality, and management quality. Data reflects the past 12 months.
Top Performing Airbnb Hosts in Nashville (2026)
Learn from the best! This table showcases top-performing Airbnb hosts in Nashville based on the number of properties managed and estimated total revenue over the past year. Analyze their scale and performance metrics.
| Host Name | Properties | Grossing Revenue | Stay Reviews | Avg Rating |
|---|---|---|---|---|
| Ashley | 78 | $2,452,190 | 1780 | 4.67/5.0 |
| Eric | 37 | $2,088,812 | 4644 | 4.82/5.0 |
| Marisa | 8 | $679,582 | 395 | 4.96/5.0 |
| Courtney | 5 | $396,700 | 513 | 4.93/5.0 |
| Kara | 4 | $350,835 | 120 | 4.96/5.0 |
| Christina | 4 | $284,621 | 622 | 4.95/5.0 |
| Josie | 8 | $243,935 | 780 | 4.91/5.0 |
| Franklin Square | 8 | $171,806 | 1252 | 4.89/5.0 |
| Cara | 5 | $168,184 | 123 | 4.85/5.0 |
| Dave | 1 | $159,755 | 25 | 5.00/5.0 |
Analyzing the strategies of top hosts, such as their property selection, pricing, and guest communication, can offer valuable lessons for optimizing your own Airbnb operations in Nashville.
Dive Deeper: Advanced Nashville STR Market Data (2026)
Ready to unlock more insights? AirROI provides access to advanced metrics and comprehensive Airbnb data for Nashville. Explore detailed analytics beyond this report to refine your investment strategy, optimize pricing, and maximize your vacation rental profits.
Explore Advanced MetricsNashville Short-Term Rental Market Composition (2026): Property & Room Types
Room Type Distribution
Property Type Distribution
Market Composition Insights for Nashville
- The Nashville Airbnb market composition is heavily skewed towards Entire Home/Apt listings, which make up 90.4% of the 250 active rentals. This indicates strong guest preference for privacy and space.
- Looking at the property type distribution in Nashville, Outdoor/Unique properties are the most common (52.8%), reflecting the local real estate landscape.
- Houses represent a significant 28.8% portion, catering likely to families or larger groups.
- Smaller segments like others, unique stays, hotel/boutique (combined 5.2%) offer potential for unique stay experiences.
Nashville Airbnb Room Capacity Analysis (2026): Bedroom Distribution
Distribution of Listings by Number of Bedrooms
Room Capacity Insights for Nashville
- The dominant room capacity in Nashville is 2 bedrooms listings, making up 34.8% of the market. This suggests a strong demand for properties suitable for couples or solo travelers.
- Together, 2 bedrooms and 3 bedrooms properties represent 57.6% of the active Airbnb listings in Nashville, indicating a high concentration in these sizes.
- A significant 35.6% of listings offer 3+ bedrooms, catering to larger groups and families seeking more space in Nashville.
Nashville Vacation Rental Guest Capacity Trends (2026)
Distribution of Listings by Guest Capacity
Guest Capacity Insights for Nashville
- The most common guest capacity trend in Nashville vacation rentals is listings accommodating 4 guests (28%). This suggests the primary traveler segment is likely small families or groups.
- Properties designed for 4 guests and 6 guests dominate the Nashville STR market, accounting for 53.6% of listings.
- 48.8% of properties accommodate 6+ guests, serving the market segment for larger families or group travel in Nashville.
- On average, properties in Nashville are equipped to host 5.0 guests.
Nashville Airbnb Booking Patterns (2026): Available vs. Booked Days
Available Days Distribution
Booked Days Distribution
Booking Pattern Insights for Nashville
- The most common availability pattern in Nashville falls within the 271-366 days range, representing 35.2% of listings. This suggests many properties have significant open periods on their calendars.
- Approximately 70.4% of listings show high availability (181+ days open annually), indicating potential for increased bookings or specific owner usage patterns.
- For booked days, the 91-180 days range is most frequent in Nashville (36.4%), reflecting common guest stay durations or potential owner blocking patterns.
- A notable 30.4% of properties secure long booking periods (181+ days booked per year), highlighting successful long-term rental strategies or significant owner usage.
Nashville Airbnb Minimum Stay Requirements Analysis
Distribution of Listings by Minimum Night Requirement
1 Night
47 listings
18.8% of total
2 Nights
130 listings
52% of total
3 Nights
1 listings
0.4% of total
30+ Nights
72 listings
28.8% of total
Key Insights
- The most prevalent minimum stay requirement in Nashville is 2 Nights, adopted by 52% of listings. This highlights the market's preference for shorter, flexible bookings.
- A strong majority (70.8%) of the Nashville Airbnb data shows acceptance of very short stays (1-2 nights), indicating a dynamic, high-turnover market.
- A significant segment (28.8%) caters to monthly stays (30+ nights) in Nashville, pointing to opportunities in the extended-stay market.
Recommendations
- Align with the market by considering a 2 Nights minimum stay, as 52% of Nashville hosts use this setting.
- If feasible, allowing 1-night stays, especially midweek or during low season, could capture last-minute bookings, as only 18.8% currently do.
- A 2-night minimum appears standard (52%). Consider this for weekends or peak periods.
- Explore offering discounts for stays of 30+ nights to attract the 28.8% of the market seeking extended stays.
- Adjust minimum nights based on seasonality – potentially shorter during low season and longer during peak demand periods in Nashville.
Nashville Airbnb Cancellation Policy Trends Analysis (2026)
Non-refundable
1 listings
0.4% of total
Super Strict 60 Days
1 listings
0.4% of total
Super Strict 30 Days
1 listings
0.4% of total
Refundable
2 listings
0.8% of total
Limited
2 listings
0.8% of total
Flexible
21 listings
8.4% of total
Moderate
54 listings
21.6% of total
Firm
147 listings
58.8% of total
Strict
21 listings
8.4% of total
Cancellation Policy Insights for Nashville
- The prevailing Airbnb cancellation policy trend in Nashville is Firm, used by 58.8% of listings.
- A majority (67.2%) of hosts in Nashville utilize Firm or Strict policies, indicating a market where hosts prioritize booking security.
- Strict cancellation policies are quite rare (8.4%), potentially making listings with this policy less competitive unless justified by high demand or property type.
Recommendations for Hosts
- Consider adopting a Firm policy to align with the 58.8% market standard in Nashville.
- Using a Strict policy might deter some guests, as only 8.4% of listings use it. Evaluate if potential revenue protection outweighs possible lower booking rates.
- Regularly review your cancellation policy against competitors and market demand shifts in Nashville.
Nashville STR Booking Lead Time Analysis (2026)
Average Booking Lead Time by Month
Booking Lead Time Insights for Nashville
- The overall average booking lead time for vacation rentals in Nashville is 68 days.
- Guests book furthest in advance for stays during May (average 108 days), likely coinciding with peak travel demand or local events.
- The shortest booking windows occur for stays in January (average 41 days), indicating more last-minute travel plans during this time.
- Seasonally, Fall (91 days avg.) sees the longest lead times, while Winter (49 days avg.) has the shortest, reflecting typical travel planning cycles.
Recommendations for Hosts
- Use the overall average lead time (68 days) as a baseline for your pricing and availability strategy in Nashville.
- For May stays, consider implementing length-of-stay discounts or slightly higher rates for bookings made less than 108 days out to capitalize on advance planning.
- Target marketing efforts for the Fall season well in advance (at least 91 days) to capture early planners.
- Monitor your own booking lead times against these Nashville averages to identify opportunities for dynamic pricing adjustments.
Popular & Essential Airbnb Amenities in Nashville (2026)
Amenity Prevalence
Amenity Insights for Nashville
- Essential amenities in Nashville that guests expect include: Air conditioning, Heating, Smoke alarm, Microwave. Lacking these (any) could significantly impact bookings.
- Popular amenities like TV, Free parking on premises, Coffee maker are common but not universal. Offering these can provide a competitive edge.
- Warning: Wifi is not universally provided but is considered essential globally. Ensure reliable Wifi is offered.
Recommendations for Hosts
- Ensure your listing includes all essential amenities for Nashville: Air conditioning, Heating, Smoke alarm, Microwave.
- Prioritize adding missing essentials: Air conditioning, Heating, Smoke alarm, Microwave.
- Consider adding popular differentiators like TV or Free parking on premises to increase appeal.
- Highlight unique or less common amenities you offer (e.g., hot tub, dedicated workspace, EV charger) in your listing description and photos.
- Regularly check competitor amenities in Nashville to stay competitive.
Nashville Airbnb Guest Demographics & Profile Analysis (2026)
Guest Profile Summary for Nashville
- The typical guest profile for Airbnb in Nashville consists of primarily domestic travelers (99%), often arriving from nearby Indianapolis, typically belonging to the Post-2000s (Gen Z/Alpha) group (50%), primarily speaking English or Spanish.
- Domestic travelers account for 99.1% of guests.
- Key international markets include United States (99.1%) and United Kingdom (0.2%).
- Top languages spoken are English (87.2%) followed by Spanish (6.6%).
- A significant demographic segment is the Post-2000s (Gen Z/Alpha) group, representing 50% of guests.
Recommendations for Hosts
- Target domestic marketing efforts towards travelers from Indianapolis and Cincinnati.
- Tailor amenities and listing descriptions to appeal to the dominant Post-2000s (Gen Z/Alpha) demographic (e.g., highlight fast WiFi, smart home features, local guides).
- Highlight unique local experiences or amenities relevant to the primary guest profile.
- Consider seasonal promotions aligned with peak travel times for key origin markets.
Nearby Short-Term Rental Market Comparison
How does the Nashville Airbnb market stack up against its neighbors? Compare key performance metrics like average monthly revenue, ADR, and occupancy rates in surrounding areas to understand the broader regional STR landscape.
| Market | Active Properties | Monthly Revenue | Daily Rate | Avg. Occupancy |
|---|---|---|---|---|
| Westfield | 131 | $3,724 | $338.42 | 44% |
| Unionville | 21 | $3,475 | $387.47 | 43% |
| Shelbyville | 78 | $3,309 | $350.54 | 38% |
| Marshall | 12 | $3,135 | $264.69 | 39% |
| Simpsonville | 20 | $3,077 | $322.37 | 42% |
| Mount Washington | 14 | $2,898 | $229.72 | 43% |
| West Baden Springs | 18 | $2,892 | $363.80 | 29% |
| Greenwood | 46 | $2,846 | $249.65 | 48% |
| Louisville | 2,027 | $2,846 | $318.83 | 41% |
| La Grange | 29 | $2,826 | $327.31 | 35% |