Michigan City Airbnb Market Analysis 2026: Short Term Rental Data & Vacation Rental Statistics in Indiana, United States
Is Airbnb profitable in Michigan City in 2026? Explore comprehensive Airbnb analytics for Michigan City, Indiana, United States to uncover income potential. This 2026 STR market report for Michigan City, based on AirROI data from February 2025 to January 2026, reveals key trends in the market of 456 active listings.
Whether you're considering an Airbnb investment in Michigan City, optimizing your existing vacation rental, or exploring rental arbitrage opportunities, understanding the Michigan City Airbnb data is crucial. Leveraging the low regulation environment is key to maximizing your short term rental income potential. Let's dive into the specifics.
Key Michigan City Airbnb Performance Metrics Overview
Monthly Airbnb Revenue Variations & Income Potential in Michigan City (2026)
Understanding the monthly revenue variations for Airbnb listings in Michigan City is key to maximizing your short term rental income potential. Seasonality significantly impacts earnings. Our analysis, based on data from the past 12 months, shows that the peak revenue month for STRs in Michigan City is typically July, while February often presents the lowest earnings, highlighting opportunities for strategic pricing adjustments during shoulder and low seasons. Explore the typical Airbnb income in Michigan City across different performance tiers:
- Best-in-class properties (Top 10%) achieve $9,181+ monthly, often utilizing dynamic pricing and superior guest experiences.
- Strong performing properties (Top 25%) earn $5,523 or more, indicating effective management and desirable locations/amenities.
- Typical properties (Median) generate around $3,215 per month, representing the average market performance.
- Entry-level properties (Bottom 25%) see earnings around $1,718, often with potential for optimization.
Average Monthly Airbnb Earnings Trend in Michigan City
Michigan City Airbnb Occupancy Rate Trends (2026)
Maximize your bookings by understanding the Michigan City STR occupancy trends. Seasonal demand shifts significantly influence how often properties are booked. Typically, Julysees the highest demand (peak season occupancy), while January experiences the lowest (low season). Effective strategies, like adjusting minimum stays or offering promotions, can boost occupancy during slower periods. Here's how different property tiers perform in Michigan City:
- Best-in-class properties (Top 10%) achieve 73%+ occupancy, indicating high desirability and potentially optimized availability.
- Strong performing properties (Top 25%) maintain 53% or higher occupancy, suggesting good market fit and guest satisfaction.
- Typical properties (Median) have an occupancy rate around 34%.
- Entry-level properties (Bottom 25%) average 19% occupancy, potentially facing higher vacancy.
Average Monthly Occupancy Rate Trend in Michigan City
Average Daily Rate (ADR) Airbnb Trends in Michigan City (2026)
Effective short term rental pricing strategy in Michigan City involves understanding monthly ADR fluctuations. The Average Daily Rate (ADR) for Airbnb in Michigan City typically peaks in July and dips lowest during February. Leveraging Airbnb dynamic pricing tools or strategies based on this seasonality can significantly boost revenue. Here's a look at the typical nightly rates achieved:
- Best-in-class properties (Top 10%) command rates of $783+ per night, often due to premium features or locations.
- Strong performing properties (Top 25%) achieve nightly rates of $525 or more.
- Typical properties (Median) charge around $303 per night.
- Entry-level properties (Bottom 25%) earn around $186 per night.
Average Daily Rate (ADR) Trend by Month in Michigan City
Get Live Michigan City Market Intelligence 👇

Explore Real-time Analytics
Airbnb Seasonality Analysis & Trends in Michigan City (2026)
Peak Season (July, August, June)
- Revenue averages $8,259 per month
- Occupancy rates average 57.0%
- Daily rates average $465
Shoulder Season
- Revenue averages $3,455 per month
- Occupancy maintains around 33.0%
- Daily rates hold near $385
Low Season (January, February, March)
- Revenue drops to average $2,250 per month
- Occupancy decreases to average 28.5%
- Daily rates adjust to average $348
Seasonality Insights for Michigan City
- The Airbnb seasonality in Michigan City shows highly seasonal trends requiring careful strategy. While the sections above show seasonal averages, it's also insightful to look at the extremes:
- During the high season, the absolute peak month showcases Michigan City's highest earning potential, with monthly revenues capable of climbing to $10,531, occupancy reaching a high of 69.1%, and ADRs peaking at $476.
- Conversely, the slowest single month of the year, typically falling within the low season, marks the market's lowest point. In this month, revenue might dip to $1,918, occupancy could drop to 25.1%, and ADRs may adjust down to $327.
- Understanding both the seasonal averages and these monthly peaks and troughs in revenue, occupancy, and ADR is crucial for maximizing your Airbnb profit potential in Michigan City.
Seasonal Strategies for Maximizing Profit
- Peak Season: Maximize revenue through premium pricing and potentially longer minimum stays. Ensure high availability.
- Low Season: Offer competitive pricing, special promotions (e.g., extended stay discounts), and flexible cancellation policies. Target off-season travelers like remote workers or budget-conscious guests.
- Shoulder Seasons: Implement dynamic pricing that balances peak and low rates. Target weekend travelers or specific events. Offer slightly more flexible terms than peak season.
- Regularly analyze your own performance against these Michigan City seasonality benchmarks and adjust your pricing and availability strategy accordingly.
Best Areas for Airbnb Investment in Michigan City (2026)
Exploring the top neighborhoods for short-term rentals in Michigan City? This section highlights key areas, outlining why they are attractive for hosts and guests, along with notable local attractions. Consider these locations based on your target guest profile and investment strategy.
| Neighborhood / Area | Why Host Here? (Target Guests & Appeal) | Key Attractions & Landmarks |
|---|---|---|
| Washington Park | Close proximity to Lake Michigan and Washington Park beach makes this area a favorite among summer visitors looking for outdoor recreation and relaxation. | Washington Park Beach, Old Lighthouse Museum, Chair Factory, Gardens of the Century, Lake Michigan |
| Downtown Michigan City | The revitalized downtown area features shops, dining, and cultural attractions, appealing to guests who want to explore the local scene. | Lighthouse Place Premium Outlets, Michigan City Lighthouse, Local restaurants and cafes, Art Galleries, Parks and recreation areas |
| Trail Creek | A quieter residential area that offers a local feel while still being close to attractions, perfect for families and longer-term stays. | Trail Creek, Parks, Local shops, Community events, Nearby nature trails |
| Pottawattomie Park | This area is known for its beautiful park, ideal for outdoor activities like hiking and picnicking, as well as its proximity to the beach. | Pottawattomie Park, Nature trails, Picnic areas, Sports facilities, Beach access |
| Burns Harbor | Just a stone's throw from major Lake Michigan attractions, this area is appealing for those looking for a more peaceful stay while still being close to the action. | Burns Harbor Beach, Nearby nature preserves, Local eateries, Access to Indiana Dunes, Scenic views |
| La Porte | Nearby La Porte offers visitors additional historical and recreational attractions, making it a great option for extended stays to explore the region. | La Porte County Historical Society Museum, Parks, Walking trails, Shops and eateries, Local events |
| Dune Acres | A quaint community on Lake Michigan with stunning views and great beach access, ideal for relaxation and nature activities. | Dune Acres Beach, Nature preserves, Scenic trails, Wildlife watching, Nearby golf courses |
| Indiana Dunes National Park | This national park is a major draw for tourists seeking nature and adventure. Known for its sandy beaches, hiking trails and diverse ecosystems. | Indiana Dunes Beach, Hiking Trails, Visitor Center, Wildlife observation, Educational programs |
Understanding Airbnb License Requirements & STR Laws in Michigan City (2026)
While Michigan City, Indiana, United States currently shows low STR regulations, specific Airbnb license requirements might still exist or change. Always verify the latest short term rental regulations and Airbnb license requirements directly with local government authorities for Michigan City to ensure full compliance before hosting.
(Source: AirROI data, 2026, finding no licensed listings among those analyzed)
Top Performing Airbnb Properties in Michigan City (2026)
Benchmark your potential! Explore examples of top-performing Airbnb properties in Michigan Citybased on Trailing Twelve Month (TTM) revenue. Analyze their characteristics, revenue, occupancy rate, and ADR to understand what drives success in this market.
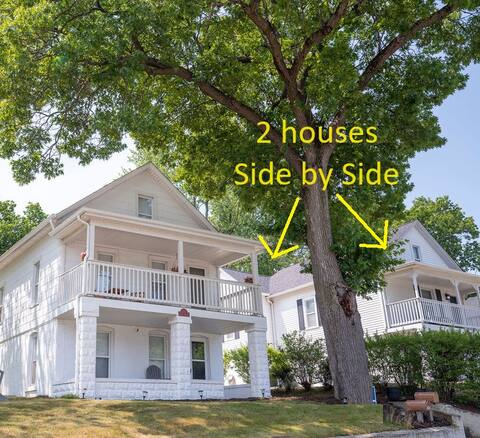
Twin Houses | Beach | 30-Guests | HotTubs | GameRm
Entire Place • 9 bedrooms
Sleep 18, Chef Experience! 12 min walk to beach
Entire Place • 7 bedrooms

The RoofTop Skybar @ Lake Avenue Mansion
Entire Place • 8 bedrooms

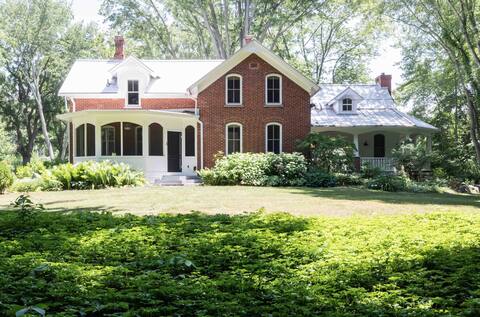
TRYON FARM MID-MODERN SPA IN THE WOODS
Entire Place • 2 bedrooms

Big Beach Front House 8br 5ba Fireplace/Pit*WiFi*
Entire Place • 8 bedrooms
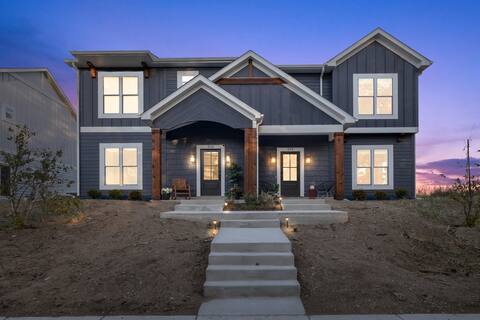
Modern Farmhouse 10 Acres & Heated Pool
Entire Place • 5 bedrooms
Note: Performance varies based on location, size, amenities, seasonality, and management quality. Data reflects the past 12 months.
Top Performing Airbnb Hosts in Michigan City (2026)
Learn from the best! This table showcases top-performing Airbnb hosts in Michigan City based on the number of properties managed and estimated total revenue over the past year. Analyze their scale and performance metrics.
| Host Name | Properties | Grossing Revenue | Stay Reviews | Avg Rating |
|---|---|---|---|---|
| Beachwalk Vacation Rentals | 104 | $3,999,040 | 320 | 4.77/5.0 |
| StayDogRentals - Jason | 13 | $1,153,965 | 659 | 4.89/5.0 |
| Kirby & Taryn | 21 | $757,153 | 2116 | 4.93/5.0 |
| MTM Premier Property Managemen | 14 | $553,829 | 395 | 4.74/5.0 |
| Jacki | 5 | $440,460 | 170 | 4.98/5.0 |
| Monica | 11 | $379,903 | 229 | 4.72/5.0 |
| Djimitri | 3 | $331,006 | 104 | 4.98/5.0 |
| Danielle | 3 | $307,159 | 119 | 4.95/5.0 |
| Todd | 4 | $266,693 | 450 | 4.76/5.0 |
| Colin | 4 | $250,668 | 531 | 4.76/5.0 |
Analyzing the strategies of top hosts, such as their property selection, pricing, and guest communication, can offer valuable lessons for optimizing your own Airbnb operations in Michigan City.
Dive Deeper: Advanced Michigan City STR Market Data (2026)
Ready to unlock more insights? AirROI provides access to advanced metrics and comprehensive Airbnb data for Michigan City. Explore detailed analytics beyond this report to refine your investment strategy, optimize pricing, and maximize your vacation rental profits.
Explore Advanced MetricsMichigan City Short-Term Rental Market Composition (2026): Property & Room Types
Room Type Distribution
Property Type Distribution
Market Composition Insights for Michigan City
- The Michigan City Airbnb market composition is heavily skewed towards Entire Home/Apt listings, which make up 95.4% of the 456 active rentals. This indicates strong guest preference for privacy and space.
- Looking at the property type distribution in Michigan City, House properties are the most common (76.3%), reflecting the local real estate landscape.
- Houses represent a significant 76.3% portion, catering likely to families or larger groups.
- The presence of 5.5% Hotel/Boutique listings indicates integration with traditional hospitality.
- Smaller segments like outdoor/unique, others, unique stays (combined 2.2%) offer potential for unique stay experiences.
Michigan City Airbnb Room Capacity Analysis (2026): Bedroom Distribution
Distribution of Listings by Number of Bedrooms
Room Capacity Insights for Michigan City
- The dominant room capacity in Michigan City is 5+ bedrooms listings, making up 23.7% of the market. This suggests a strong demand for properties suitable for families or small groups.
- Together, 5+ bedrooms and 3 bedrooms properties represent 47.2% of the active Airbnb listings in Michigan City, indicating a high concentration in these sizes.
- A significant 62.3% of listings offer 3+ bedrooms, catering to larger groups and families seeking more space in Michigan City.
Michigan City Vacation Rental Guest Capacity Trends (2026)
Distribution of Listings by Guest Capacity
Guest Capacity Insights for Michigan City
- The most common guest capacity trend in Michigan City vacation rentals is listings accommodating 8+ guests (53.1%). This suggests the primary traveler segment is likely larger groups.
- Properties designed for 8+ guests and 4 guests dominate the Michigan City STR market, accounting for 69.8% of listings.
- 72.4% of properties accommodate 6+ guests, serving the market segment for larger families or group travel in Michigan City.
- On average, properties in Michigan City are equipped to host 6.5 guests.
Michigan City Airbnb Booking Patterns (2026): Available vs. Booked Days
Available Days Distribution
Booked Days Distribution
Booking Pattern Insights for Michigan City
- The most common availability pattern in Michigan City falls within the 271-366 days range, representing 47.1% of listings. This suggests many properties have significant open periods on their calendars.
- Approximately 86.4% of listings show high availability (181+ days open annually), indicating potential for increased bookings or specific owner usage patterns.
- For booked days, the 91-180 days range is most frequent in Michigan City (40.6%), reflecting common guest stay durations or potential owner blocking patterns.
- A notable 15.2% of properties secure long booking periods (181+ days booked per year), highlighting successful long-term rental strategies or significant owner usage.
Michigan City Airbnb Minimum Stay Requirements Analysis
Distribution of Listings by Minimum Night Requirement
1 Night
67 listings
14.7% of total
2 Nights
93 listings
20.4% of total
3 Nights
15 listings
3.3% of total
4-6 Nights
6 listings
1.3% of total
7-29 Nights
9 listings
2% of total
30+ Nights
266 listings
58.3% of total
Key Insights
- The most prevalent minimum stay requirement in Michigan City is 30+ Nights, adopted by 58.3% of listings. This highlights the market's preference for longer commitments.
- A significant segment (58.3%) caters to monthly stays (30+ nights) in Michigan City, pointing to opportunities in the extended-stay market.
Recommendations
- Align with the market by considering a 30+ Nights minimum stay, as 58.3% of Michigan City hosts use this setting.
- If feasible, allowing 1-night stays, especially midweek or during low season, could capture last-minute bookings, as only 14.7% currently do.
- Explore offering discounts for stays of 30+ nights to attract the 58.3% of the market seeking extended stays.
- Adjust minimum nights based on seasonality – potentially shorter during low season and longer during peak demand periods in Michigan City.
Michigan City Airbnb Cancellation Policy Trends Analysis (2026)
Super Strict 30 Days
109 listings
23.9% of total
Super Strict 60 Days
2 listings
0.4% of total
Limited
4 listings
0.9% of total
Flexible
22 listings
4.8% of total
Moderate
94 listings
20.6% of total
Firm
164 listings
36% of total
Strict
61 listings
13.4% of total
Cancellation Policy Insights for Michigan City
- The prevailing Airbnb cancellation policy trend in Michigan City is Firm, used by 36% of listings.
- There's a relatively balanced mix between guest-friendly (25.4%) and stricter (49.4%) policies, offering choices for different guest needs.
Recommendations for Hosts
- Consider adopting a Firm policy to align with the 36% market standard in Michigan City.
- Using a Strict policy might deter some guests, as only 13.4% of listings use it. Evaluate if potential revenue protection outweighs possible lower booking rates.
- Regularly review your cancellation policy against competitors and market demand shifts in Michigan City.
Michigan City STR Booking Lead Time Analysis (2026)
Average Booking Lead Time by Month
Booking Lead Time Insights for Michigan City
- The overall average booking lead time for vacation rentals in Michigan City is 55 days.
- Guests book furthest in advance for stays during July (average 96 days), likely coinciding with peak travel demand or local events.
- The shortest booking windows occur for stays in February (average 16 days), indicating more last-minute travel plans during this time.
- Seasonally, Summer (83 days avg.) sees the longest lead times, while Winter (26 days avg.) has the shortest, reflecting typical travel planning cycles.
Recommendations for Hosts
- Use the overall average lead time (55 days) as a baseline for your pricing and availability strategy in Michigan City.
- For July stays, consider implementing length-of-stay discounts or slightly higher rates for bookings made less than 96 days out to capitalize on advance planning.
- Target marketing efforts for the Summer season well in advance (at least 83 days) to capture early planners.
- Monitor your own booking lead times against these Michigan City averages to identify opportunities for dynamic pricing adjustments.
Popular & Essential Airbnb Amenities in Michigan City (2026)
Amenity Prevalence
Amenity Insights for Michigan City
- Essential amenities in Michigan City that guests expect include: Wifi, Air conditioning, Smoke alarm, TV, Heating, Kitchen, Coffee maker, Dishes and silverware, Refrigerator. Lacking these (any) could significantly impact bookings.
- Popular amenities like Microwave are common but not universal. Offering these can provide a competitive edge.
Recommendations for Hosts
- Ensure your listing includes all essential amenities for Michigan City: Wifi, Air conditioning, Smoke alarm, TV, Heating, Kitchen, Coffee maker, Dishes and silverware, Refrigerator.
- Prioritize adding missing essentials: Wifi, Air conditioning, Smoke alarm, TV, Heating, Kitchen, Coffee maker, Dishes and silverware, Refrigerator.
- Consider adding popular differentiators like Microwave to increase appeal.
- Highlight unique or less common amenities you offer (e.g., hot tub, dedicated workspace, EV charger) in your listing description and photos.
- Regularly check competitor amenities in Michigan City to stay competitive.
Michigan City Airbnb Guest Demographics & Profile Analysis (2026)
Guest Profile Summary for Michigan City
- The typical guest profile for Airbnb in Michigan City consists of primarily domestic travelers (98%), often arriving from nearby Chicago, typically belonging to the Post-2000s (Gen Z/Alpha) group (50%), primarily speaking English or Spanish.
- Domestic travelers account for 97.8% of guests.
- Key international markets include United States (97.8%) and Canada (0.4%).
- Top languages spoken are English (73.4%) followed by Spanish (11.9%).
- A significant demographic segment is the Post-2000s (Gen Z/Alpha) group, representing 50% of guests.
Recommendations for Hosts
- Target domestic marketing efforts towards travelers from Chicago and Indianapolis.
- Tailor amenities and listing descriptions to appeal to the dominant Post-2000s (Gen Z/Alpha) demographic (e.g., highlight fast WiFi, smart home features, local guides).
- Highlight unique local experiences or amenities relevant to the primary guest profile.
- Consider seasonal promotions aligned with peak travel times for key origin markets.
Nearby Short-Term Rental Market Comparison
How does the Michigan City Airbnb market stack up against its neighbors? Compare key performance metrics like average monthly revenue, ADR, and occupancy rates in surrounding areas to understand the broader regional STR landscape.
| Market | Active Properties | Monthly Revenue | Daily Rate | Avg. Occupancy |
|---|---|---|---|---|
| Laketown Township | 59 | $6,112 | $529.59 | 44% |
| Port Sheldon Township | 26 | $6,015 | $566.98 | 47% |
| Ganges Township | 69 | $5,687 | $636.25 | 38% |
| Saugatuck Township | 141 | $5,627 | $508.58 | 43% |
| Paw Paw Township | 10 | $5,458 | $418.85 | 49% |
| New Buffalo Township | 260 | $5,145 | $633.18 | 36% |
| Bertrand Township | 22 | $5,011 | $365.69 | 40% |
| Union Pier | 16 | $4,998 | $659.10 | 36% |
| Fremont | 16 | $4,898 | $436.31 | 42% |
| Fennville | 34 | $4,874 | $542.47 | 42% |